Back to blog
Research

Best Crypto OTC Desks for Large Block Trades (2025)

Move size without moving the market. See the 10 best OTC crypto desks for discreet block trades, plus region notes and a quick selection checklist.
Sam Monac
5 min
Want Smarter Crypto Picks—Free?
See unbiased Token Metrics Ratings for BTC, ETH, and top alts.
Thank you! Your submission has been received!
Oops! Something went wrong while submitting the form.
 No credit card | 1-click unsubscribe

Why OTC Crypto Desks Matter in September 2025

When you need to move size without moving the market, you use over-the-counter (OTC) trading. The best OTC desks for large block trades aggregate deep, private liquidity, offer quote certainty (via RFQ), and settle securely—often with high-touch coverage. In one sentence: an OTC crypto desk privately matches large buyers and sellers off-exchange to reduce slippage and information leakage. This guide is for funds, treasuries, family offices, market makers, and whales who want discretion, fast settlement, and reliable pricing in 2025. We compared global OTC providers on liquidity depth, security posture, coverage, costs, UX, and support, and selected 10 standouts. Expect clear use-case picks, region notes, and a simple checklist so you can choose faster.

How We Picked (Methodology & Scoring)

  • Liquidity (30%): Can they consistently quote and fill blocks across majors, stables, and liquid alts? Internalization, networked venues, and RFQ performance matter most.
  • Security (25%): Regulatory status/registrations where applicable, segregation/custody design, operational controls, and incident track record.
  • Market Coverage (15%): Spot + (when offered) options/forwards, fiat rails, and breadth of supported assets.
  • Costs (15%): Explicit desk fees, spreads, settlement costs, and financing.
  • UX (10%): RFQ tooling/eOTC portals, API access, reporting.
  • Support (5%): 24/7 desk coverage, onboarding speed, account management.

Data sources: official product/docs and institutional pages; security/transparency pages; and widely cited market datasets only for cross-checks (we do not link third-party sources in body). Last updated September 2025.

Top 10 OTC Crypto Trading Desks in September 2025

1. Coinbase Institutional — Best for U.S.-regulated agency execution

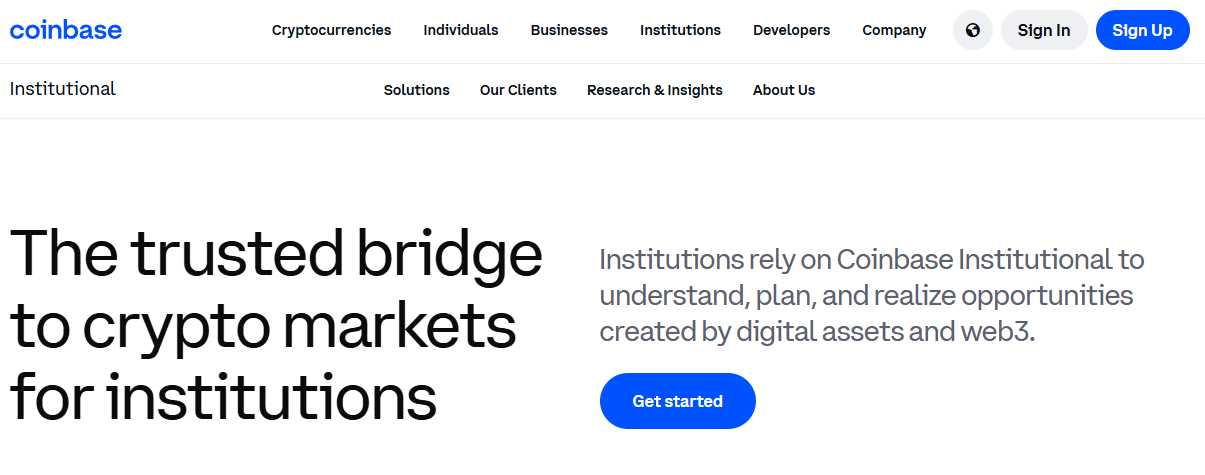
  • Why Use It: Coinbase Prime combines custody, financing, and execution with Coinbase Execution Services (high-touch, agency-only). You get access to Coinbase Exchange liquidity plus external venues, with desk support for complex orders. Strong brand, strong controls, and U.S. regulatory footprint.
  • Best For: U.S. funds, corporates, RIAs, and institutions needing regulated workflows.
  • Notable Features: Prime brokerage + custody, agency execution desk, 240+ assets access, multi-venue routing.
  • Consider If: You want agency execution and deep U.S. coverage (not principal risk transfer).
  • Regions: Global; strong U.S./EU presence (eligibility varies).
  • Fees Notes: Pricing depends on product/tier; agency execution spreads/fees apply.
  • Alternatives: Kraken OTC, Galaxy Digital.

2. Kraken OTC — Best 24/7 RFQ coverage with derivatives options

  • Why Use It: High-touch OTC for spot, plus an OTC Derivatives offering (options/structured products) and 24/7/365 coverage. The desk is built for discretion and deeper liquidity with competitive settlement.
  • Best For: Funds seeking large spot blocks and optional custom derivatives.
  • Notable Features: Chat/RFQ workflow, options/structured products, private settlement, institutional onboarding.
  • Consider If: You want around-the-clock coverage and occasional options blocks.
  • Regions: Global; availability varies by jurisdiction.
  • Fees Notes: RFQ-based; fees/spreads depend on product and size.
  • Alternatives: Coinbase Institutional, B2C2.

3. Binance OTC & Execution Solutions — Best global liquidity at scale (non-U.S.)

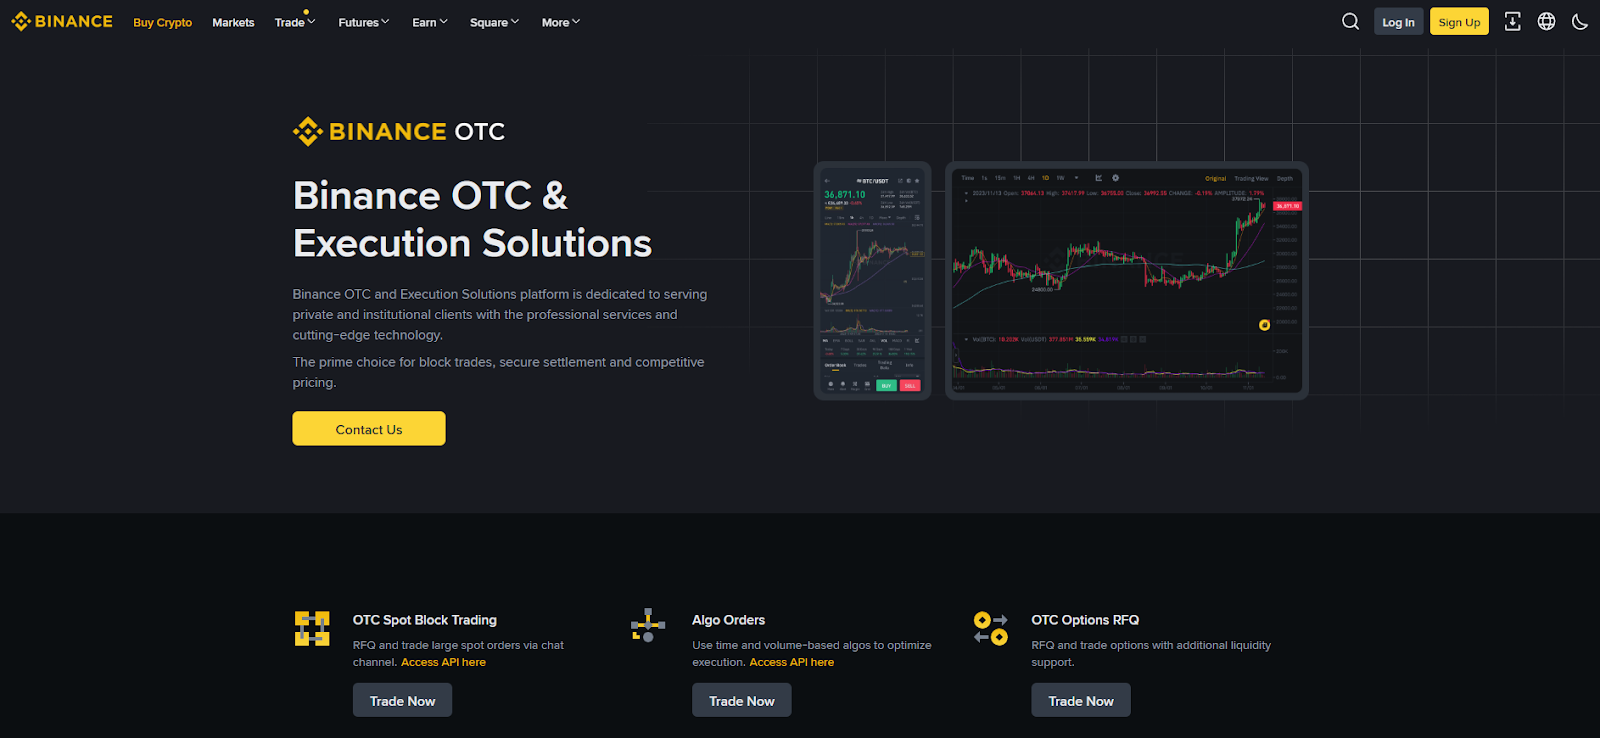
  • Why Use It: For non-U.S. institutions, Binance’s OTC platform offers spot block trades, algos, and options RFQs—tapping one of the deepest liquidity networks. Fast pricing via RFQ and robust portal access.
  • Best For: Global funds, prop firms, market makers outside the U.S.
  • Notable Features: Spot block RFQ, algo orders, options RFQ, API access.
  • Consider If: You’re not a U.S. person; U.S. residents should use Binance.US OTC.
  • Regions: Global (ex-US); regional eligibility and KYC apply.
  • Fees Notes: RFQ-based; programmatic pricing for VIP tiers.
  • Alternatives: OKX Liquid Marketplace, Wintermute.

4. OKX Liquid Marketplace — Best for block trading tools and RFQ hub

  • Why Use It: A purpose-built block trading/RFQ venue with minimum asset requirements and education around block execution. Effective for discreet fills, multi-leg structures, and streaming quotes from LPs.
  • Best For: Non-U.S. institutions needing self-serve block tools.
  • Notable Features: Block/RFQ portal, minimum asset threshold, docs & tutorials, multi-asset coverage.
  • Consider If: U.S. access is limited; check the OKX U.S. site for constraints.
  • Regions: Global (varies); limited U.S. functionality.
  • Fees Notes: RFQ spreads; venue-specific fees may apply.
  • Alternatives: Binance OTC, Bybit Block Trading (alt).

5. Bitstamp Institutional OTC — Best for fiat rails + time-tested venue

  • Why Use It: A long-running exchange with strong fiat on/off-ramps and an institutional OTC workflow led by account managers. Good for conservative treasuries that prioritize settlement reliability.
  • Best For: Corporates, treasuries, conservative funds wanting robust fiat access.
  • Notable Features: Bespoke OTC service, flexible execution, institutional coverage, multi-jurisdiction licenses.
  • Consider If: You want a seasoned, fiat-friendly counterparty over maximum token breadth.
  • Regions: Global (eligibility varies by entity); U.S./EU presence.
  • Fees Notes: RFQ-based; program pricing with account manager.
  • Alternatives: Coinbase Institutional, Gemini eOTC (alt).

6. Cumberland (DRW) — Best principal liquidity for blocks and bespoke risk transfer

  • Why Use It: A pioneer OTC liquidity provider offering spot, listed derivatives blocks, and bilateral options—designed for size and custom risk transfer. Suits funds that want a direct principal counterparty.
  • Best For: Hedge funds, market makers, HNW desks needing principal risk warehousing.
  • Notable Features: Institutional OTC in dozens of assets, no pre-funding for eligible clients, bilateral options, listed blocks.
  • Consider If: You prefer direct LP quotes vs. agency brokers.
  • Regions: Global (KYC/eligibility apply).
  • Fees Notes: Embedded in spread; bespoke terms by relationship.
  • Alternatives: B2C2, Wintermute.

7. B2C2 — Best all-in-one OTC LP (spot + CFDs/NDFs/options)

  • Why Use It: A crypto-native LP trusted by institutions globally, with OTC spot plus institutional-grade derivatives (CFDs, options, NDFs). API/GUI access and tailored settlement make it versatile for funds.
  • Best For: Funds needing flexible products and global coverage.
  • Notable Features: OTC spot streaming, CFD/options/NDFs, tailored settlement, API + GUI.
  • Consider If: You want one counterparty for both spot and derivatives.
  • Regions: Global (eligibility varies).
  • Fees Notes: Spread-based; relationship-driven terms.
  • Alternatives: Cumberland, Galaxy.

8. FalconX — Best prime brokerage + OTC under one roof

  • Why Use It: A leading institutional prime broker with 24/7 electronic and OTC trading, deep pooled liquidity, and financing. Strong for programmatic execution plus high-touch blocks through one relationship.
  • Best For: Quant funds, treasuries, crossover firms wanting prime + OTC.
  • Notable Features: Unified liquidity pool, eTrading + OTC desk, financing, 400+ tokens access (restrictions may apply)
  • Consider If: You want consolidated services (execution + financing).
  • Regions: Global (KYC/eligibility apply).
  • Fees Notes: Spread/financing; custom terms by volume.
  • Alternatives: Coinbase Prime, Galaxy.

9. Wintermute OTC — Best for fast pricing across many assets

  • Why Use It: Algorithmic market maker offering OTC liquidity across spot, options, forwards, and tailored structures—useful when you need instantaneous, competitive quotes on long-tail assets as well as majors.
  • Best For: Funds trading majors and select alts with principal LP quotes.
  • Notable Features: OTC across spot/derivs, broad asset list, tailored products, institutional coverage.
  • Consider If: You value speed and asset breadth with a principal LP.
  • Regions: Global (eligibility applies).
  • Fees Notes: Spread-based; relationship pricing.
  • Alternatives: B2C2, Cumberland.

10. Galaxy Global Markets — Best for high-touch blocks + OTC derivatives at scale

  • Why Use It: Galaxy runs a large OTC operation with electronic trading, block risk transfer, and bespoke derivatives (options/forwards/swaps). Good fit for institutions that want principal liquidity plus broader institutional services.
  • Best For: Hedge funds, crossover managers, corporates needing tailored blocks.
  • Notable Features: OTC/eTrading, derivatives suite, warehouse risk capacity, institutional coverage.
  • Consider If: You want a multi-product institutional counterparty.
  • Regions: Global (KYC/eligibility apply).
  • Fees Notes: Spread/derivatives pricing by mandate.
  • Alternatives: Kraken OTC, FalconX.

Decision Guide: Best By Use Case

  • Regulated U.S. + agency execution: Coinbase Institutional.
  • 24/7 coverage with options: Kraken OTC.
  • Maximum global liquidity (non-U.S.): Binance OTC & Execution Solutions.
  • Self-serve block/RFQ portal: OKX Liquid Marketplace.
  • Fiat rails for treasuries: Bitstamp Institutional OTC.
  • Principal liquidity for size: Cumberland
  • Spot + derivatives in one LP: B2C2
  • Prime + OTC under one roof: FalconX.
  • Fast quotes on many assets: Wintermute.
  • Blocks + derivatives at scale: Galaxy Global Markets

How to Choose the Right Crypto OTC Desk (Checklist)

  • Region & eligibility: Confirm entity onboarding (U.S./EU/APAC) and product permissions.
  • Liquidity fit: Can they quote your typical size across your pairs—majors, stables, alts?
  • Custody & settlement: How are assets custodied/segregated? Fiat rails? Settlement windows?
  • Execution style: Agency vs. principal. RFQ portal vs. chat. Derivatives availability.
  • Costs: Ask for sample RFQs; compare spreads, borrow/financing, and any desk fees.
  • Ops & reporting: Settlement netting, T+ timing, confirmations, and post-trade reports.
  • Support: 24/7 coverage, dedicated manager, escalation paths.
  • Red flags: Vague KYC/AML, unclear settlement instructions, or “too good” pricing without documentation.

Use Token Metrics With Any Crypto OTC Desk

  • AI Ratings to screen narratives and risk across assets before you request quotes.

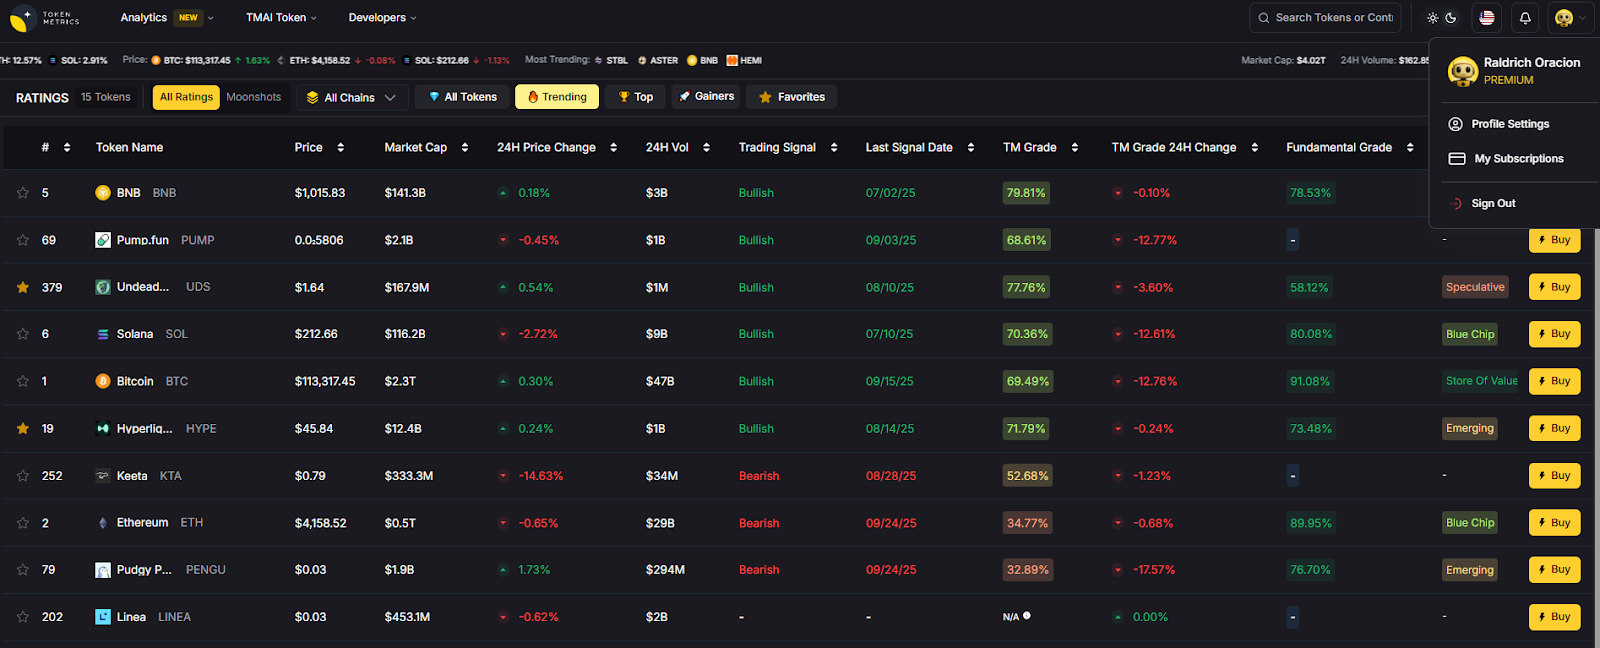
  • Narrative Detection to spot momentum shifts that affect liquidity and spreads.
  • Portfolio Optimization to size positions and hedge exposures you’ll execute via OTC.
  • Alerts/Signals to monitor entries/exits and rebalance post-trade.


Workflow: Research in Token Metrics → Shortlist assets → Request OTC RFQs/execute → Monitor with Alerts.

Start free trial NOW!

Security & Compliance Tips

  • Enable strong 2FA and restrict desk communications to verified channels.

  • Use segregated, labeled wallets for OTC settlement; test small first.

  • Complete KYC/AML early; pre-clear signers/wallets to speed settlement.

  • Confirm settlement instructions and reference fields to avoid misposts.

  • For derivatives, document payoff, margining, and close-out mechanics.

This article is for research/education, not financial advice.

Beginner Mistakes to Avoid

  • Relying on one counterparty without backups during volatile windows.

  • Forgetting to confirm net vs. gross settlement amounts and deadlines.

  • Ignoring custody/withdrawal timelines when planning fiat legs.

  • Requesting quotes on illiquid alts without warning—expect wide spreads.

  • Disclosing sensitive trade info over unsecured channels.

FAQs

What is an OTC crypto desk?
An OTC desk privately matches large buyers and sellers off public order books to minimize slippage and information leakage. Trades are negotiated via RFQ and settled bilaterally or through an exchange affiliate.

How big is a “block trade” in crypto?
It varies by desk and asset. Many desks treat six-figure USD notional as a starting point; some exchange-affiliated desks list thresholds or minimum asset requirements in portals.

Do U.S. clients have fewer options?
U.S. institutions often prefer regulated venues and agency models (e.g., Coinbase Institutional, Kraken). Some global platforms are limited for U.S. persons; check eligibility before onboarding.

What fees should I expect?
Most OTC pricing is embedded in the spread. Some venues disclose desk or user-to-user OTC fees (e.g., Bitfinex lists 0.1% for certain OTC flows); always request example RFQs.

Is OTC safer than exchanging on-book?
Neither is inherently “safer.” OTC can reduce market impact and information leakage, but you still need strong KYC/custody, verified comms, and clear settlement procedures.

Conclusion + Related Reads

If you’re a U.S.-regulated fund that values agency execution, start with Coinbase Institutional or Kraken. If you need global, principal liquidity and breadth, look at Binance OTC, OKX, Cumberland, B2C2, Wintermute, FalconX, or Galaxy. Match the desk to your region, execution style (agency vs. principal), and settlement needs, then run trial quotes before you scale.

Build Smarter Crypto Apps &
AI Agents in Minutes, Not Months
Real-time prices, trading signals, and on-chain insights all from one powerful API.
Grab a Free API Key
About Token Metrics
Token Metrics: AI-powered crypto research and ratings platform. We help investors make smarter decisions with unbiased Token Metrics Ratings, on-chain analytics, and editor-curated “Top 10” guides. Our platform distills thousands of data points into clear scores, trends, and alerts you can act on.
30 Employees
analysts, data scientists, and crypto engineers
Daily Briefings
concise market insights and “Top Picks”
Transparent & Compliant
Sponsored ≠ Ratings; research remains independent
Want Smarter Crypto Picks—Free?
See unbiased Token Metrics Ratings for BTC, ETH, and top alts.
Thank you! Your submission has been received!
Oops! Something went wrong while submitting the form.
 No credit card | 1-click unsubscribe
Token Metrics Team
Token Metrics Team

Recent Posts

Research

Hedera Price Prediction 2027: $0.10-$1.42 Target Analysis

Token Metrics Team
8 min read

Hedera Price Prediction: Portfolio Context for HBAR in the 2027 Landscape

Layer 1 tokens like Hedera represent bets on specific blockchain architectures winning developer and user mindshare. HBAR carries both systematic crypto risk and unsystematic risk from Hedera's technical roadmap execution and ecosystem growth. Multi-chain thesis suggests diversifying across several L1s rather than concentrating in one, since predicting which chains will dominate remains difficult.

The price prediction projections below show how HBAR might perform under different market cap scenarios. While Hedera may have strong fundamentals, prudent portfolio construction balances L1 exposure across Ethereum, competing smart contract platforms, and Bitcoin to capture the sector without overexposure to any single chain's fate.


Disclosure

Educational purposes only, not financial advice. Crypto is volatile, do your own research and manage risk.

How to read this price prediction:

Each band blends cycle analogues and market-cap share math with TA guardrails. Base assumes steady adoption and neutral or positive macro. Moon layers in a liquidity boom. Bear assumes muted flows and tighter liquidity.

TM Agent baseline:

Token Metrics lead metric for Hedera price prediction, cashtag $HBAR, is a TM Grade of 61.8%, which maps to Hold, and the trading signal is bearish, indicating short-term downward momentum. This means Token Metrics views $HBAR as having reasonably solid fundamentals but limited conviction for strong outperformance in the near term.

A concise long-term numeric price prediction view for a 12-month horizon: Token Metrics scenarios center around a range of about $0.06 to $0.18, with a base case price target near $0.10, reflecting steady ecosystem growth, moderate adoption of Hedera services, and continued enterprise partnerships. Implication: if Bitcoin and broader crypto risk appetite improve, $HBAR could revisit the higher end of the price prediction range, while a risk-off market or slower-than-expected developer traction would keep it toward the lower bound.

Token Details

Key Takeaways

  • Scenario driven, outcomes hinge on total crypto market cap, higher liquidity and adoption lift the bands.
  • Single-asset concentration amplifies both upside and downside versus diversified approaches.
  • Fundamentals: Fundamental Grade 81.08% (Community 74%, Tokenomics 100%, Exchange 100%, VC 59%, DeFi Scanner 85%).
  • Technology: Technology Grade 62.39% (Activity 58%, Repository 68%, Collaboration 74%, Security 56%, DeFi Scanner 85%).
  • TM Agent gist: bearish short term, range view with upside if crypto risk appetite improves.
  • Education only, not financial advice.

Hedera Price Prediction: Scenario Analysis

Token Metrics price prediction scenarios span four market cap tiers, each representing different levels of crypto market maturity and liquidity:

8T Market Cap Price Prediction:

At an 8 trillion dollar total crypto market cap, HBAR price prediction projects to $0.27 in bear conditions, $0.32 in the base case, and $0.37 in bullish scenarios.

16T Market Cap Price Prediction:

Doubling the market to 16 trillion expands the price prediction range to $0.42 (bear), $0.57 (base), and $0.72 (moon).

23T Market Cap Price Prediction:

At 23 trillion, the price forecast scenarios show $0.56, $0.82, and $1.07 respectively.

31T Market Cap Price Prediction:

In the maximum liquidity scenario of 31 trillion, HBAR price prediction could reach $0.71 (bear), $1.07 (base), or $1.42 (moon).

These price prediction ranges illustrate potential outcomes for concentrated HBAR positions, but investors should weigh whether single-asset exposure matches their risk tolerance or whether diversified strategies better suit their objectives.

The Case for Diversified Index Exposure

Professional investors across asset classes prefer diversified exposure over concentrated bets for good reason. Hedera faces numerous risks - technical vulnerabilities, competitive pressure, regulatory targeting, team execution failure - any of which could derail HBAR performance independent of broader market conditions. Token Metrics Indices spread this risk across one hundred tokens, ensuring no single failure destroys your crypto portfolio.

Diversification becomes especially critical in crypto given the sector's nascency and rapid evolution. Technologies and narratives that dominate today may be obsolete within years as the space matures. By holding HBAR exclusively, you're betting not only on crypto succeeding but on Hedera specifically remaining relevant. Index approaches hedge against picking the wrong horse while maintaining full crypto exposure.

Tax efficiency and rebalancing challenges also favor indices over managing concentrated positions. Token Metrics Indices handle portfolio construction, rebalancing, and position sizing systematically, eliminating the emotional and logistical burden of doing this manually with multiple tokens.

Early access to Token Metrics Indices 

What Is Hedera?

Hedera is a high-performance public ledger that emphasizes speed, low fees, and energy efficiency, positioning itself for enterprise and decentralized applications. It uses a unique Hashgraph consensus that enables fast finality and high throughput, paired with a council-governed model that targets real-world use cases like payments, tokenization, and decentralized identity.

HBAR is the native token used for fees, staking, and network security, and it supports smart contracts and decentralized file storage. Adoption draws from partnerships and integrations, though decentralization levels and reliance on institutional demand are often discussed in the community.

Token Metrics AI Analysis for Price Prediction

Token Metrics AI provides comprehensive context on Hedera's positioning and challenges that inform our price prediction models.

  • Vision: Hedera's vision is to provide a secure, fair, and scalable distributed ledger technology platform that supports decentralized applications and enterprise use cases globally. It emphasizes governed decentralization, aiming to combine the benefits of distributed systems with responsible oversight through its council-based governance model.
  • Problem: Many blockchain networks face trade-offs between scalability, security, and decentralization, often resulting in high transaction fees, slow processing times, or environmental concerns. Hedera aims to address these limitations by offering a system that supports high throughput and fast finality without sacrificing security or incurring significant energy costs, making it suitable for both enterprise and decentralized applications.
  • Solution: Hedera uses the Hashgraph consensus algorithm, a directed acyclic graph (DAG)-based approach that achieves asynchronous Byzantine fault tolerance, enabling fast, secure, and fair transaction processing. The network supports smart contracts, tokenization, and decentralized file storage, with HBAR serving as the native token for fees, staking, and network security. Its council-governed model aims to ensure stability and trust, particularly for institutional and enterprise users.
  • Market Analysis: Hedera operates in the Layer 1 blockchain space, competing with high-throughput platforms like Solana, Avalanche, and Algorand, while differentiating through its Hashgraph consensus and governed governance model. It targets enterprise adoption, focusing on use cases in supply chain, payments, and asset tokenization, which sets it apart from more community-driven or DeFi-centric networks. Adoption is influenced by strategic partnerships, developer engagement, and real-world integrations rather than speculative activity. Key risks include competition from established and emerging blockchains, regulatory scrutiny around governance tokens, and challenges in achieving broad decentralization.

Fundamental and Technology Snapshot from Token Metrics

Fundamental Grade: 81.08% (Community 74%, Tokenomics 100%, Exchange 100%, VC 59%, DeFi Scanner 85%).


Technology Grade: 62.39% (Activity 58%, Repository 68%, Collaboration 74%, Security 56%, DeFi Scanner 85%).


Catalysts That Skew Bullish for Price Prediction

  • Institutional and retail access expands with ETFs, listings, and integrations
  • Macro tailwinds from lower real rates and improving liquidity
  • Product or roadmap milestones such as upgrades, scaling, or partnerships
  • These factors could push HBAR toward higher price prediction targets

Risks That Skew Bearish for Price Prediction

  • Macro risk-off from tightening or liquidity shocks
  • Regulatory actions or infrastructure outages
  • Concentration in validator economics and competitive displacement
  • Protocol-specific execution risk and competitive pressure from alternatives
  • These factors could push HBAR toward lower price prediction scenarios

FAQs: Hedera Price Prediction

Can HBAR reach $1.00 according to price predictions?

Yes. Based on the price prediction scenarios, HBAR could reach $1.00 or above in the higher tiers. The 23T tier projects $1.07 in the moon case price forecast and the 31T tier projects $1.42 in the moon case. Achieving this price prediction requires broad market cap expansion and Hedera maintaining competitive position. Not financial advice.

What price could HBAR reach in the moon case price prediction?

Moon case price predictions range from $0.37 at 8T to $1.42 at 31T total crypto market cap. These price prediction scenarios assume maximum liquidity expansion and strong Hedera adoption. Diversified strategies aim to capture upside across multiple tokens rather than betting exclusively on any single moon scenario. Not financial advice.

What's the risk/reward profile for HBAR price prediction?

Risk and reward in our price prediction model span from $0.27 in the lowest bear case to $1.42 in the highest moon case. Downside risks include regulatory or infrastructure setbacks and competitive pressure, while upside drivers include improved liquidity and enterprise adoption. Concentrated positions amplify both tails, while diversified strategies smooth outcomes.

What is the 2027 Hedera price prediction?

Based on Token Metrics analysis, the 2027 price prediction for Hedera centers around $0.10 in the base case under current market conditions, with a range between $0.06 and $0.18 depending on market scenarios. Bullish price predictions range from $0.32 to $1.42 across different total crypto market cap environments.

What drives HBAR price predictions?

HBAR price predictions are driven by enterprise adoption of Hashgraph technology, institutional partnerships (Google Cloud, IBM, Boeing), council governance decisions, and competition from other Layer 1 platforms. The strong fundamentals (81.08% grade) support long-term price potential, though short-term bearish signals suggest caution. Enterprise use case development remains the primary driver for reaching upper price prediction targets.

Can HBAR reach $0.50 by 2027?

According to our price prediction models, HBAR could reach $0.50+ in multiple scenarios: the 16T base case ($0.57), 16T moon case ($0.72), and all higher market cap tiers. This price prediction outcome requires steady crypto market growth (16T+ total market cap) and Hedera maintaining strong enterprise partnerships. Not financial advice.


Next Steps

Disclosure

Educational purposes only, not financial advice. Crypto is volatile, concentration amplifies risk, and diversification is a fundamental principle of prudent portfolio construction. Do your own research and manage risk appropriately.

Research

LEO Token Price Prediction: Comprehensive Market Cap Scenario Analysis

Token Metrics Team
5 min read

LEO Token Price Prediction Framework: Market Cap Scenarios

Exchange tokens derive value from trading volume and platform revenue, creating linkage between crypto market activity and LEO price action. LEO Token delivers utility through reduced trading fees and enhanced platform services on Bitfinex and iFinex across Ethereum and EOS. Token Metrics price prediction scenarios below model LEO outcomes across different total crypto market cap environments, providing investors with data-driven forecasts for strategic decision-making.


Disclosure

Educational purposes only, not financial advice. Crypto is volatile, do your own research and manage risk.

How to Read This LEO Price Prediction

Each band blends cycle analogues and market-cap share math with TA guardrails. Base assumes steady adoption and neutral or positive macro. Moon layers in a liquidity boom. Bear assumes muted flows and tighter liquidity.

TM Agent baseline: Token Metrics price prediction probabilities favor a modest range between about $5 and $15, with a base case around current levels near $9, conditional on exchange token utility remaining steady, and downside risk if centralized exchange macro pressure increases.

Live details: Token Details 

Key Takeaways

  • Scenario driven, outcomes hinge on total crypto market cap, higher liquidity and adoption lift the bands.
  • TM Agent gist: 12-month horizon favors $5 to $15 range with base case near $9, contingent on stable exchange utility.
  • Education only, not financial advice.

LEO Token Price Prediction Scenario Analysis

Token Metrics price prediction scenarios span four market cap tiers reflecting different crypto market maturity levels:

8T Market Cap - LEO Price Prediction:

At 8 trillion total crypto market cap, LEO price prediction projects to $11.35 in bear conditions, $12.92 in the base case, and $14.48 in bullish scenarios.

16T Market Cap - LEO Price Prediction:

At 16 trillion total crypto market cap, LEO price prediction projects to $14.82 in bear conditions, $19.51 in the base case, and $24.20 in bullish scenarios.

23T Market Cap - LEO Price Prediction:

At 23 trillion total crypto market cap, LEO price prediction projects to $18.28 in bear conditions, $26.10 in the base case, and $33.92 in bullish scenarios.

31T Market Cap - LEO Price Prediction:

At 31 trillion total crypto market cap, LEO price prediction projects to $21.74 in bear conditions, $32.69 in the base case, and $43.63 in bullish scenarios.

Each tier in our price prediction framework assumes progressively stronger market conditions, with base scenarios reflecting steady exchange growth and moon cases requiring sustained bull market dynamics.

What Is LEO Token?

LEO Token is the native utility token of the Bitfinex and iFinex ecosystem, designed to provide benefits like reduced trading fees, enhanced lending and borrowing terms, and access to exclusive features on the platform. It operates on both Ethereum (ERC-20) and EOS blockchains, offering flexibility for users.

The primary role of LEO is to serve as a utility token within the exchange ecosystem, enabling fee discounts, participation in token sales, and other platform-specific advantages. Common usage patterns include holding LEO to reduce trading costs and utilizing it for enhanced platform services, positioning it primarily within the exchange token sector.

Catalysts That Skew LEO Price Predictions Bullish

  • Institutional and retail access expands with ETFs, listings, and integrations
  • Macro tailwinds from lower real rates and improving liquidity
  • Product or roadmap milestones such as upgrades, scaling, or partnerships
  • Increased Bitfinex trading volume and platform adoption
  • Strategic token burns and buyback programs

Risks That Skew LEO Price Predictions Bearish

  • Macro risk-off from tightening or liquidity shocks
  • Regulatory actions targeting centralized exchanges or infrastructure outages
  • Concentration risk or competitive displacement from rival exchange tokens
  • Declining exchange market share or trading volume
  • Negative sentiment around centralized exchange tokens

LEO Token Price Prediction FAQs

What gives LEO value?

LEO accrues value through reduced trading fees and enhanced platform services within the Bitfinex and iFinex ecosystem. Demand drivers include exchange usage and access to platform features, while supply dynamics follow the token's exchange utility design. Value realization depends on platform activity and user adoption—key factors in our price prediction methodology.

What price could LEO reach in the moon case?

Our moon case price predictions range from $14.48 at 8T to $43.63 at 31T total crypto market cap. These scenarios require maximum market cap expansion and strong exchange activity. Not financial advice.

What is the LEO Token price prediction for 2025-2027?

Our comprehensive price prediction framework suggests LEO could trade between $5 and $43.63 depending on market conditions and total crypto market capitalization. The base case price prediction scenario clusters around $9 to $32.69 across different market cap environments over the next 12-24 months. Not financial advice.

Can LEO Token reach $20?

Yes. Based on our price prediction scenarios, LEO could reach $19.51 in the 16T base case and surpass $20 in higher market cap scenarios (23T and 31T tiers). The 23T base case projects $26.10, making $20 an achievable target under favorable market conditions. Not financial advice.

Can LEO Token reach $50?

LEO reaching $50 would exceed our current price prediction models' highest scenario of $43.63 (31T moon case). This would require extraordinary market conditions beyond the 31T total crypto market cap tier and exceptional Bitfinex platform growth. Not financial advice.

Is LEO Token a good investment based on price predictions?

LEO's price prediction is tied to Bitfinex exchange performance and utility value. The token offers fee discounts and platform benefits, with moderate growth potential in our base scenarios. However, exchange token valuations carry platform-specific risks. Always conduct your own research and consult financial advisors. Not financial advice.

How accurate are LEO Token price predictions?

Our LEO price predictions use scenario-based modeling across multiple market cap tiers, combining cycle analogues, market-cap share math, and technical analysis guardrails. While this methodology provides structured forecasts, cryptocurrency markets remain highly volatile and unpredictable. Use these price predictions as educational frameworks, not guarantees. Not financial advice.


Next Steps

Curious how these forecasts are made? Token Metrics delivers LEO on-chain grades, forecasts, and deep research on 6,000+ tokens. Instantly compare fundamentals, on-chain scores, and AI-powered predictions.

Disclosure

Educational purposes only, not financial advice. Crypto is volatile, do your own research and manage risk.

Why Use Token Metrics for LEO Price Predictions?

  • Data-driven forecasts: Scenario-based price prediction models across multiple market cap tiers
  • Comprehensive analysis: On-chain metrics, fundamental grades, and technical guardrails
  • AI-powered insights: Advanced algorithms analyze 6,000+ tokens for comparative analysis
  • Regular updates: Real-time price predictions and signals based on market conditions
  • Risk management: Multiple scenarios (bear, base, moon) for informed decision-making
Research

SUI Price Prediction 2027: Layer-1 Portfolio Diversification Analysis

Token Metrics Team
8 min read

Portfolio Context for Sui Price Prediction: Diversification in the 2027 Landscape

Layer 1 tokens like Sui represent bets on specific blockchain architectures winning developer and user mindshare. SUI carries both systematic crypto risk and unsystematic risk from Sui's technical roadmap execution and ecosystem growth. Multi-chain thesis suggests diversifying across several L1s rather than concentrating in one, since predicting which chains will dominate remains difficult.

The SUI price prediction projections below show how SUI might perform under different market cap scenarios. While Sui may have strong fundamentals, prudent portfolio construction balances L1 exposure across Ethereum, competing smart contract platforms, and Bitcoin to capture the sector without overexposure to any single chain's fate.


Disclosure

Educational purposes only, not financial advice. Crypto is volatile, do your own research and manage risk.

How to Read This SUI Price Prediction Framework

Each band blends cycle analogues and market-cap share math with TA guardrails. Base assumes steady adoption and neutral or positive macro. Moon layers in a liquidity boom. Bear assumes muted flows and tighter liquidity.

TM Agent baseline: Token Metrics lead metric for Sui, cashtag $SUI, is a TM Grade of 67.4%, which maps to a Hold, and the trading signal is bearish, indicating short-term downward momentum. This suggests Token Metrics sees $SUI as having reasonable fundamentals but not yet strong conviction for substantial outperformance in our price prediction models, while near-term momentum is negative and could limit rallies. Market context, brief: Bitcoin's price direction is currently the primary market driver, and a risk-off Bitcoin environment increases downside pressure on layer-1 tokens like $SUI.

Token Details 

The Case for Diversified Index Exposure

Professional investors across asset classes prefer diversified exposure over concentrated bets for good reason. Sui faces numerous risks—technical vulnerabilities, competitive pressure, regulatory targeting, team execution failure—any of which could derail SUI price prediction performance independent of broader market conditions. Token Metrics Indices spread this risk across one hundred tokens, ensuring no single failure destroys your crypto portfolio.

Diversification becomes especially critical in crypto given the sector's nascency and rapid evolution. Technologies and narratives that dominate today may be obsolete within years as the space matures. By holding SUI exclusively, you're betting not only on crypto succeeding but on Sui specifically remaining relevant. Index approaches hedge against picking the wrong horse while maintaining full crypto exposure.

Early access to Token Metrics Indices

Key Takeaways: SUI Price Prediction Summary

  • Scenario driven: Price prediction outcomes hinge on total crypto market cap; higher liquidity and adoption lift the bands
  • Single-asset concentration: Amplifies both upside and downside versus diversified approaches
  • Fundamentals: Fundamental Grade 77.60% (Community 80%, Tokenomics 60%, Exchange 100%, VC 76%, DeFi Scanner 75%)
  • Technology: Technology Grade 79.06% (Activity 77%, Repository 72%, Collaboration 89%, Security N/A, DeFi Scanner 75%)
  • TM Agent gist: Hold grade, bearish trading signal, near-term negative momentum in price prediction models
  • Education only, not financial advice

SUI Price Prediction Scenario Analysis

Token Metrics price prediction scenarios span four market cap tiers, each representing different levels of crypto market maturity and liquidity:

8T Market Cap - SUI Price Prediction:

At an 8 trillion total crypto market cap, SUI price prediction projects to $4.64 in bear conditions, $6.29 in the base case, and $7.94 in bullish scenarios.

16T Market Cap - SUI Price Prediction:

At a 16 trillion total crypto market cap, SUI price prediction projects to $8.93 in bear conditions, $13.88 in the base case, and $18.83 in bullish scenarios.

23T Market Cap - SUI Price Prediction:

At a 23 trillion total crypto market cap, SUI price prediction projects to $13.22 in bear conditions, $21.47 in the base case, and $29.72 in bullish scenarios.

31T Market Cap - SUI Price Prediction:

At a 31 trillion total crypto market cap, SUI price prediction projects to $17.50 in bear conditions, $29.05 in the base case, and $40.61 in bullish scenarios.

These price prediction ranges illustrate potential outcomes for concentrated SUI positions, but investors should weigh whether single-asset exposure matches their risk tolerance or whether diversified strategies better suit their objectives.

What Is Sui?

Sui is a layer-1 blockchain network designed for general-purpose smart contracts and scalable user experiences. It targets high throughput and fast settlement, aiming to support applications that need low-latency interactions and horizontal scaling.

SUI is the native token used for transaction fees and staking, aligning validator incentives and securing the network. It underpins activity across common crypto sectors such as NFTs and DeFi while the ecosystem builds developer tooling and integrations.

Token Metrics AI Analysis

Token Metrics AI provides comprehensive context informing our SUI price prediction models:

Vision: Sui aims to create a highly scalable and low-latency blockchain platform that enables seamless user experiences for decentralized applications. Its vision centers on making blockchain technology accessible and efficient for mainstream applications by removing traditional bottlenecks in transaction speed and cost.

Problem: Many existing blockchains face trade-offs between scalability, security, and decentralization, often resulting in high fees and slow transaction finality during peak usage. This limits their effectiveness for applications requiring instant settlement, frequent interactions, or large user bases, such as games or social platforms. Sui addresses the need for a network that can scale horizontally without sacrificing speed or cost-efficiency.

Solution: Sui uses a unique object-centric blockchain model and the Move programming language to enable parallel transaction processing, allowing high throughput and instant finality for many operations. Its consensus mechanism, Narwhal and Tusk, is optimized for speed and scalability by decoupling transaction dissemination from ordering. The network supports smart contracts, NFTs, and decentralized applications, with an emphasis on developer ease and user experience. Staking is available for network security, aligning with common proof-of-stake utility patterns.

Market Analysis: Sui competes in the layer-1 blockchain space with platforms like Solana, Avalanche, and Aptos, all targeting high-performance decentralized applications. It differentiates itself through its object-based data model and parallel execution, aiming for superior scalability in specific workloads. Adoption drivers include developer tooling, ecosystem incentives, and integration with wallets and decentralized exchanges. The broader market for high-throughput blockchains is driven by demand for scalable Web3 applications, though it faces risks from technical complexity, regulatory uncertainty, and intense competition—all critical factors in our price prediction analysis.

Fundamental and Technology Snapshot from Token Metrics

Fundamental Grade: 77.60% (Community 80%, Tokenomics 60%, Exchange 100%, VC 76%, DeFi Scanner 75%).


Technology Grade: 79.06% (Activity 77%, Repository 72%, Collaboration 89%, Security N/A, DeFi Scanner 75%).


Catalysts That Skew SUI Price Predictions Bullish

  • Institutional and retail access expands with ETFs, listings, and integrations
  • Macro tailwinds from lower real rates and improving liquidity
  • Product or roadmap milestones such as upgrades, scaling, or partnerships
  • Growing developer ecosystem and dApp adoption
  • Strategic partnerships with major Web3 platforms

Risks That Skew SUI Price Predictions Bearish

  • Macro risk-off from tightening or liquidity shocks
  • Regulatory actions or infrastructure outages
  • Concentration or validator economics and competitive displacement
  • Protocol-specific execution risk and competitive pressure from alternatives
  • Technical vulnerabilities or smart contract exploits

How Token Metrics Can Help

Token Metrics empowers you to analyze Sui and hundreds of digital assets with AI-driven ratings, on-chain and fundamental data, and index solutions to manage portfolio risk smartly in a rapidly evolving crypto market. Our price prediction frameworks provide scenario-based analysis to inform your investment decisions.

SUI Price Prediction FAQs

What price could SUI reach in the moon case?

Our moon case price predictions range from $7.94 at 8T to $40.61 at 31T total crypto market cap. These scenarios assume maximum liquidity expansion and strong Sui adoption. Diversified strategies aim to capture upside across multiple tokens rather than betting exclusively on any single moon scenario. Not financial advice.

What is the SUI price prediction for 2025-2027?

Our comprehensive SUI price prediction framework suggests SUI could trade between $4.64 and $40.61 depending on market conditions and total crypto market capitalization. The base case price prediction scenario clusters around $6.29 to $29.05 across different market cap environments. Current TM Grade of 67.4% indicates a Hold rating with bearish near-term momentum. Not financial advice.

Can SUI reach $20?

Yes. Based on our price prediction scenarios, SUI could reach $21.47 in the 23T base case and $18.83 in the 16T moon case. The price target of $20 becomes achievable in moderate to high market cap environments with steady ecosystem growth. Not financial advice.

Can SUI reach $50?

SUI reaching $50 would exceed our current price prediction models' highest scenario of $40.61 (31T moon case). This would require extraordinary market conditions beyond the 31T total crypto market cap tier, exceptional ecosystem adoption, and SUI capturing significant market share from competing L1s. Not financial advice.

What's the risk/reward profile for SUI?

Our SUI price prediction risk/reward spans from $4.64 to $40.61 across all scenarios. Downside risks include regulatory pressure and competitive displacement, while upside drivers include ecosystem growth and favorable liquidity. Concentrated positions amplify both tails, while diversified strategies smooth outcomes and reduce single-asset risk.

What are the biggest risks to SUI price predictions?

Key risks that could impact SUI price predictions include regulatory actions, technical issues, competitive pressure from other L1s (Solana, Avalanche, Aptos), adverse market liquidity, validator centralization concerns, and execution challenges. Concentrated SUI positions magnify exposure to these risks. Diversified strategies spread risk across tokens with different profiles, reducing portfolio vulnerability to any single failure point.

Is SUI a good investment based on price predictions?

SUI shows solid fundamentals (77.60% grade) and technology scores (79.06% grade), but currently has a Hold rating (67.4% TM Grade) with bearish near-term trading signals. While our price prediction models show potential upside in favorable market conditions, the bearish momentum and L1 competition suggest a cautious approach. Consider diversified exposure rather than concentrated positions. Not financial advice.

How does SUI compare to other L1 price predictions?

SUI competes with Solana, Avalanche, and Aptos in the high-performance L1 space. Our price prediction framework suggests SUI's performance will correlate with broader L1 adoption trends while facing differentiation challenges. Diversified L1 exposure through indices may offer better risk-adjusted returns than concentrated SUI positions, as predicting which specific L1 will dominate remains uncertain.


Next Steps

Disclosure
Educational purposes only, not financial advice. Crypto is volatile, concentration amplifies risk, and diversification is a fundamental principle of prudent portfolio construction. Do your own research and manage risk appropriately.

Why Use Token Metrics for SUI Price Predictions?

  • Scenario-based modeling: Multiple market cap tiers for comprehensive price prediction analysis
  • AI-driven analysis: Fundamental (77.60%) and technology (79.06%) grades for informed decisions
  • Risk management tools: Index solutions to diversify L1 exposure beyond single-asset concentration
  • Real-time signals: Trading signals and TM Grades updated regularly
  • Comparative analysis: Analyze SUI against 6,000+ tokens for portfolio optimization
Choose from Platinum, Gold, and Silver packages
Reach with 25–30% open rates and 0.5–1% CTR
Craft your own custom ad—from banners to tailored copy
Perfect for Crypto Exchanges, SaaS Tools, DeFi, and AI Products