Back to blog
Research

Best Liquid Restaking Tokens & Aggregators (2025)

Explore the 10 best liquid restaking tokens (LRTs) and aggregators by liquidity, security, fees, and DeFi integrations—plus region tips and key fee, risk, and beginner mistakes to avoid.
Token Metrics Team
17 min read
Want Smarter Crypto Picks—Free?
See unbiased Token Metrics Ratings for BTC, ETH, and top alts.
Thank you! Your submission has been received!
Oops! Something went wrong while submitting the form.
 No credit card | 1-click unsubscribe

Who this guide is for. Investors and builders comparing best liquid restaking tokens (LRTs) and aggregators to earn ETH staking + restaking rewards with on-chain liquidity.

Top three picks.

  • ether.fi (eETH/weETH): Non-custodial, deep integrations, clear docs. (ether.fi)
  • Renzo (ezETH): Multi-stack (EigenLayer + Symbiotic/Jito), transparent 10% rewards fee. (docs.renzoprotocol.com)
  • Kelp DAO (rsETH): Broad DeFi reach; explicit fee policy for direct ETH deposits. (kelp.gitbook.io)

One key caveat. Fees, redemption paths, and regional access vary by protocol—check official docs and terms before depositing.


Introduction

Liquid restaking lets you restake staked assets (most often ETH) to secure Actively Validated Services (AVSs) while receiving a liquid restaking token you can use across DeFi. The value prop in 2025: stack base staking yield + restaking rewards, with composability for lending, LPing, and hedging. In this commercial-investigational guide, we compare the best liquid restaking tokens and the top aggregators that route deposits across operators/AVSs, with an emphasis on verifiable fees, security posture, and redemption flow. We weigh scale and liquidity against risk controls and documentation quality to help you pick a fit for your region, risk tolerance, and toolstack.


How We Picked (Methodology & Scoring)

  • Liquidity — 30%: On-chain depth, integrations, and redemption mechanics.
  • Security — 25%: Audits, docs, risk disclosures, validator design.
  • Coverage — 15%: AVS breadth, multi-stack support (EigenLayer/Symbiotic/Jito), asset options.
  • Costs — 15%: Transparent fee schedules and user economics.
  • UX — 10%: Clarity of flows, dashboards, and docs.
  • Support — 5%: Status pages, help docs, comms.

Evidence sources: official websites, docs, pricing/fees and security pages, and status/terms pages; third-party datasets used only to cross-check volumes. Last updated November 2025.


Best Liquid Restaking Tokens & Aggregators in November 2025 (Comparison Table)  

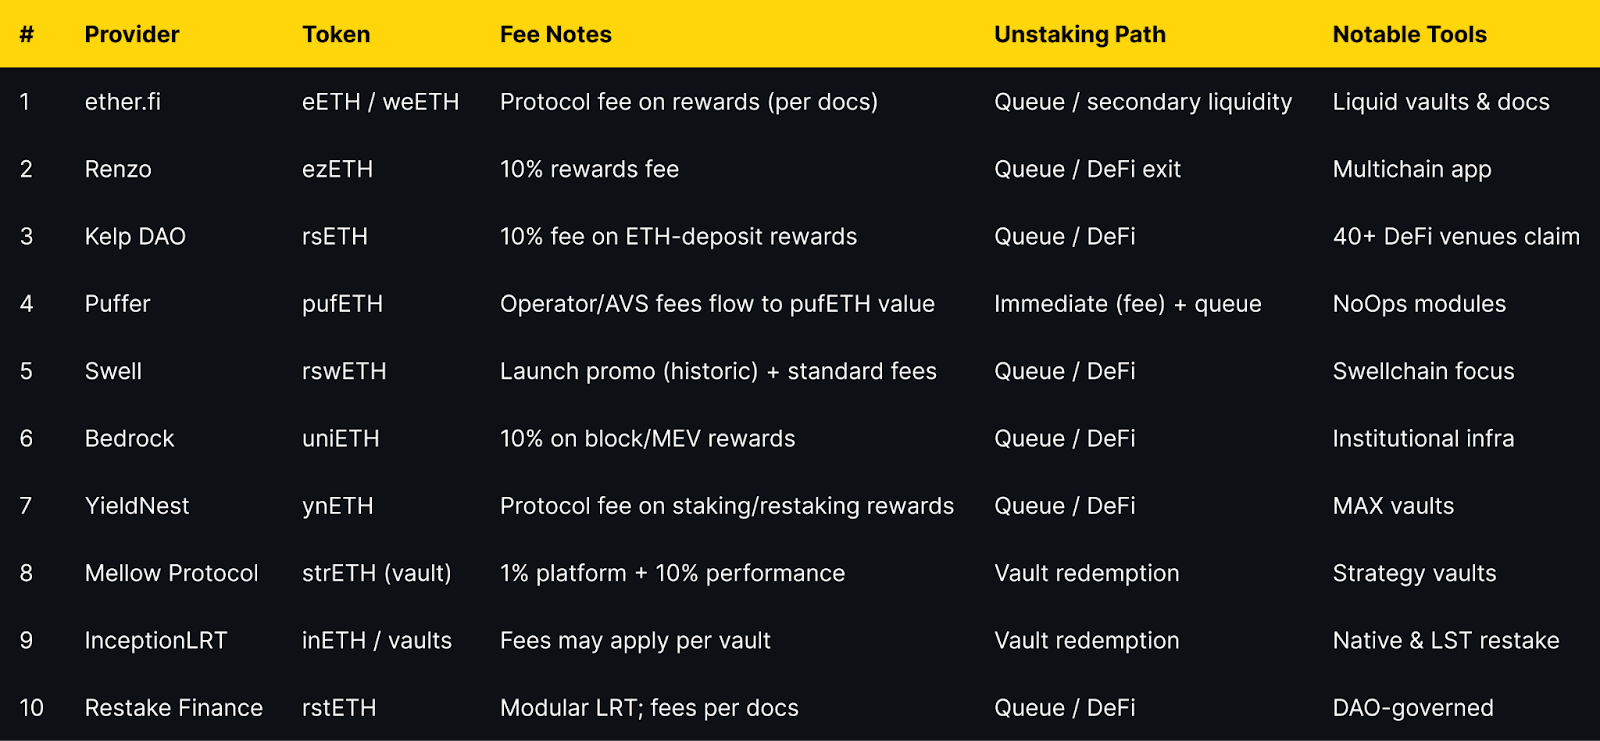
* Regions are “Global” unless a provider geoblocks specific jurisdictions in their terms. Always verify eligibility in your country.


Top 10 Liquid Restaking Tokens & Aggregators in November 2025

1. ether.fi — Best for deep integrations & non-custodial design

Why use it: ether.fi’s eETH/weETH are widely integrated across DeFi, and the project publishes clear technical docs on protocol fees and validator design. Liquid Vaults add strategy optionality while keeping restaking accessible. (ether.fi)
Best for: DeFi power users, liquidity seekers, builders needing broad integrations.
Notable features: Non-custodial staking; restaking support; Liquid Vaults; documentation and terms around protocol fees. (etherfi.gitbook.io)
Fees Notes: Protocol fee on rewards; vault-level fees vary by strategy. (etherfi.gitbook.io)
Regions: Global*
Consider if: You want deep liquidity and docs; always review fee tables and redemption queues.
Alternatives: Renzo, Kelp DAO.  


2. Renzo — Best for multi-stack coverage (EigenLayer + Symbiotic/Jito)

Why use it: Renzo’s ezETH is among the most recognizable LRTs and the docs clearly state a 10% rewards fee, while the app highlights support beyond EigenLayer (e.g., Symbiotic/Jito lines). Strong multichain UX. (docs.renzoprotocol.com)
Best for: Users wanting straightforward economics and chain-abstracted access.
Notable features: Clear fee policy (10% of restaking rewards); multi-stack support; app UX across chains. (docs.renzoprotocol.com)
Fees Notes: 10% of restaking rewards; details in docs. (docs.renzoprotocol.com)
Regions: Global*
Consider if: You prefer transparent fees and broader stack exposure.
Alternatives: ether.fi, Mellow.  


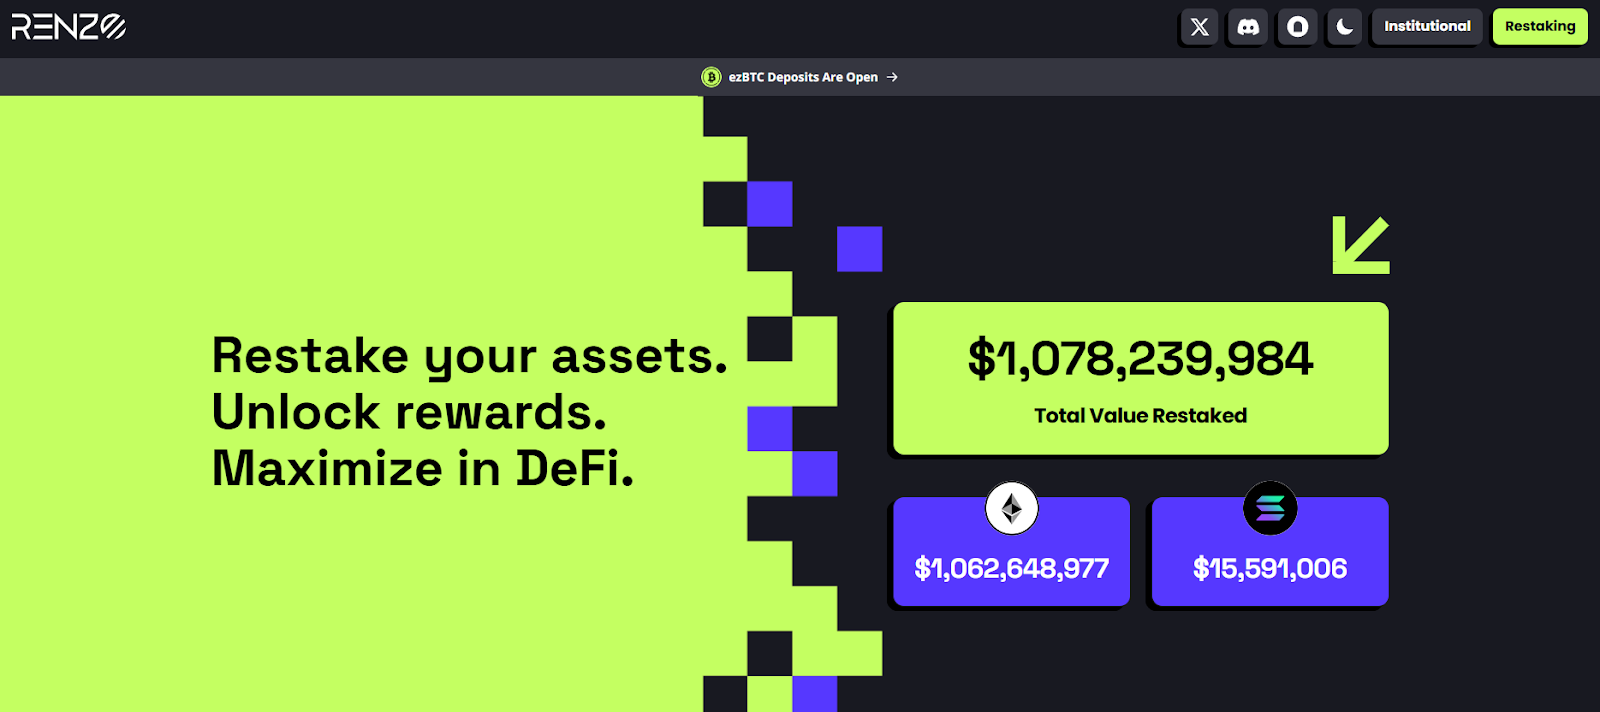
3. Kelp DAO — Best for broad DeFi distribution (rsETH)

Why use it: Kelp emphasizes reach (rsETH used across many venues). Official docs state a 10% fee on rewards for direct ETH deposits, with no fee on LST deposits, making it friendly to LST holders. (kelpdao.xyz)
Best for: LST holders, LPs, and integrators.
Notable features: rsETH liquid token; LST and ETH deposit routes; active integrations. (kelpdao.xyz)
Fees Notes: 10% on ETH-deposit rewards; no fee on LST deposits per docs. (kelp.gitbook.io)
Regions: Global*
Consider if: You want flexibility between ETH and LST deposit paths.
Alternatives: Renzo, Swell.  


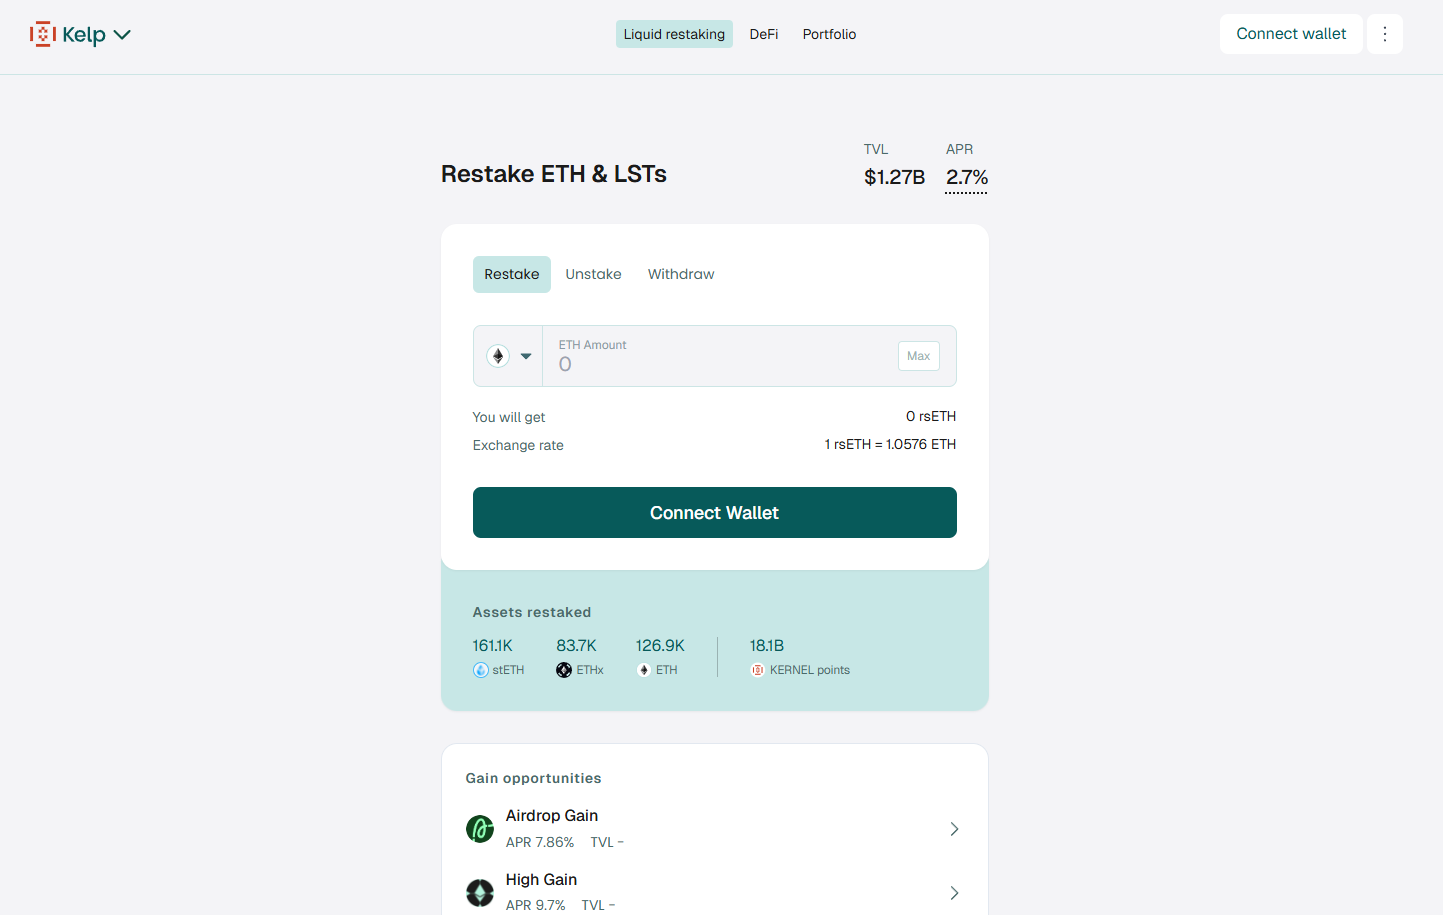
4. Puffer — Best for redemption optionality (pufETH)

Why use it: Puffer’s docs explain how AVS fees accrue to pufETH and outline operator/guardian roles. Public risk work notes an “immediate redemption” option with a fee when liquidity is available, plus queued exit. (docs.puffer.fi)
Best for: Users wanting explicit redemption choices and a technical spec.
Notable features: pufETH nLRT; operator/guardian model; based L2 plans. (Puffer: Building the Future of Ethereum)
Fees Notes: AVS/operator fees accrue; immediate redemption may incur a fee. (docs.puffer.fi)
Regions: Global*
Consider if: You value documented mechanics and redemption flexibility.
Alternatives: ether.fi, Bedrock.


5. Swell — Best for restaking-native ecosystem (rswETH)

Why use it: Swell’s rswETH is their native LRT for EigenLayer; launch comms detailed fee-holiday parameters and security posture. Swellchain materials emphasize restaking-first ecosystem tooling. (swellnetwork.io)
Best for: DeFi users who want a restaking-centric stack.
Notable features: rswETH; ecosystem focus; audits referenced in launch post. (swellnetwork.io)
Fees Notes: Historical launch promo; check current fee schedule in app/docs. (swellnetwork.io)
Regions: Global*
Consider if: You want an LRT aligned with a restaking-native L2 vision.
Alternatives: Kelp DAO, Renzo.


6. Bedrock — Best for institutional-grade infra (uniETH)

Why use it: Bedrock’s uniETH is a non-rebasing, value-accrual LRT with a published fee policy (10% on block/MEV rewards) and EigenLayer alignment. Docs are explicit about token mechanics. (docs.bedrock.technology)
Best for: Institutions and users who prefer clear token economics.
Notable features: uniETH; docs and audits repository; multi-asset roadmap. (docs.bedrock.technology)
Fees Notes: 10% commission on block/MEV rewards; restaking commission TBD via governance. (docs.bedrock.technology)
Regions: Global*
Consider if: You want explicit fee language and non-rebasing accounting.
Alternatives: Puffer, ether.fi.


7. YieldNest — Best for curated basket exposure (ynETH)

Why use it: Docs describe ynETH as an nLRT with a curated basket of AVS categories, plus a protocol model where a fee is taken from staking/restaking rewards. MAX vaults and DAO governance are outlined. (docs.yieldnest.finance)
Best for: Users who want diversified AVS exposure through one token.
Notable features: ynETH; MAX vaults (ynETHx); governance/fee transparency. (docs.yieldnest.finance)
Fees Notes: Protocol fee on staking/restaking rewards per docs. (docs.yieldnest.finance)
Regions: Global*
Consider if: You prefer basket-style AVS diversification.
Alternatives: Mellow, Renzo.


8. Mellow Protocol — Best for strategy vaults with explicit fees (strETH)

Why use it: Mellow provides strategy vaults for restaking with clear fee terms: 1% platform + 10% performance baked into vault accounting, and visible TVL. (mellow.finance)
Best for: Users who want managed strategies with transparent fee splits.
Notable features: Curated strategy vaults; institutional risk curators; TVL transparency. (mellow.finance)
Fees Notes: 1% platform fee (pro-rated) + 10% performance fee. (docs.mellow.finance)
Regions: Global*
Consider if: You value explicit, vault-level fee logic.
Alternatives: YieldNest, InceptionLRT.


9. InceptionLRT — Best for native + LST restaking routes

Why use it: Inception exposes native ETH and LST restaking paths, with branded vault tokens (e.g., inETH) and Symbiotic integrations for certain routes. Site and app pages outline flows. (inceptionlrt.com)
Best for: Users wanting both native and LST restake options from one dashboard.
Notable features: Native ETH restake; LST restake; app-based delegation flows. (inceptionlrt.com)
Fees Notes: Fees vary by vault/route; review app/docs before deposit. (inceptionlrt.com)
Regions: Global*
Consider if: You want flexible inputs (ETH or LST) with aggregator UX.
Alternatives: Mellow, YieldNest.


10. Restake Finance — Best for modular LRT approach (rstETH)

Why use it: Project messaging emphasizes a modular liquid restaking design focused on EigenLayer with rstETH as its token. Governance-driven roadmap and LRT utility are core themes. (MEXC)
Best for: Early adopters exploring modular LRT architectures.
Notable features: rstETH LRT; DAO governance; EigenLayer focus. (MEXC)
Fees Notes: Fees/policies per official materials; review before use. (MEXC)
Regions: Global*
Consider if: You want a DAO-led modular LRT approach.
Alternatives: Renzo, Bedrock.


Decision Guide: Best By Use Case


How to Choose the Right Liquid Restaking Token (Checklist)

  • Region eligibility: Confirm geoblocks/terms for your country.
  • Asset coverage: ETH only or multi-asset; LST deposits supported.
  • Fee transparency: Rewards/performance/platform fees clearly stated.
  • Redemption path: Immediate exit fee vs. queue, and typical timing.
  • Security posture: Audits, docs, risk disclosures, operator set.
  • Integrations: Lending/DEX/LP venues for liquidity management.
  • Stack choice: EigenLayer only or Symbiotic/Jito as well.
  • UX/docs: Clear FAQs, step-by-step flows, status/terms.
  • Support: Help center or community channels with updates.
    Red flags: Opaque fee language; no docs on withdrawals; no audits or terms.

Use Token Metrics With Any LRT

  • AI Ratings to screen assets and venues by quality and momentum.


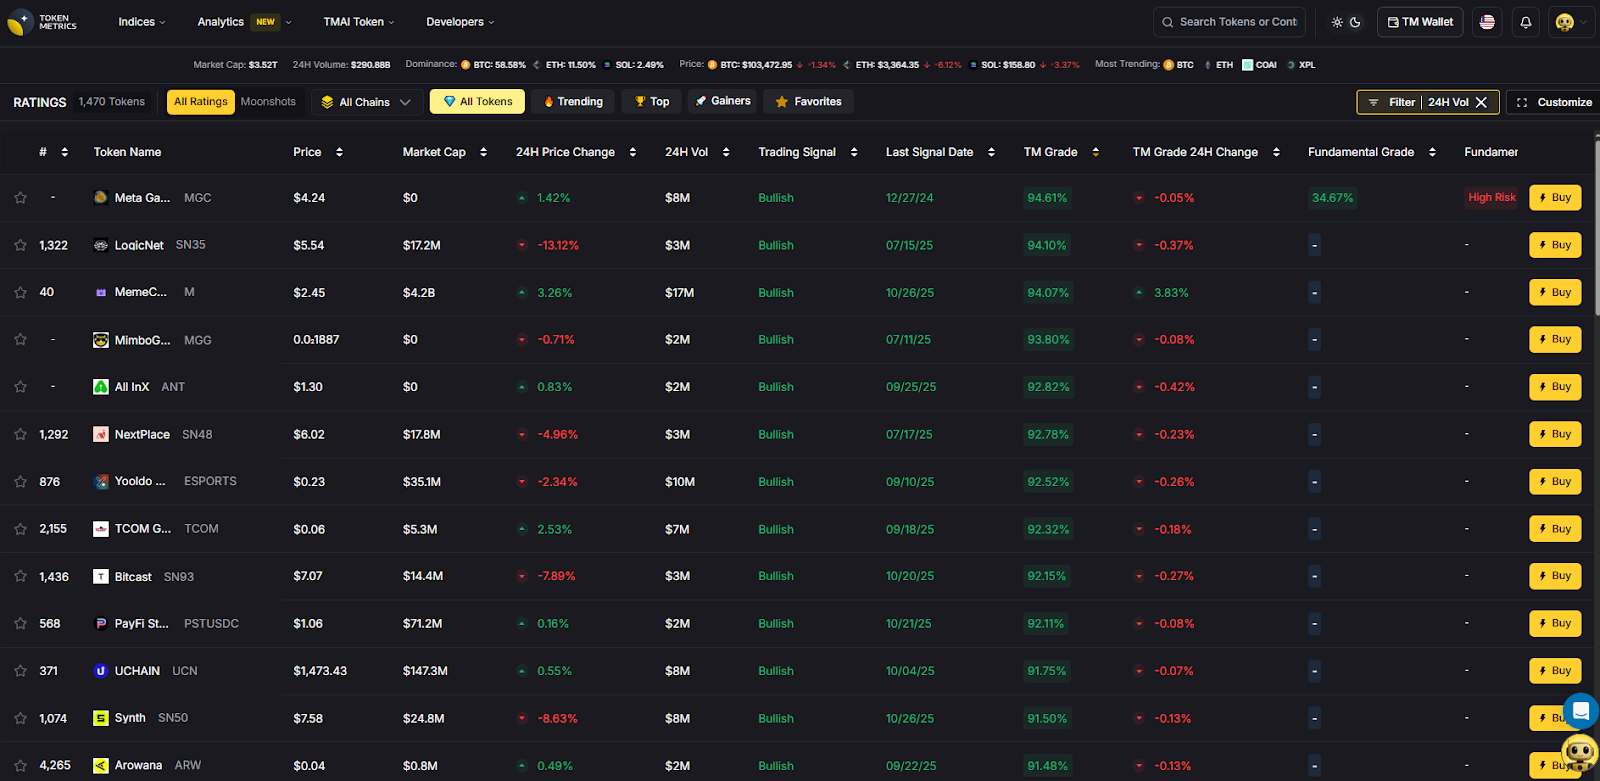
  • Narrative Detection to catch early shifts in restaking themes.


  • Portfolio Optimization to balance exposure across LRTs vs. LSTs.
  • Alerts & Signals to time rebalances and exits.
    Workflow: Research → Select provider → Execute on-chain → Monitor with alerts.
    Prefer diversified exposure? Explore Token Metrics Indices.

Security & Compliance Tips

  • Use verified URLs and signed fronts; bookmark dApps.
  • Understand redemption mechanics (instant vs. queue) and fees. (LlamaRisk)
  • Read fee pages before deposit; some charge on rewards, others on performance/platform. (docs.renzoprotocol.com)
  • Review audits/risk docs where available; check operator design.
  • If LPing LRT/ETH, monitor depeg risk and oracle choice.
  • Avoid approvals you don’t need; regularly revoke stale allowances.
  • Confirm region eligibility and tax implications.
    This article is for research/education, not financial advice.

Beginner Mistakes to Avoid

  • Treating LRTs like 1:1 ETH with zero risk.
  • Ignoring withdrawal queues and exit windows.
  • Chasing points/boosts without reading fee docs.
  • LPing volatile LRT pairs without hedge.
  • Overconcentrating in one operator/AVS route.
  • Skipping protocol terms or assuming U.S. access by default.

How We Picked (Methodology & Scoring)

We scored each provider using the weights above, focusing on official fee pages, docs, and security materials. We shortlisted ~20 projects and selected 10 with the strongest mix of liquidity, disclosures, and fit for this category. Freshness verified November 2025 via official resources.


FAQs

What is a liquid restaking token (LRT)?
 An LRT is a liquid receipt for restaked assets (usually ETH) that accrues base staking plus AVS restaking rewards and can be used across DeFi.

Are LRTs safe?
 They carry smart-contract, operator, and AVS risks in addition to staking risks. Read audits, fee pages, and redemption docs before depositing.

What fees should I expect?
 Common models include a percent of rewards (e.g., 10% at Renzo) or platform + performance fees (e.g., 1% + 10% at Mellow). Always check the latest official docs. (docs.renzoprotocol.com)

What’s the difference between EigenLayer vs. Symbiotic/Jito routes?
 They’re different restaking stacks and AVS ecosystems. Some providers support multiple stacks to diversify coverage. (docs.renzoprotocol.com)

How do redemptions work?
 Most use queued exits; some offer instant liquidity with a fee when available (e.g., Puffer). Review the protocol’s redemption section. (LlamaRisk)

Can U.S. users access these protocols?
 Terms vary by protocol and may change. Always check the provider’s website and terms for your jurisdiction.


Conclusion + Related Reads

If you want liquidity + integrations, start with ether.fi or Renzo. Prefer explicit fee logic in a managed strategy? Look at Mellow. Want basket exposure? Consider YieldNest. For redemption flexibility, Puffer stands out. Match the fee model, stack coverage, and redemption flow to your risk and liquidity needs.

Related Reads:

Build Smarter Crypto Apps &
AI Agents in Minutes, Not Months
Real-time prices, trading signals, and on-chain insights all from one powerful API.
Grab a Free API Key
About Token Metrics
Token Metrics: AI-powered crypto research and ratings platform. We help investors make smarter decisions with unbiased Token Metrics Ratings, on-chain analytics, and editor-curated “Top 10” guides. Our platform distills thousands of data points into clear scores, trends, and alerts you can act on.
30 Employees
analysts, data scientists, and crypto engineers
Daily Briefings
concise market insights and “Top Picks”
Transparent & Compliant
Sponsored ≠ Ratings; research remains independent
Want Smarter Crypto Picks—Free?
See unbiased Token Metrics Ratings for BTC, ETH, and top alts.
Thank you! Your submission has been received!
Oops! Something went wrong while submitting the form.
 No credit card | 1-click unsubscribe
Token Metrics Team
Token Metrics Team

Recent Posts

Research

Shiba Inu Price Prediction 2027: SHIB Forecast & Risk Warning

Token Metrics Team
6 min read

Shiba Inu Price Prediction: Understanding SHIB's Speculative Nature

Shiba Inu operates as a community-driven meme token where price action stems primarily from social sentiment, attention cycles, and speculative trading rather than fundamental value drivers. SHIB exhibits extreme volatility with no defensive characteristics or revenue-generating mechanisms typical of utility tokens. Token Metrics price prediction scenarios below provide technical price forecasts across different market cap environments, though meme tokens correlate more strongly with viral trends and community engagement than systematic market cap models. Positions in SHIB should be sized as high-risk speculative bets with potential for total loss.


Disclosure

Educational purposes only, not financial advice. Crypto is volatile, do your own research and manage risk.

How to read this price prediction:

Each band blends cycle analogues and market-cap share math with TA guardrails. Base assumes steady adoption and neutral or positive macro. Moon layers in a liquidity boom. Bear assumes muted flows and tighter liquidity. For meme tokens, actual price prediction outcomes depend heavily on social trends and community momentum beyond what market cap models capture.

TM Agent baseline:

Token Metrics TM Grade is 24.1%, Sell, with a bearish trading signal. The concise 12‑month numeric price prediction view centers between $0.000005 and $0.000035, with a base case price target near $0.000012.

TM Agent numeric view: scenarios center roughly between $0.000005 and $0.000035, with a base case near $0.000012.

Live details: Token Details 

Key Takeaways for SHIB Price Prediction

  • Highly speculative asset driven by sentiment and attention rather than fundamentals
  • Scenario driven: price prediction outcomes hinge on total crypto market cap and viral momentum
  • Extreme volatility characteristic - SHIB can experience double-digit percentage moves daily
  • TM Agent gist: Bearish short term, price prediction range $0.000005–$0.000035
  • Entertainment risk only, not financial advice

Shiba Inu Price Prediction: Scenario Analysis

Token Metrics price prediction scenarios provide technical price bands across market cap tiers:

8T Market Cap Price Prediction:

At 8 trillion total crypto market cap, SHIB price prediction projects to $0.041998 (bear), $0.042366 (base), and $0.042734 (moon).

16T Market Cap Price Prediction:

At 16 trillion total crypto market cap, SHIB price forecast projects to $0.043973 (bear), $0.045077 (base), and $0.046182 (moon).

23T Market Cap Price Prediction:

At 23 trillion total crypto market cap, SHIB price prediction projects to $0.045948 (bear), $0.047789 (base), and $0.049629 (moon).

  31T Market Cap Price Prediction:

At 31 trillion total crypto market cap, SHIB price prediction projects to $0.047923 (bear), $0.051050 (base), and $0.051307 (moon).

 These technical price prediction ranges assume meme tokens maintain market cap share proportional to overall crypto growth. Actual outcomes for speculative tokens typically exhibit higher variance and stronger correlation to social trends than these price prediction models predict.

What Is Shiba Inu?

Shiba Inu is a meme-born crypto project that centers on community and speculative culture. Unlike utility tokens with specific use cases, SHIB operates primarily as a speculative asset and community symbol. The project focuses on community engagement and entertainment value.

SHIB has demonstrated viral moments and community loyalty within the broader meme token category. The token trades on community sentiment and attention cycles more than fundamentals. Market performance depends heavily on social media attention and broader meme coin cycles.

Risks That Skew Bearish for Price Prediction

  • Extreme volatility from pure sentiment-driven price action with no fundamental support
  • Attention cycles shift rapidly, leaving early viral tokens abandoned as new memes emerge
  • Liquidity can evaporate quickly during downturns, creating severe slippage and exit difficulty
  • Regulatory scrutiny may target meme tokens as securities or gambling instruments
  • Macro risk-off environments hit speculative assets hardest, with meme coins showing largest drawdowns
  • Community fragmentation or developer abandonment can eliminate remaining narrative support
  • These factors could push SHIB price predictions toward the lower bear scenarios

Make Your Next Move with Token Metrics

Token Metrics provides technical analysis, scenario math, price prediction models, and rigorous risk evaluation for hundreds of crypto tokens. Want to dig deeper? Explore our powerful AI-powered ratings and scenario tools here.

FAQs: Shiba Inu Price Prediction

Will SHIB 10x from here according to price predictions?

At current price of $0.041027, a 10x reaches $0.41027. This level does not appear in any of the listed bear, base, or moon price prediction scenarios across 8T, 16T, 23T, or 31T tiers. Meme tokens can 10x rapidly during viral moments but can also lose 90%+ just as quickly. Position sizing for potential total loss is critical. Not financial advice.

What are the biggest risks to SHIB price predictions?

Primary risks include attention shifting to newer memes, community fragmentation, developer abandonment, regulatory crackdowns, and liquidity collapse during downturns. Unlike utility tokens with defensive characteristics, SHIB has zero fundamental floor. Price can approach zero if community interest disappears. Total loss is a realistic outcome that price prediction models cannot fully account for. Not financial advice.

What is the 2027 Shiba Inu price prediction?

Based on Token Metrics analysis, the 2027 price prediction for SHIB centers around $0.000012 in the base case under current market conditions. However, meme token price predictions are highly unreliable due to extreme dependence on social trends, viral cycles, and community sentiment that can change rapidly. These technical price prediction ranges should be viewed with extreme caution.

Can SHIB reach $0.01 according to price predictions?

Based on the price prediction scenarios across all market cap tiers (8T-31T), SHIB projections range from $0.041998 to $0.051307. While these technical price predictions show SHIB trading above $0.04, the extreme volatility and sentiment-driven nature of meme tokens means actual outcomes can vary dramatically from model projections. Not financial advice.


Next Steps

Track live data: Token Details

• Consider fundamental crypto assets with utility and defensive characteristics rather than pure speculation.

Disclosure

Educational purposes only, not financial advice. SHIB is a highly speculative asset with extreme volatility and high risk of total loss. Meme tokens operate as entertainment and gambling instruments rather than investments. Only allocate capital you can afford to lose entirely. Do your own research and manage risk appropriately.

Research

WhiteBIT Coin Price Prediction 2028: $40-$272 Target Analysis

Token Metrics Team
7 min read

WhiteBIT Coin Price Prediction: Portfolio Context for WBT in the 2028 Landscape

Exchange tokens like WhiteBIT Coin offer leveraged exposure to overall market activity, creating concentration risk around a single platform's success. While WBT can deliver outsized returns during bull markets with high trading volumes, platform-specific risks like regulatory action, security breaches, or competitive displacement amplify downside exposure. Portfolio theory suggests balancing such concentrated bets with broader sector exposure.

The price prediction scenarios below show how WBT might perform across different crypto market cap environments. Rather than betting entirely on WhiteBIT Coin's exchange succeeding, diversified strategies blend exchange tokens with L1s, DeFi protocols, and infrastructure plays to capture crypto market growth while mitigating single-platform risk.

The Case for Diversified Index Exposure

Portfolio theory teaches that diversification is the only free lunch in investing. WBT concentration violates this principle by tying your crypto returns to one protocol's fate. Token Metrics Indices blend WhiteBIT Coin with the top one hundred tokens, providing broad exposure to crypto's growth while smoothing volatility through cross-asset diversification. This approach captures market-wide tailwinds without overweighting any single point of failure.

Systematic rebalancing within index strategies creates an additional return source that concentrated positions lack. As some tokens outperform and others lag, regular rebalancing mechanically sells winners and buys laggards, exploiting mean reversion and volatility. Single-token holders miss this rebalancing alpha and often watch concentrated gains evaporate during corrections while index strategies preserve more gains through automated profit-taking.

Beyond returns, diversified indices improve the investor experience by reducing emotional decision-making. Concentrated WBT positions subject you to severe drawdowns that trigger panic selling at bottoms. Indices smooth the ride through natural diversification, making it easier to maintain exposure through full market cycles.

Get Early Acces


Disclosure

Educational purposes only, not financial advice. Crypto is volatile, do your own research and manage risk.

How to read this price prediction:

Each band blends cycle analogues and market-cap share math with TA guardrails. Base assumes steady adoption and neutral or positive macro. Moon layers in a liquidity boom. Bear assumes muted flows and tighter liquidity.

TM Agent baseline:

Token Metrics long term price prediction view for WhiteBIT Coin, cashtag $WBT. Lead metric first, Token Metrics TM Grade is 52.5%, Hold, and the trading signal is bearish, indicating short-term downward momentum. Concise 12-month numeric price prediction view: Token Metrics scenarios center roughly between $10 and $85, with a base case price target near $40.

Live details: Token Details

Key Takeaways for WBT Price Prediction

  • Scenario driven: price prediction outcomes hinge on total crypto market cap; higher liquidity and adoption lift the price bands
  • Single-asset concentration amplifies both upside and downside versus diversified approaches
  • Fundamentals: Fundamental Grade 52.35% (Community 82%, Tokenomics 60%, Exchange 50%, VC —, DeFi Scanner N/A)
  • TM Agent gist: Bearish momentum, 12-month price prediction range $10 to $85
  • Education only, not financial advice

WhiteBIT Coin Price Prediction: Scenario Analysis

Token Metrics price prediction scenarios span four market cap tiers, each representing different levels of crypto market maturity and liquidity:

8T Market Cap Price Prediction:

At an 8 trillion dollar total crypto market cap, WBT price prediction projects to $54.50 in bear conditions, $64.88 in the base case, and $75.26 in bullish scenarios.

16T Market Cap Price Prediction:

Doubling the market to 16 trillion expands the price prediction range to $78.61 (bear), $109.75 (base), and $140.89 (moon).

23T Market Cap Price Prediction:

At 23 trillion, the price forecast scenarios show $102.71, $154.61, and $206.51 respectively.

31T Market Cap Price Prediction:

In the maximum liquidity scenario of 31 trillion, WBT price prediction could reach $126.81 (bear), $199.47 (base), or $272.13 (moon).


These price prediction ranges illustrate potential outcomes for concentrated WBT positions, but investors should weigh whether single-asset exposure matches their risk tolerance or whether diversified strategies better suit their objectives.

What Is WhiteBIT Coin?

WhiteBIT Coin is the native exchange token associated with the WhiteBIT ecosystem. It is designed to support utility on the platform and related services.

WBT typically provides fee discounts and ecosystem benefits where supported. Usage depends on exchange activity and partner integrations.

Token Metrics AI Analysis for Price Prediction

Token Metrics AI provides comprehensive context on WhiteBIT Coin's positioning and challenges that inform our price prediction models.

Vision: The stated vision for WhiteBIT Coin centers on enhancing user experience within the WhiteBIT exchange ecosystem by providing tangible benefits such as reduced trading fees, access to exclusive features, and participation in platform governance or rewards programs. It aims to strengthen user loyalty and engagement by aligning token holders' interests with the exchange's long-term success. While not positioned as a decentralized protocol token, its vision reflects a broader trend of exchanges leveraging tokens to build sustainable, incentivized communities.

Problem: Centralized exchanges often face challenges in retaining active users and differentiating themselves in a competitive market. Users may be deterred by high trading fees, limited reward mechanisms, or lack of influence over platform developments. WhiteBIT Coin aims to address these frictions by introducing a native incentive layer that rewards participation, encourages platform loyalty, and offers cost-saving benefits. This model seeks to improve user engagement and create a more dynamic trading environment on the WhiteBIT platform.

Solution: WhiteBIT Coin serves as a utility token within the WhiteBIT exchange, offering users reduced trading fees, staking opportunities, and access to special events such as token sales or airdrops. It functions as an economic lever to incentivize platform activity and user retention. While specific governance features are not widely documented, such tokens often enable voting on platform upgrades or listing decisions. The solution relies on integrating the token deeply into the exchange's operational model to ensure consistent demand and utility for holders.

Market Analysis: Exchange tokens like WhiteBIT Coin operate in a competitive landscape led by established players such as Binance Coin (BNB) and KuCoin Token (KCS). While BNB benefits from a vast ecosystem including a launchpad, decentralized exchange, and payment network, WBT focuses on utility within its native exchange. Adoption drivers include the exchange's trading volume, security track record, and the attractiveness of fee discounts and staking yields. Key risks involve regulatory pressure on centralized exchanges and competition from other exchange tokens that offer similar benefits.

Fundamental Snapshot from Token Metrics

Fundamental Grade: 52.35% (Community 82%, Tokenomics 60%, Exchange 50%, VC —, DeFi Scanner N/A).


Catalysts That Skew Bullish for Price Prediction

  • Institutional and retail access expands with ETFs, listings, and integrations
  • Macro tailwinds from lower real rates and improving liquidity
  • Product or roadmap milestones such as upgrades, scaling, or partnerships
  • These factors could push WBT toward higher price prediction targets

Risks That Skew Bearish for Price Prediction

  • Macro risk-off from tightening or liquidity shocks
  • Regulatory actions or infrastructure outages
  • Concentration in validator economics and competitive displacement
  • Protocol-specific execution risk and competitive pressure from alternatives
  • These factors could push WBT toward lower price prediction scenarios

FAQs: WhiteBIT Coin Price Prediction

Can WBT reach $100 according to price predictions?

Based on the price prediction scenarios, WBT could reach $100 in the 16T base case. The 16T tier projects $109.75 in the base case price forecast. Achieving this price prediction requires both broad market cap expansion and WhiteBIT Coin maintaining competitive position. Not financial advice.

What's the risk/reward profile for WBT price prediction?

Risk and reward in our price prediction model span from $54.50 in the lowest bear case to $272.13 in the highest moon case. Downside risks include regulatory actions and competitive displacement, while upside drivers include expanding access and favorable macro liquidity. Concentrated positions amplify both tails, while diversified strategies smooth outcomes.

What gives WBT value and impacts price predictions?

WBT accrues value through fee discounts, staking rewards, access to special events, and potential participation in platform programs. Demand drivers include exchange activity, user growth, and security reputation. While these fundamentals matter for price predictions, diversified portfolios capture value accrual across multiple tokens rather than betting on one protocol's success.

What is the 2028 WhiteBIT Coin price prediction?

Based on Token Metrics analysis, the 2028 price prediction for WhiteBIT Coin centers around $40 in the base case under current market conditions, with a range between $10 and $85 depending on market scenarios. Bullish price predictions range from $64.88 to $272.13 across different total crypto market cap environments.

Can WBT reach $200 by 2028?

According to our price prediction models, WBT could reach $200 in the 23T moon case ($206.51) and in the 31T scenarios where the base case is $199.47 and the moon case is $272.13. These price prediction outcomes require significant crypto market expansion and WhiteBIT maintaining strong competitive positioning. Not financial advice.


Next Steps

Disclosure

Educational purposes only, not financial advice. Crypto is volatile, concentration amplifies risk, and diversification is a fundamental principle of prudent portfolio construction. Do your own research and manage risk appropriately.

Research

Predicting Litecoin Price in 2027: Scenario Analysis & On-Chain Scores

Token Metrics Team
6 min read

Litecoin Price Prediction Framework: Market Cap Scenarios & 2027 Forecast

Layer 1 tokens capture value through transaction fees and miner economics. Litecoin processes blocks every 2.5 minutes using Proof of Work, targeting fast, low-cost payments. The price prediction scenarios below model LTC outcomes across different total crypto market sizes, reflecting network adoption and transaction volume.


Disclosure

Educational purposes only, not financial advice. Crypto is volatile, do your own research and manage risk.

How to read this price prediction:

Each band blends cycle analogues and market-cap share math with TA guardrails. Base assumes steady adoption and neutral or positive macro. Moon layers in a liquidity boom. Bear assumes muted flows and tighter liquidity.

TM Agent baseline:

Token Metrics price prediction scenarios center roughly between $35 and $160, with a base case price target near $75, assuming gradual adoption, occasional retail rotation into major alts, and no major network issues. In a broad crypto rally LTC could test the upper bound price prediction, while in risk-off conditions it would likely drift toward the lower bound.

Live details: Token Details

Key Takeaways for LTC Price Prediction

  • Scenario driven: price prediction outcomes hinge on total crypto market cap; higher liquidity and adoption lift the price bands
  • Fundamentals: Fundamental Grade 83.98% (Community 79%, Tokenomics 100%, Exchange 100%, VC —, DeFi Scanner 57%)
  • Technology: Technology Grade 46.67% (Activity 51%, Repository 72%, Collaboration 60%, Security 20%, DeFi Scanner 57%)
  • TM Agent gist: the TM Grade is 21.8 (Sell), and the trading signal is bearish, indicating short-term downward momentum
  • Education only, not financial advice

Litecoin Price Prediction: Scenario Analysis

Token Metrics price prediction scenarios span four market cap tiers reflecting different crypto market maturity levels:

8T Market Cap Price Prediction:

At an 8 trillion dollar total crypto market cap, LTC price prediction projects to $115.80 in bear conditions, $137.79 in the base case, and $159.79 in bullish scenarios.

16T Market Cap Price Prediction:

At 16 trillion, the price prediction range expands to $154.54 (bear), $220.52 (base), and $286.50 (moon).

23T Market Cap Price Prediction:

The 23 trillion tier price forecast shows $193.28, $303.25, and $413.21 respectively.

31T Market Cap Price Prediction:

In the maximum liquidity scenario at 31 trillion, LTC price prediction reaches $232.03 (bear), $385.98 (base), or $539.92 (moon).


What Is Litecoin?

Litecoin is a peer-to-peer cryptocurrency launched in 2011 as an early Bitcoin fork. It uses Proof of Work with Scrypt and targets faster settlement, processing blocks roughly every 2.5 minutes with low fees.

LTC is the native token used for transaction fees and miner rewards. Its primary utilities are fast, low-cost payments and serving as a testing ground for Bitcoin-adjacent upgrades, with adoption in retail payments, remittances, and exchange trading pairs.

Token Metrics AI Analysis for Price Prediction

Token Metrics AI provides additional context on Litecoin's technical positioning and market dynamics that inform our price prediction models.

Vision: Litecoin's vision is to serve as a fast, low-cost, and accessible digital currency for everyday transactions. It aims to complement Bitcoin by offering quicker settlement times and a more efficient payment system for smaller, frequent transfers.

Problem: Bitcoin's relatively slow block times and rising transaction fees during peak usage make it less ideal for small, frequent payments. This creates a need for a cryptocurrency that maintains security and decentralization while enabling faster and cheaper transactions suitable for daily use.

Solution: Litecoin addresses this by using a 2.5-minute block time and the Scrypt algorithm, which initially allowed broader participation in mining and faster transaction processing. It functions primarily as a payment-focused blockchain, supporting peer-to-peer transfers with low fees and high reliability, without the complexity of smart contract functionality.

Market Analysis: Litecoin operates in the digital payments segment of the cryptocurrency market, often compared to Bitcoin but positioned as a more efficient medium of exchange. While it lacks the smart contract capabilities of platforms like Ethereum or Solana, its simplicity, long-standing network security, and brand recognition give it a stable niche. It competes indirectly with other payment-focused cryptocurrencies like Bitcoin Cash and Dogecoin. Adoption is sustained by its integration across major exchanges and payment services, but growth is limited by the broader shift toward ecosystems offering decentralized applications.

Fundamental and Technology Snapshot from Token Metrics

Fundamental Grade: 83.98% (Community 79%, Tokenomics 100%, Exchange 100%, VC —, DeFi Scanner 57%).


Technology Grade: 46.67% (Activity 51%, Repository 72%, Collaboration 60%, Security 20%, DeFi Scanner 57%).


Catalysts That Skew Bullish for Price Prediction

  • Institutional and retail access expands with ETFs, listings, and integrations
  • Macro tailwinds from lower real rates and improving liquidity
  • Product or roadmap milestones such as upgrades, scaling, or partnerships
  • These factors could push LTC toward higher price prediction targets

Risks That Skew Bearish for Price Prediction

  • Macro risk-off from tightening or liquidity shocks
  • Regulatory actions or infrastructure outages
  • Concentration in validator economics and competitive displacement
  • These factors could push LTC toward lower price prediction scenarios

Where to get deeper research and insights?

For comprehensive Litecoin ratings, on-chain analysis, AI-powered price forecasts, and trading signals, go to Token Metrics.

FAQs: Litecoin Price Prediction

What is LTC used for?

Primary use cases include fast peer-to-peer payments, low-cost remittances, and exchange settlement/liquidity pairs. LTC holders primarily pay transaction fees and support miner incentives. Adoption depends on active addresses and payment integrations, which directly impact long-term price prediction models.

What price could LTC reach in the moon case price prediction?

Moon case price predictions range from $159.79 at 8T to $539.92 at 31T total crypto market cap. These price prediction scenarios require maximum market cap expansion and strong adoption dynamics. Not financial advice.

What is the 2027 Litecoin price prediction?

Based on Token Metrics analysis, the 2027 price prediction for Litecoin centers around $75 in the base case under current market conditions, with a range between $35 and $160 depending on market scenarios. Bullish price predictions range from $137.79 to $539.92 across different total crypto market cap environments.

Can LTC reach $500 according to price predictions?

According to our price prediction models, LTC could reach $500+ in the 31T moon case where it projects to $539.92. This price prediction outcome requires significant crypto market expansion (31 trillion total market cap) combined with strong Litecoin network adoption. Not financial advice.

How does Litecoin's price prediction compare to Bitcoin?

While Litecoin was designed as "silver to Bitcoin's gold," its price prediction typically reflects a fraction of Bitcoin's value due to lower market cap and adoption. However, LTC often benefits from Bitcoin rallies while offering faster transaction times, which can impact relative price performance during payment-focused adoption cycles.


Next Steps

Track live grades and signals: Token Details 

Buy LTC on MEXC

Disclosure

Educational purposes only, not financial advice. Crypto is volatile, do your own research and manage risk.

Choose from Platinum, Gold, and Silver packages
Reach with 25–30% open rates and 0.5–1% CTR
Craft your own custom ad—from banners to tailored copy
Perfect for Crypto Exchanges, SaaS Tools, DeFi, and AI Products