Back to blog
Research

Best Crypto Liquidity Management & Market-Making Tools (2025)

Discover the ten best crypto liquidity management & market-making tools for 2025, including decision checklists, security tips, top providers, and how to combine CeFi/DeFi solutions with Token Metrics’ AI-powered insights.
Token Metrics Team
13 min read
Want Smarter Crypto Picks—Free?
See unbiased Token Metrics Ratings for BTC, ETH, and top alts.
Thank you! Your submission has been received!
Oops! Something went wrong while submitting the form.
 No credit card | 1-click unsubscribe

Who this guide is for. Token teams, exchanges, funds, and DAOs comparing liquidity management and market-making tools to tighten spreads, balance inventories, and support healthy markets.

Top three picks.

  1. Flowdesk — compliance-first platform + MMaaS across 140+ venues. (flowdesk.co)
  2. Keyrock — full-stack liquidity (MM, OTC, LP mgmt, NFTs). (Keyrock)
  3. Wintermute — leading algorithmic liquidity partner across CeFi/DeFi. (wintermute.com)

One key caveat. Fees and engagement models vary widely (retainer, inventory loan/call, performance); confirm scope, reporting, and legal terms before signing. (flowdesk.co)

Introduction: Why Crypto Liquidity Management & Market-Making Tools Matter in November 2025

In crypto, liquidity management and market-making tools keep order books tight, reduce slippage, and stabilize price discovery across centralized and decentralized venues. The primary keyword here is liquidity management and market-making tools, and the right stack blends execution algorithms, risk controls, analytics, and clear reporting so projects can support listings and users can trade efficiently.

In 2025, onchain liquidity is increasingly concentrated and active on AMMs while institutions expect 24/7 coverage and API connectivity across spot, perps, and options. Mature providers now offer compliance-forward processes, automated vaults for concentrated liquidity, and multi-venue execution with transparent documentation. This guide ranks ten credible options, explains trade-offs (costs, custody, venues), and gives you a practical checklist to choose confidently.

Best Crypto Liquidity Management & Market-Making Tools in November 2025 (Comparison Table)

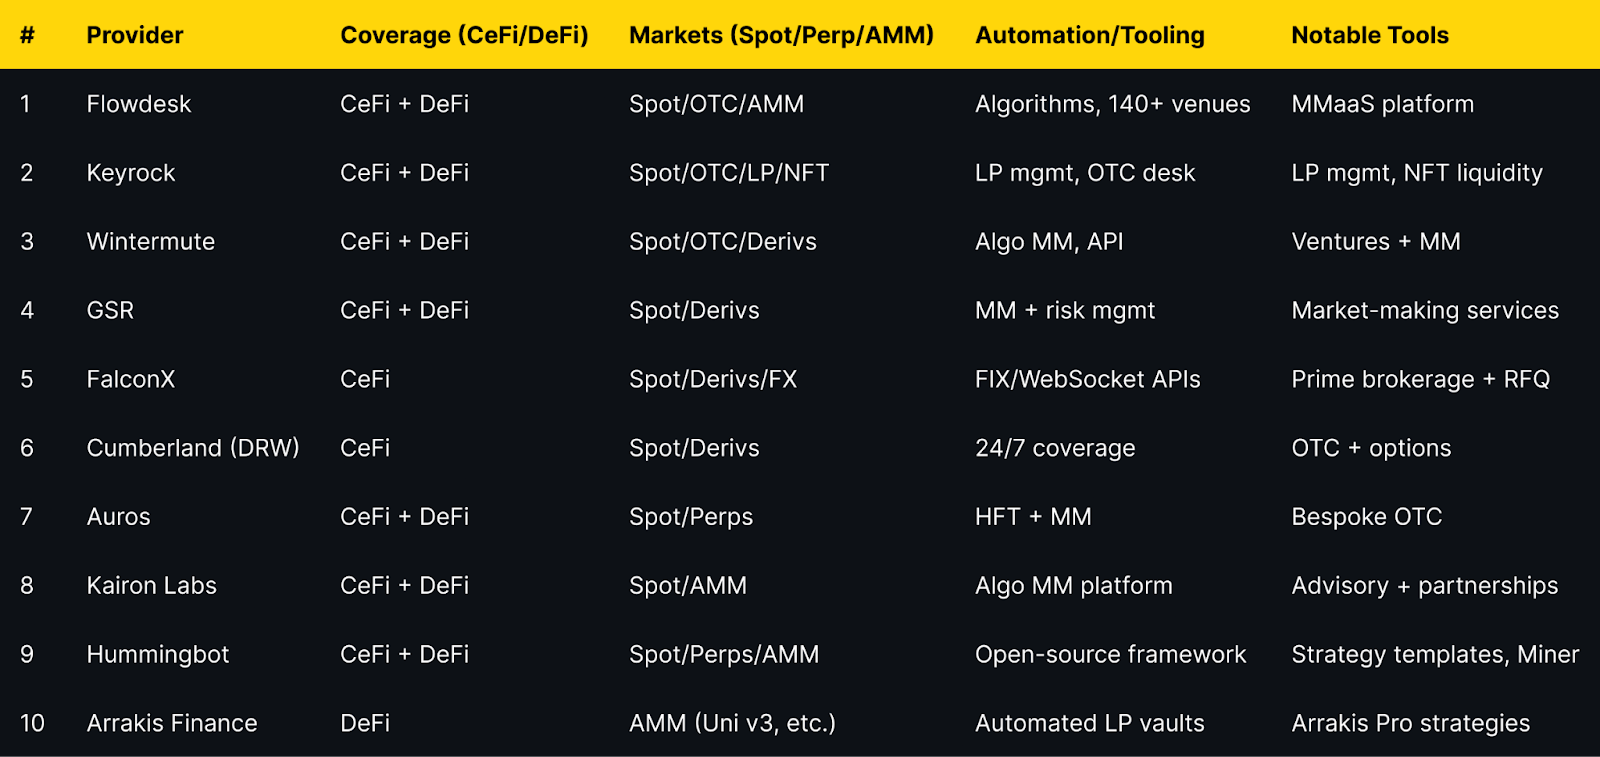
Evidence for venue coverage and capabilities appears in provider sections below.

Top 10 Crypto Liquidity Management & Market-Making Tools in November 2025

1. Flowdesk — Best for compliance-first MMaaS at global scale

Why Use It. Flowdesk runs a compliance-first market-making and OTC platform with proprietary execution algos and integrations across 140+ centralized and decentralized exchanges, suitable for token issuers that need unified coverage and reporting. (flowdesk.co)
Best For. Token issuers; exchanges; DAOs with multi-venue liquidity needs; teams prioritizing compliance.
Notable Features. Low-latency infrastructure; MMaaS with 24/7 teams; 140+ venue connectivity; internal policies & compliance center. (flowdesk.co)
Consider If. You want documented models (retainer vs loan/call) and clear KPIs before engagement. (flowdesk.co)
Fees Notes. Custom; contract-based; network/exchange fees apply.
Regions. Global; subject to local licensing and restrictions (France DASP registration referenced on site). (flowdesk.co)
Alternatives. Keyrock; GSR.


2. Keyrock — Best for full-stack liquidity (MM, OTC, LP, NFTs)

Why Use It. Keyrock delivers market making, OTC trading, treasury solutions, and liquidity pool management for token issuers and venues; it also offers NFT liquidity and publishes security awareness and terms. (Keyrock)
Best For. Issuers needing both CeFi and DeFi coverage; platforms adding NFT or LP liquidity.
Notable Features. Liquidity pool management; OTC/options; NFT liquidity; research/insights. (Keyrock)
Consider If. You want a single counterparty handling MM + LP mgmt with documented terms. (Keyrock)
Fees Notes. Custom; scope-based; network/exchange fees may apply.
Regions. Global; services subject to applicable laws and platform eligibility.
Alternatives. Flowdesk; Wintermute.


3. Wintermute — Best for algorithmic crypto liquidity at scale

Why Use It. Wintermute is a leading algorithmic trading firm and liquidity partner that supports efficient markets across centralized and decentralized venues, with a broader ventures arm for strategic projects. (wintermute.com)
Best For. Larger token issuers and institutions that want deep, programmatic liquidity and breadth of venues.
Notable Features. Algorithmic MM; OTC; venture support; expanding US presence. (fnlondon.com)
Consider If. You need institutional processes and policy engagement in the US market. (fnlondon.com)
Fees Notes. Custom; inventory/retainer structures typical.
Regions. Global.
Alternatives. GSR; FalconX.


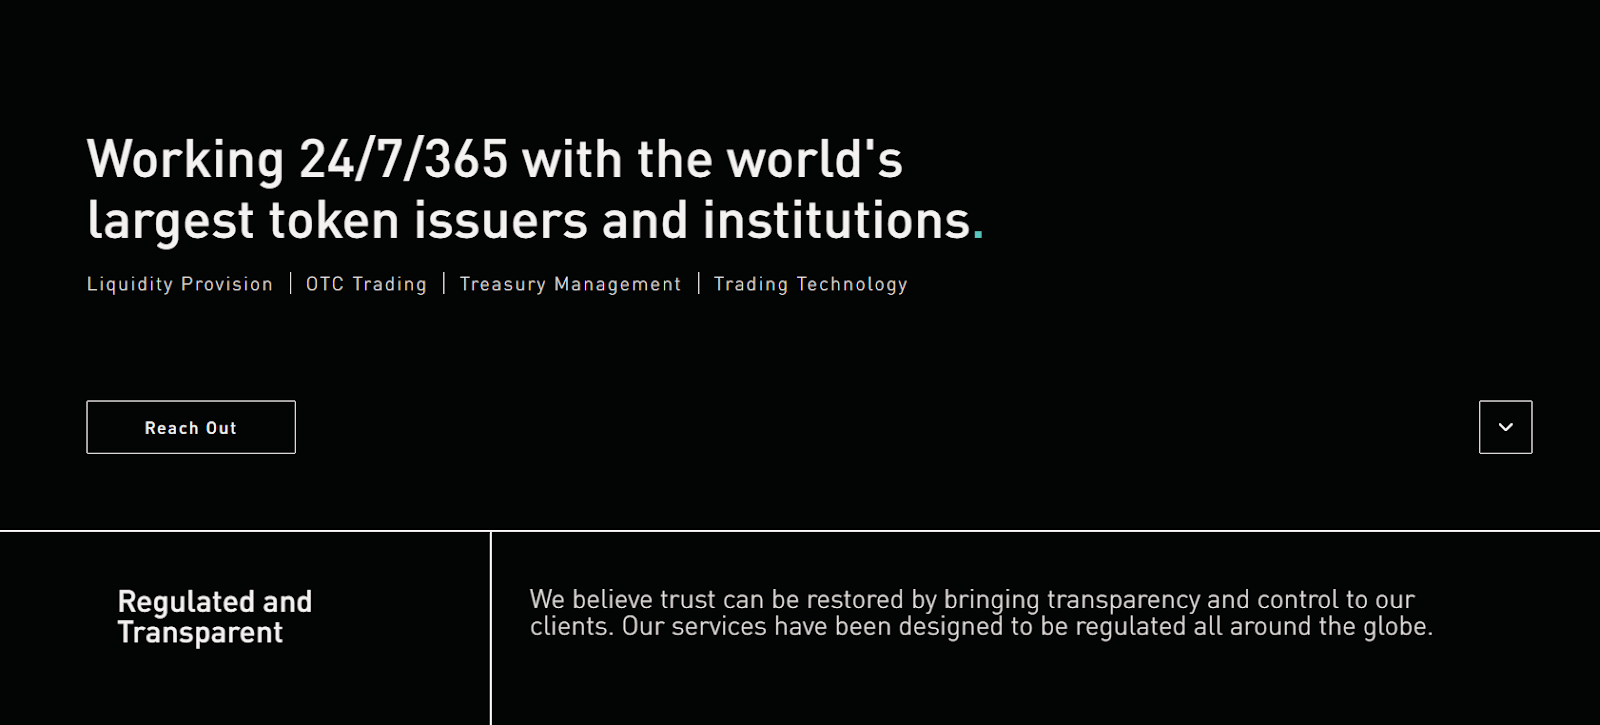
4. GSR — Best for crypto liquidity + risk management depth

Why Use It. GSR offers market-making and risk management across spot and derivatives, working with exchanges, token issuers, and institutions; it publishes regular research and insights. (gsr.io)
Best For. Issuers seeking experienced MM with derivatives coverage and institutional process.
Notable Features. Trading + market making services; exchange connectivity; research hub. (gsr.io)
Consider If. You need structured reporting and risk frameworks across venues.
Fees Notes. Custom; scope-based; exchange/network fees apply.
Regions. Global.
Alternatives. Wintermute; Flowdesk.

5. FalconX — Best prime brokerage + deep crypto liquidity access

Why Use It. FalconX is a prime broker with $2T+ executed and access to 400+ tokens, offering unified spot/derivs/FX execution, OTC, and APIs (WebSocket/FIX/REST). (falconx.io)
Best For. Institutions wanting a single counterparty with RFQ, streaming, and FIX integration.
Notable Features. Deep liquidity pool; algorithmic/TWAP tools; ETF issuer liquidity support; Talos integrations. (falconx.io)
Consider If. You want prime services plus execution algos rather than a pure MM retainer.
Fees Notes. Custom; execution- and volume-based; venue/network fees apply.
Regions. Global (token availability may vary). (falconx.io)
Alternatives. Cumberland; GSR.

6. Cumberland (DRW) — Best for institutional OTC and options

Why Use It. A DRW subsidiary active since 2014 in digital assets, Cumberland provides 24/7 institutional liquidity across spot, listed derivatives, bilateral options, and NDFs, with relationship coverage. (cumberland.io)
Best For. Institutions needing OTC block liquidity and derivatives structures.
Notable Features. OTC/RFQ; BTC/ETH options; futures basis; DRW backing. (cumberland.io)
Consider If. You need large, bespoke trades and derivatives hedging under institutional processes.
Fees Notes. Custom; RFQ spreads/commissions; venue/network fees apply.
Regions. Global, subject to applicable regulations.
Alternatives. FalconX; Wintermute.

7. Auros — Best for HFT-driven market-making with bespoke design

Why Use It. Auros combines high-frequency trading and strategic market making across CeFi and DeFi with bespoke OTC and transparency-oriented reporting for token stability. (Auros)
Best For. Projects seeking a partner for token launch support and stability across venues.
Notable Features. HFT + MM stack; CeFi/DeFi coverage; insights & reporting. (Auros)
Consider If. You want tailored strategies and comms during volatility.
Fees Notes. Custom; scope-based; network/venue fees apply.
Regions. Global.
Alternatives. Kairon Labs; GSR.

8. Kairon Labs — Best issuer-focused market-making + advisory

Why Use It. Kairon Labs provides algorithmic market making, liquidity provision, partnerships, and advisory for issuers, with educational content on MM models (designated vs principal). (kaironlabs.com)
Best For. Small–mid cap issuers needing hands-on guidance plus execution.
Notable Features. Issuer-centric services; partnerships support; model education. (kaironlabs.com)
Consider If. You want advisory plus MM under one roof.
Fees Notes. Custom; scope-based; exchange/network fees apply.
Regions. Global.
Alternatives. Auros; Flowdesk.

9. Hummingbot — Best open-source framework for DIY market making

Why Use It. Hummingbot is an open-source Python framework to run automated strategies on any CEX/DEX, with built-in templates for pure market making and perpetual MM and extensive docs. (hummingbot.org)
Best For. Developers, quant hobbyists, and small desks wanting DIY automation.
Notable Features. Strategy library; Docker/API quickstarts; Miner rewards marketplace. (hummingbot.org)
Consider If. You accept self-hosting and operational overhead instead of a service contract.
Fees Notes. Software is free; trading/withdrawal/network fees still apply.
Regions. Global (open-source).
Alternatives. Arrakis (for LP vaults); Keyrock (for managed LP).

10. Arrakis Finance — Best for automated onchain LP management (Uni v3 & more)

Why Use It. Arrakis provides automated LP vaults and Arrakis Pro strategies for token issuers to manage concentrated liquidity with rebalancing and inventory targeting. (arrakis.finance)
Best For. Projects prioritizing DeFi AMM depth and capital efficiency on Uniswap v3-style DEXs.
Notable Features. Ongoing inventory management; automated rebalancing; issuer-specific vault programs. (arrakis.finance)
Consider If. You need onchain, non-custodial liquidity programs over CeFi MM retainers.
Fees Notes. Protocol/vault fees; gas costs on supported chains.
Regions. Global (onchain).
Alternatives. Hummingbot (DIY); GSR (CeFi/MM).

Decision Guide: Best By Use Case

  • Regulated, compliance-first MMaaS: Flowdesk. (flowdesk.co)
  • One-stop liquidity incl. NFTs & LP mgmt: Keyrock. (Keyrock)
  • Algorithmic MM at institutional scale: Wintermute or GSR. (wintermute.com)
  • Prime brokerage + FIX/WebSocket execution: FalconX. (falconx.io)
  • OTC blocks + options structures: Cumberland (DRW). (cumberland.io)
  • Launch support with HFT expertise: Auros. (Auros)
  • Issuer-centric MM + advisory: Kairon Labs. (kaironlabs.com)
  • DIY automation (open-source): Hummingbot. (hummingbot.org)
  • Onchain concentrated liquidity programs: Arrakis Finance. (arrakis.finance)

How to Choose the Right Crypto Liquidity Management & Market-Making Tool (Checklist)

  • Region eligibility & licensing: Confirm provider registrations and legal terms in your jurisdictions.
  • Venue coverage: CeFi exchanges, perps venues, and DeFi AMMs you actually need.
  • Inventory model: Retainer vs. inventory loan/call; required collateral and risks. (flowdesk.co)
  • Execution stack: APIs (FIX/WebSocket/REST), algos, latency, and monitoring. (falconx.io)
  • Onchain LP management: If DeFi-first, evaluate vault design, rebalancing, and transparency. (arrakis.finance)
  • Reporting & SLAs: Daily/weekly liquidity KPIs, spread targets, uptime, incident process.
  • Security & compliance: Insider-trading controls, conflict-of-interest policies, audits/policies page. (flowdesk.co)
  • Costs & fees: Understand spread capture, performance fees, platform fees, and gas.
  • Offboarding plan: Access to accounts, revocation of keys, vault migrations, and documentation.

Red flags: No written terms, vague reporting, or inability to name supported venues.

Use Token Metrics With Any Crypto Liquidity Provider

  • AI Ratings to screen assets by quality and momentum before listings.


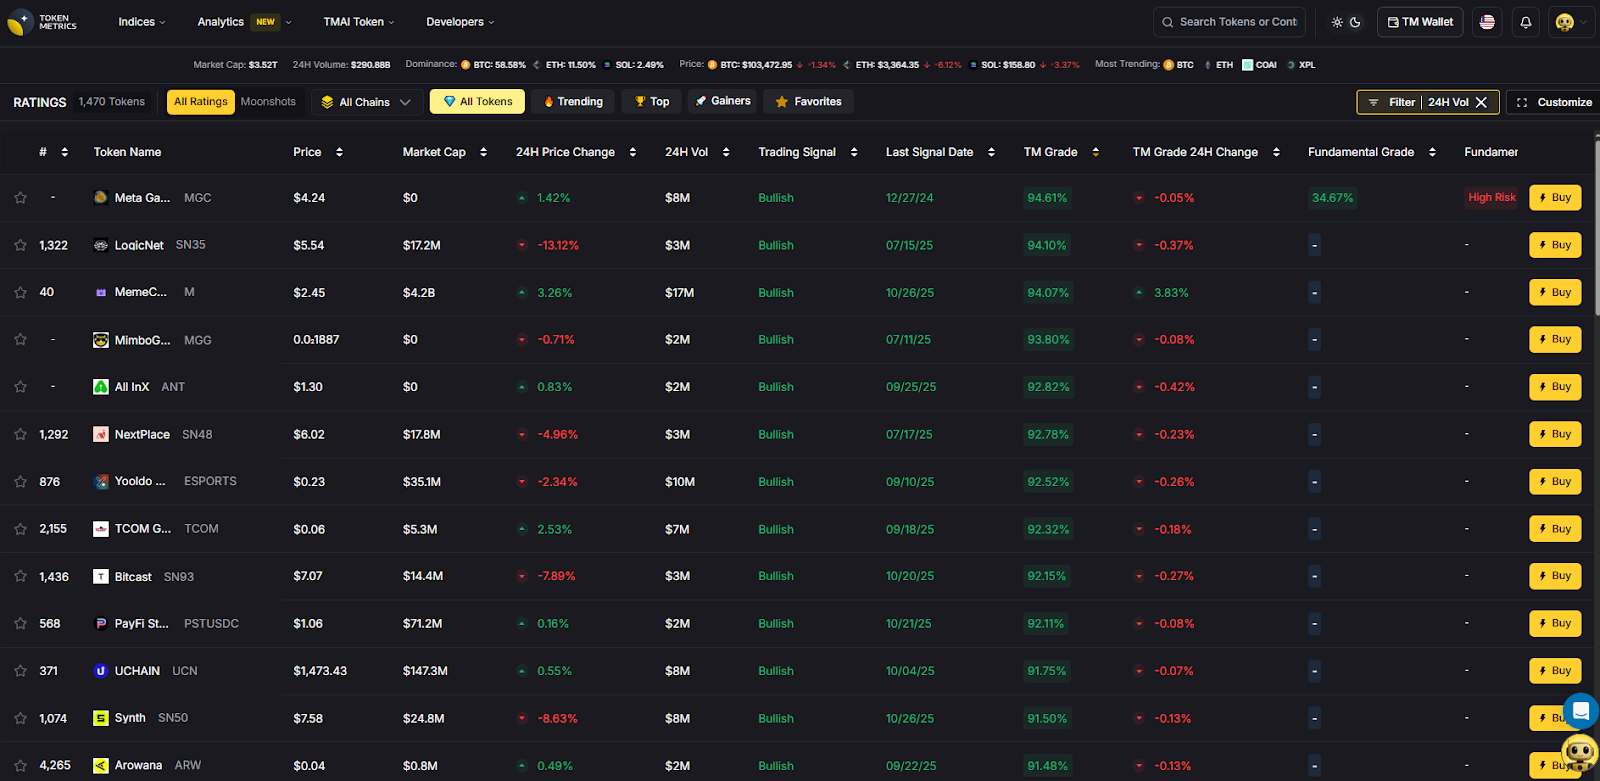
  • Narrative Detection to catch early theme shifts that can impact liquidity.
  • Portfolio Optimization to size inventory across chains and LPs.
  • Alerts & Signals to time entries/exits and rebalance LP ranges.

Workflow: Research in Token Metrics → Select provider → Execute on-chain/CeFi → Monitor with alerts.


Start free trial to screen assets and time entries with AI.


Security & Compliance Tips

  • Prefer partners that publish policies/compliance pages and name registrations. (flowdesk.co)
  • Segregate exchange accounts and use least-privilege API keys; rotate regularly.
  • For DeFi vaults, verify non-custodial design, fee schedules, and admin controls. (arrakis.finance)
  • Confirm reporting cadence (inventory, spreads, volume, venue list).
  • Use official domains and channels to avoid impersonation. (Keyrock)
  • Understand engagement models (retainer vs loan/call) and associated risks. (flowdesk.co)

This article is for research/education, not financial advice.

Beginner Mistakes to Avoid

  • Signing without clear KPIs (spread, depth, venue list).
  • Ignoring region restrictions or licensing.
  • Overlooking DeFi vault mechanics (rebalance rules, fees, inventories). (arrakis.finance)
  • Mixing treasury and MM wallets without operational controls.
  • Choosing CeFi-only when you need AMM depth (or vice versa).
  • Underestimating implementation: APIs, custody, exchange listings, oracle feeds.

How We Picked (Methodology & Scoring)

We scored each provider using the following weights:

  • Liquidity — 30% (depth, spreads, execution venues)
  • Security — 25% (controls, disclosures, compliance posture)
  • Coverage — 15% (CeFi/DeFi, spot/derivs, chain support)
  • Costs — 15% (fee clarity, model fit, onchain costs)
  • UX — 10% (integration, tooling, reporting)
  • Support — 5% (24/7 coverage, responsiveness)

Data sources: official product, docs, pricing/terms, security/policies, and status pages; reputable market datasets used only to cross-check scale and venues. Last updated November 2025.

FAQs

What are liquidity management and market-making tools?
 Software platforms and service providers that supply bids/asks, balance inventory, and manage onchain liquidity so markets remain liquid with tighter spreads and lower slippage (CeFi and DeFi).

Are managed market makers or DIY bots safer?
 Managed providers handle execution, risk, and reporting under contracts; DIY bots like Hummingbot provide control but require operational expertise and monitoring. Choose based on team capacity and risk tolerance. (hummingbot.org)

How do providers charge?
 Common models include retainers, inventory loan/call structures, execution fees/spreads, and protocol/vault fees on DeFi. Clarify model, caps, and KPI targets before engagement. (flowdesk.co)

Can I combine CeFi MM with DeFi vaults?
 Yes. Many issuers use a CeFi MM for order books plus an onchain LP manager (e.g., Arrakis) for AMM depth, with shared reporting and risk limits. (arrakis.finance)

Do these tools work in the US/EU/APAC?
 Most providers are global but subject to local regulations, listings, and counterparty restrictions. Check each provider’s terms/compliance pages and confirm venue eligibility. (flowdesk.co)

Conclusion + Related Reads

If you want compliance-centric, multi-venue coverage, start with Flowdesk or Keyrock. For institutional scale, add Wintermute or GSR. If you need prime services and execution, consider FalconX or Cumberland. For DIY or onchain-first, evaluate Hummingbot and Arrakis.

Related Reads (Token Metrics):

Build Smarter Crypto Apps &
AI Agents in Minutes, Not Months
Real-time prices, trading signals, and on-chain insights all from one powerful API.
Grab a Free API Key
About Token Metrics
Token Metrics: AI-powered crypto research and ratings platform. We help investors make smarter decisions with unbiased Token Metrics Ratings, on-chain analytics, and editor-curated “Top 10” guides. Our platform distills thousands of data points into clear scores, trends, and alerts you can act on.
30 Employees
analysts, data scientists, and crypto engineers
Daily Briefings
concise market insights and “Top Picks”
Transparent & Compliant
Sponsored ≠ Ratings; research remains independent
Want Smarter Crypto Picks—Free?
See unbiased Token Metrics Ratings for BTC, ETH, and top alts.
Thank you! Your submission has been received!
Oops! Something went wrong while submitting the form.
 No credit card | 1-click unsubscribe
Token Metrics Team
Token Metrics Team

Recent Posts

Research

Avalanche Price Prediction 2027: $25-$320 Target Analysis

Token Metrics Team
6 min read

Avalanche Price Prediction: AVAX in the 2027 Landscape

The Layer 1 competitive landscape is consolidating as markets recognize that specialization matters more than being a generic alternative to Ethereum. Avalanche positions itself in this multi-chain world with specific technical and ecosystem advantages. Infrastructure maturity around custody, bridges, and developer tooling makes alternative L1s more accessible heading into 2026.

The price prediction scenario projections below map different market share outcomes for AVAX across varying total crypto market sizes. Base case price predictions assume Avalanche maintains current ecosystem momentum, while moon scenarios factor in accelerated adoption, and bear cases reflect increased competitive pressure.


Disclosure

Educational purposes only, not financial advice. Crypto is volatile, do your own research and manage risk.

How to read it: Each band blends cycle analogues and market-cap share math with TA guardrails. Base assumes steady adoption and neutral or positive macro. Moon layers in a liquidity boom. Bear assumes muted flows and tighter liquidity.

TM Agent baseline:

Token Metrics lead metric for Avalanche price prediction, cashtag $AVAX, is a TM Grade of 66.2%, which maps to Hold, and the trading signal is bearish, indicating short-term downward momentum. Concise long-term numeric price prediction view, 12-month horizon: Token Metrics' scenarios center around a price band roughly between $15 and $40, with a base case price target near $25. Market context: Bitcoin's direction remains the primary market driver, so broader crypto risk-on conditions are required for $AVAX to reach the higher price prediction scenario.

Live details: Avalanche Token Details

Affiliate Disclosure: We may earn a commission from qualifying purchases made via this link, at no extra cost to you.

Key Takeaways for AVAX Price Prediction

  • Scenario driven: price prediction outcomes hinge on total crypto market cap; higher liquidity and adoption lift the price bands
  • Fundamentals: Fundamental Grade 91.63% (Community 82%, Tokenomics 100%, Exchange 100%, VC 97%, DeFi Scanner 83%)
  • Technology: Technology Grade 80.52% (Activity 80%, Repository 72%, Collaboration 93%, Security 59%, DeFi Scanner 83%)
  • TM Agent gist: AVAX shows decent fundamentals with a Hold grade, short-term momentum is bearish, and a 12-month price prediction range clusters around $15 to $40 with a base near $25
  • Education only, not financial advice

Avalanche Price Prediction: Scenario Analysis

Token Metrics price prediction scenarios span four market cap tiers, each representing different levels of crypto market maturity and liquidity:

8T Market Cap Price Prediction:

At an eight trillion dollar total crypto market cap, AVAX price prediction projects to $45.63 in bear conditions, $54.07 in the base case, and $62.50 in bullish scenarios.

16T Market Cap Price Prediction:

Doubling the market to sixteen trillion expands the price prediction range to $97.92 (bear), $123.23 (base), and $148.53 (moon).

23T Market Cap Price Prediction:

At twenty-three trillion, the price forecast scenarios show $150.20, $192.38, and $234.56 respectively.

31T Market Cap Price Prediction:

In the maximum liquidity scenario of thirty-one trillion, AVAX price prediction could reach $202.49 (bear), $261.54 (base), or $320.59 (moon).

Each tier assumes progressively stronger market conditions, with the base case reflecting steady growth and the moon case requiring sustained bull market dynamics.

Why Consider the Indices with Top-100 Exposure

Avalanche represents one opportunity among hundreds in crypto markets. Token Metrics Indices bundle AVAX with top one hundred assets for systematic exposure to the strongest projects. Single tokens face idiosyncratic risks that diversified baskets mitigate.

Historical index performance demonstrates the value of systematic diversification versus concentrated positions.

Join the early access list

What Is Avalanche?

Avalanche is a smart-contract platform known for high throughput, low latency, and a modular subnet architecture. It aims to support decentralized finance, gaming, and enterprise applications with fast finality and cost-efficient transactions.

AVAX is the native token used for fees, staking, and network security, and it powers activity across application subnets. The ecosystem positions Avalanche among leading Layer 1s competing for developer mindshare and user adoption.

Token Metrics AI Analysis for Price Prediction

Token Metrics AI provides comprehensive context on Avalanche's positioning and challenges that inform our price prediction models.

Vision: Avalanche aims to provide a highly scalable, secure, and decentralized platform for launching custom blockchains and decentralized applications. Its vision centers on enabling a global, open financial system and supporting a diverse ecosystem of interoperable blockchains.

Problem: Many blockchain networks face trade-offs between speed, security, and decentralization, often resulting in high fees and slow transaction times during peak demand. Avalanche addresses the need for a scalable and efficient infrastructure that can support widespread adoption of dApps and enterprise use cases without compromising on performance or security.

Solution: Avalanche uses a novel consensus mechanism that achieves rapid finality with low energy consumption, differentiating it from traditional Proof-of-Work systems. It employs a three-chain architecture—Exchange Chain (X-Chain), Platform Chain (P-Chain), and Contract Chain (C-Chain)—to separate functions like asset creation, staking, and smart contract execution, enhancing efficiency and scalability.

Market Analysis: Avalanche operates in the competitive Layer 1 blockchain space. It differentiates itself through its consensus protocol and support for subnet-based custom blockchains. Adoption is influenced by developer activity, partnerships, and integration with major DeFi protocols, with risks from technological shifts and regulatory developments.

Fundamental and Technology Snapshot from Token Metrics

Fundamental Grade: 91.63% (Community 82%, Tokenomics 100%, Exchange 100%, VC 97%, DeFi Scanner 83%).


Technology Grade: 80.52% (Activity 80%, Repository 72%, Collaboration 93%, Security 59%, DeFi Scanner 83%).


Catalysts That Skew Bullish for Price Prediction

  • Institutional and retail access expands with ETFs, listings, and integrations
  • Macro tailwinds from lower real rates and improving liquidity
  • Product or roadmap milestones such as upgrades, scaling, or partnerships
  • These factors could push AVAX toward higher price prediction targets

Risks That Skew Bearish for Price Prediction

  • Macro risk-off from tightening or liquidity shocks
  • Regulatory actions or infrastructure outages
  • Concentration in validator economics and competitive displacement
  • These factors could push AVAX toward lower price prediction scenarios

FAQs: Avalanche Price Prediction

Can AVAX reach $200 according to price predictions?

Based on the price prediction scenarios, AVAX could reach $200 in the 31T bear case at $202.49. The 31T tier also shows $261.54 in the base case price forecast and $320.59 in the moon case. Not financial advice.

Can AVAX 10x from current levels based on price predictions?

At a current price of $19.62, a 10x would reach $196.20. This falls within the 31T bear, base, and moon case price predictions, and the 23T moon case at $234.56. Bear in mind that 10x returns require substantial market cap expansion. Not financial advice.

Should I buy AVAX now or wait based on price predictions?

Timing depends on your risk tolerance and macro outlook. Current price of $19.62 sits below the 8T bear case price prediction at $45.63. Dollar-cost averaging may reduce timing risk. Not financial advice.

What is the 2027 Avalanche price prediction?

Based on Token Metrics analysis, the 2027 price prediction for Avalanche centers around $25 in the base case under current market conditions, with a range between $15 and $40 depending on market scenarios. Bullish price predictions range from $54.07 to $320.59 across different total crypto market cap environments.

What drives AVAX price predictions?

AVAX price predictions are driven by subnet adoption, DeFi ecosystem growth, developer activity, institutional partnerships, and overall Layer 1 competition. The strong fundamentals (91.63% grade) support long-term price potential, though short-term bearish signals suggest caution. Market-wide crypto conditions remain the primary driver for reaching upper price prediction targets.

Can AVAX reach $300 by 2027?

According to our price prediction models, AVAX could reach $300+ in the 31T moon case where it projects to $320.59. This price prediction outcome requires the total crypto market to reach 31 trillion and Avalanche to maintain strong competitive positioning with accelerated subnet adoption. Not financial advice.


Next Steps

Disclosure

Educational purposes only, not financial advice. Crypto is volatile, do your own research and manage risk.

Powered by Token Metrics

Our team delivers scenario-driven price projections, in-depth grades, and actionable indices to empower smarter crypto investing—with both human and AI insights.

Research

Hedera Price Prediction 2027: $0.10-$1.42 Target Analysis

Token Metrics Team
8 min read

Hedera Price Prediction: Portfolio Context for HBAR in the 2027 Landscape

Layer 1 tokens like Hedera represent bets on specific blockchain architectures winning developer and user mindshare. HBAR carries both systematic crypto risk and unsystematic risk from Hedera's technical roadmap execution and ecosystem growth. Multi-chain thesis suggests diversifying across several L1s rather than concentrating in one, since predicting which chains will dominate remains difficult.

The price prediction projections below show how HBAR might perform under different market cap scenarios. While Hedera may have strong fundamentals, prudent portfolio construction balances L1 exposure across Ethereum, competing smart contract platforms, and Bitcoin to capture the sector without overexposure to any single chain's fate.


Disclosure

Educational purposes only, not financial advice. Crypto is volatile, do your own research and manage risk.

How to read this price prediction:

Each band blends cycle analogues and market-cap share math with TA guardrails. Base assumes steady adoption and neutral or positive macro. Moon layers in a liquidity boom. Bear assumes muted flows and tighter liquidity.

TM Agent baseline:

Token Metrics lead metric for Hedera price prediction, cashtag $HBAR, is a TM Grade of 61.8%, which maps to Hold, and the trading signal is bearish, indicating short-term downward momentum. This means Token Metrics views $HBAR as having reasonably solid fundamentals but limited conviction for strong outperformance in the near term.

A concise long-term numeric price prediction view for a 12-month horizon: Token Metrics scenarios center around a range of about $0.06 to $0.18, with a base case price target near $0.10, reflecting steady ecosystem growth, moderate adoption of Hedera services, and continued enterprise partnerships. Implication: if Bitcoin and broader crypto risk appetite improve, $HBAR could revisit the higher end of the price prediction range, while a risk-off market or slower-than-expected developer traction would keep it toward the lower bound.

Token Details

Key Takeaways

  • Scenario driven, outcomes hinge on total crypto market cap, higher liquidity and adoption lift the bands.
  • Single-asset concentration amplifies both upside and downside versus diversified approaches.
  • Fundamentals: Fundamental Grade 81.08% (Community 74%, Tokenomics 100%, Exchange 100%, VC 59%, DeFi Scanner 85%).
  • Technology: Technology Grade 62.39% (Activity 58%, Repository 68%, Collaboration 74%, Security 56%, DeFi Scanner 85%).
  • TM Agent gist: bearish short term, range view with upside if crypto risk appetite improves.
  • Education only, not financial advice.

Hedera Price Prediction: Scenario Analysis

Token Metrics price prediction scenarios span four market cap tiers, each representing different levels of crypto market maturity and liquidity:

8T Market Cap Price Prediction:

At an 8 trillion dollar total crypto market cap, HBAR price prediction projects to $0.27 in bear conditions, $0.32 in the base case, and $0.37 in bullish scenarios.

16T Market Cap Price Prediction:

Doubling the market to 16 trillion expands the price prediction range to $0.42 (bear), $0.57 (base), and $0.72 (moon).

23T Market Cap Price Prediction:

At 23 trillion, the price forecast scenarios show $0.56, $0.82, and $1.07 respectively.

31T Market Cap Price Prediction:

In the maximum liquidity scenario of 31 trillion, HBAR price prediction could reach $0.71 (bear), $1.07 (base), or $1.42 (moon).

These price prediction ranges illustrate potential outcomes for concentrated HBAR positions, but investors should weigh whether single-asset exposure matches their risk tolerance or whether diversified strategies better suit their objectives.

The Case for Diversified Index Exposure

Professional investors across asset classes prefer diversified exposure over concentrated bets for good reason. Hedera faces numerous risks - technical vulnerabilities, competitive pressure, regulatory targeting, team execution failure - any of which could derail HBAR performance independent of broader market conditions. Token Metrics Indices spread this risk across one hundred tokens, ensuring no single failure destroys your crypto portfolio.

Diversification becomes especially critical in crypto given the sector's nascency and rapid evolution. Technologies and narratives that dominate today may be obsolete within years as the space matures. By holding HBAR exclusively, you're betting not only on crypto succeeding but on Hedera specifically remaining relevant. Index approaches hedge against picking the wrong horse while maintaining full crypto exposure.

Tax efficiency and rebalancing challenges also favor indices over managing concentrated positions. Token Metrics Indices handle portfolio construction, rebalancing, and position sizing systematically, eliminating the emotional and logistical burden of doing this manually with multiple tokens.

Early access to Token Metrics Indices 

What Is Hedera?

Hedera is a high-performance public ledger that emphasizes speed, low fees, and energy efficiency, positioning itself for enterprise and decentralized applications. It uses a unique Hashgraph consensus that enables fast finality and high throughput, paired with a council-governed model that targets real-world use cases like payments, tokenization, and decentralized identity.

HBAR is the native token used for fees, staking, and network security, and it supports smart contracts and decentralized file storage. Adoption draws from partnerships and integrations, though decentralization levels and reliance on institutional demand are often discussed in the community.

Token Metrics AI Analysis for Price Prediction

Token Metrics AI provides comprehensive context on Hedera's positioning and challenges that inform our price prediction models.

  • Vision: Hedera's vision is to provide a secure, fair, and scalable distributed ledger technology platform that supports decentralized applications and enterprise use cases globally. It emphasizes governed decentralization, aiming to combine the benefits of distributed systems with responsible oversight through its council-based governance model.
  • Problem: Many blockchain networks face trade-offs between scalability, security, and decentralization, often resulting in high transaction fees, slow processing times, or environmental concerns. Hedera aims to address these limitations by offering a system that supports high throughput and fast finality without sacrificing security or incurring significant energy costs, making it suitable for both enterprise and decentralized applications.
  • Solution: Hedera uses the Hashgraph consensus algorithm, a directed acyclic graph (DAG)-based approach that achieves asynchronous Byzantine fault tolerance, enabling fast, secure, and fair transaction processing. The network supports smart contracts, tokenization, and decentralized file storage, with HBAR serving as the native token for fees, staking, and network security. Its council-governed model aims to ensure stability and trust, particularly for institutional and enterprise users.
  • Market Analysis: Hedera operates in the Layer 1 blockchain space, competing with high-throughput platforms like Solana, Avalanche, and Algorand, while differentiating through its Hashgraph consensus and governed governance model. It targets enterprise adoption, focusing on use cases in supply chain, payments, and asset tokenization, which sets it apart from more community-driven or DeFi-centric networks. Adoption is influenced by strategic partnerships, developer engagement, and real-world integrations rather than speculative activity. Key risks include competition from established and emerging blockchains, regulatory scrutiny around governance tokens, and challenges in achieving broad decentralization.

Fundamental and Technology Snapshot from Token Metrics

Fundamental Grade: 81.08% (Community 74%, Tokenomics 100%, Exchange 100%, VC 59%, DeFi Scanner 85%).


Technology Grade: 62.39% (Activity 58%, Repository 68%, Collaboration 74%, Security 56%, DeFi Scanner 85%).


Catalysts That Skew Bullish for Price Prediction

  • Institutional and retail access expands with ETFs, listings, and integrations
  • Macro tailwinds from lower real rates and improving liquidity
  • Product or roadmap milestones such as upgrades, scaling, or partnerships
  • These factors could push HBAR toward higher price prediction targets

Risks That Skew Bearish for Price Prediction

  • Macro risk-off from tightening or liquidity shocks
  • Regulatory actions or infrastructure outages
  • Concentration in validator economics and competitive displacement
  • Protocol-specific execution risk and competitive pressure from alternatives
  • These factors could push HBAR toward lower price prediction scenarios

FAQs: Hedera Price Prediction

Can HBAR reach $1.00 according to price predictions?

Yes. Based on the price prediction scenarios, HBAR could reach $1.00 or above in the higher tiers. The 23T tier projects $1.07 in the moon case price forecast and the 31T tier projects $1.42 in the moon case. Achieving this price prediction requires broad market cap expansion and Hedera maintaining competitive position. Not financial advice.

What price could HBAR reach in the moon case price prediction?

Moon case price predictions range from $0.37 at 8T to $1.42 at 31T total crypto market cap. These price prediction scenarios assume maximum liquidity expansion and strong Hedera adoption. Diversified strategies aim to capture upside across multiple tokens rather than betting exclusively on any single moon scenario. Not financial advice.

What's the risk/reward profile for HBAR price prediction?

Risk and reward in our price prediction model span from $0.27 in the lowest bear case to $1.42 in the highest moon case. Downside risks include regulatory or infrastructure setbacks and competitive pressure, while upside drivers include improved liquidity and enterprise adoption. Concentrated positions amplify both tails, while diversified strategies smooth outcomes.

What is the 2027 Hedera price prediction?

Based on Token Metrics analysis, the 2027 price prediction for Hedera centers around $0.10 in the base case under current market conditions, with a range between $0.06 and $0.18 depending on market scenarios. Bullish price predictions range from $0.32 to $1.42 across different total crypto market cap environments.

What drives HBAR price predictions?

HBAR price predictions are driven by enterprise adoption of Hashgraph technology, institutional partnerships (Google Cloud, IBM, Boeing), council governance decisions, and competition from other Layer 1 platforms. The strong fundamentals (81.08% grade) support long-term price potential, though short-term bearish signals suggest caution. Enterprise use case development remains the primary driver for reaching upper price prediction targets.

Can HBAR reach $0.50 by 2027?

According to our price prediction models, HBAR could reach $0.50+ in multiple scenarios: the 16T base case ($0.57), 16T moon case ($0.72), and all higher market cap tiers. This price prediction outcome requires steady crypto market growth (16T+ total market cap) and Hedera maintaining strong enterprise partnerships. Not financial advice.


Next Steps

Disclosure

Educational purposes only, not financial advice. Crypto is volatile, concentration amplifies risk, and diversification is a fundamental principle of prudent portfolio construction. Do your own research and manage risk appropriately.

Research

LEO Token Price Prediction: Comprehensive Market Cap Scenario Analysis

Token Metrics Team
5 min read

LEO Token Price Prediction Framework: Market Cap Scenarios

Exchange tokens derive value from trading volume and platform revenue, creating linkage between crypto market activity and LEO price action. LEO Token delivers utility through reduced trading fees and enhanced platform services on Bitfinex and iFinex across Ethereum and EOS. Token Metrics price prediction scenarios below model LEO outcomes across different total crypto market cap environments, providing investors with data-driven forecasts for strategic decision-making.


Disclosure

Educational purposes only, not financial advice. Crypto is volatile, do your own research and manage risk.

How to Read This LEO Price Prediction

Each band blends cycle analogues and market-cap share math with TA guardrails. Base assumes steady adoption and neutral or positive macro. Moon layers in a liquidity boom. Bear assumes muted flows and tighter liquidity.

TM Agent baseline: Token Metrics price prediction probabilities favor a modest range between about $5 and $15, with a base case around current levels near $9, conditional on exchange token utility remaining steady, and downside risk if centralized exchange macro pressure increases.

Live details: Token Details 

Key Takeaways

  • Scenario driven, outcomes hinge on total crypto market cap, higher liquidity and adoption lift the bands.
  • TM Agent gist: 12-month horizon favors $5 to $15 range with base case near $9, contingent on stable exchange utility.
  • Education only, not financial advice.

LEO Token Price Prediction Scenario Analysis

Token Metrics price prediction scenarios span four market cap tiers reflecting different crypto market maturity levels:

8T Market Cap - LEO Price Prediction:

At 8 trillion total crypto market cap, LEO price prediction projects to $11.35 in bear conditions, $12.92 in the base case, and $14.48 in bullish scenarios.

16T Market Cap - LEO Price Prediction:

At 16 trillion total crypto market cap, LEO price prediction projects to $14.82 in bear conditions, $19.51 in the base case, and $24.20 in bullish scenarios.

23T Market Cap - LEO Price Prediction:

At 23 trillion total crypto market cap, LEO price prediction projects to $18.28 in bear conditions, $26.10 in the base case, and $33.92 in bullish scenarios.

31T Market Cap - LEO Price Prediction:

At 31 trillion total crypto market cap, LEO price prediction projects to $21.74 in bear conditions, $32.69 in the base case, and $43.63 in bullish scenarios.

Each tier in our price prediction framework assumes progressively stronger market conditions, with base scenarios reflecting steady exchange growth and moon cases requiring sustained bull market dynamics.

What Is LEO Token?

LEO Token is the native utility token of the Bitfinex and iFinex ecosystem, designed to provide benefits like reduced trading fees, enhanced lending and borrowing terms, and access to exclusive features on the platform. It operates on both Ethereum (ERC-20) and EOS blockchains, offering flexibility for users.

The primary role of LEO is to serve as a utility token within the exchange ecosystem, enabling fee discounts, participation in token sales, and other platform-specific advantages. Common usage patterns include holding LEO to reduce trading costs and utilizing it for enhanced platform services, positioning it primarily within the exchange token sector.

Catalysts That Skew LEO Price Predictions Bullish

  • Institutional and retail access expands with ETFs, listings, and integrations
  • Macro tailwinds from lower real rates and improving liquidity
  • Product or roadmap milestones such as upgrades, scaling, or partnerships
  • Increased Bitfinex trading volume and platform adoption
  • Strategic token burns and buyback programs

Risks That Skew LEO Price Predictions Bearish

  • Macro risk-off from tightening or liquidity shocks
  • Regulatory actions targeting centralized exchanges or infrastructure outages
  • Concentration risk or competitive displacement from rival exchange tokens
  • Declining exchange market share or trading volume
  • Negative sentiment around centralized exchange tokens

LEO Token Price Prediction FAQs

What gives LEO value?

LEO accrues value through reduced trading fees and enhanced platform services within the Bitfinex and iFinex ecosystem. Demand drivers include exchange usage and access to platform features, while supply dynamics follow the token's exchange utility design. Value realization depends on platform activity and user adoption—key factors in our price prediction methodology.

What price could LEO reach in the moon case?

Our moon case price predictions range from $14.48 at 8T to $43.63 at 31T total crypto market cap. These scenarios require maximum market cap expansion and strong exchange activity. Not financial advice.

What is the LEO Token price prediction for 2025-2027?

Our comprehensive price prediction framework suggests LEO could trade between $5 and $43.63 depending on market conditions and total crypto market capitalization. The base case price prediction scenario clusters around $9 to $32.69 across different market cap environments over the next 12-24 months. Not financial advice.

Can LEO Token reach $20?

Yes. Based on our price prediction scenarios, LEO could reach $19.51 in the 16T base case and surpass $20 in higher market cap scenarios (23T and 31T tiers). The 23T base case projects $26.10, making $20 an achievable target under favorable market conditions. Not financial advice.

Can LEO Token reach $50?

LEO reaching $50 would exceed our current price prediction models' highest scenario of $43.63 (31T moon case). This would require extraordinary market conditions beyond the 31T total crypto market cap tier and exceptional Bitfinex platform growth. Not financial advice.

Is LEO Token a good investment based on price predictions?

LEO's price prediction is tied to Bitfinex exchange performance and utility value. The token offers fee discounts and platform benefits, with moderate growth potential in our base scenarios. However, exchange token valuations carry platform-specific risks. Always conduct your own research and consult financial advisors. Not financial advice.

How accurate are LEO Token price predictions?

Our LEO price predictions use scenario-based modeling across multiple market cap tiers, combining cycle analogues, market-cap share math, and technical analysis guardrails. While this methodology provides structured forecasts, cryptocurrency markets remain highly volatile and unpredictable. Use these price predictions as educational frameworks, not guarantees. Not financial advice.


Next Steps

Curious how these forecasts are made? Token Metrics delivers LEO on-chain grades, forecasts, and deep research on 6,000+ tokens. Instantly compare fundamentals, on-chain scores, and AI-powered predictions.

Disclosure

Educational purposes only, not financial advice. Crypto is volatile, do your own research and manage risk.

Why Use Token Metrics for LEO Price Predictions?

  • Data-driven forecasts: Scenario-based price prediction models across multiple market cap tiers
  • Comprehensive analysis: On-chain metrics, fundamental grades, and technical guardrails
  • AI-powered insights: Advanced algorithms analyze 6,000+ tokens for comparative analysis
  • Regular updates: Real-time price predictions and signals based on market conditions
  • Risk management: Multiple scenarios (bear, base, moon) for informed decision-making
Choose from Platinum, Gold, and Silver packages
Reach with 25–30% open rates and 0.5–1% CTR
Craft your own custom ad—from banners to tailored copy
Perfect for Crypto Exchanges, SaaS Tools, DeFi, and AI Products