Back to blog
Research

Top 10 Pump.fun Livestream Tokens by Fees Earned

A data-first look at Pump.fun livestream leaders ranked strictly by Fees Earned, with snapshots, patterns, and how to follow moves in real time.
Token Metrics Team
7 min read
Want Smarter Crypto Picks—Free?
See unbiased Token Metrics Ratings for BTC, ETH, and top alts.
Thank you! Your submission has been received!
Oops! Something went wrong while submitting the form.
 No credit card | 1-click unsubscribe


Opening Hook

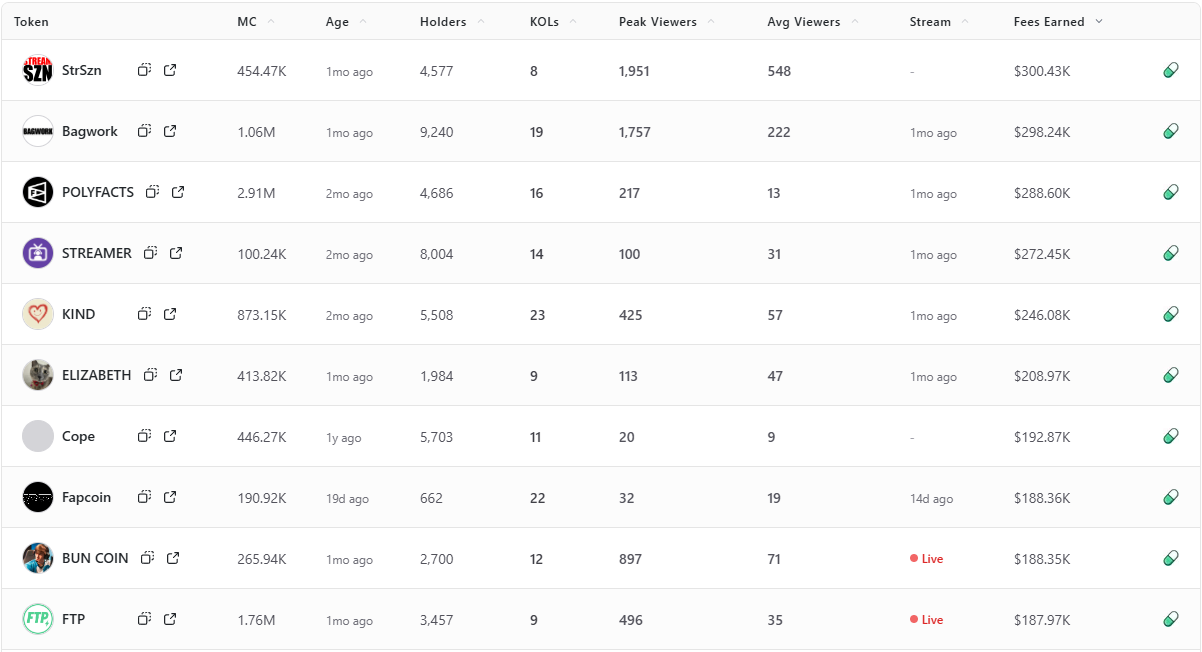
Fees Earned is a clean way to see which livestream tokens convert attention into on-chain activity. This leaderboard ranks the top 10 Pump.fun livestream tokens by Fees Earned using the screenshot you provided.

Selection rule is simple, top 10 by Fees Earned from the screenshot, numbers appear exactly as shown. If a field is not in the image, it is recorded as —.

Entity coverage: project names and tickers are taken as listed on Pump.fun, chain is Solana, sector is livestream meme tokens and creator tokens.

Featured: Token Metrics Live (TMLIVE) — Why We Built on Pump.fun

Token Metrics Live (TMLIVE) brings real time, data driven crypto market analysis to Pump.fun. The team has produced live crypto content for 7 years with a 500K plus audience and a platform of more than 100,000 users. Our public track record includes early coverage of winners like MATIC and Helium in 2018.

TMLIVE Quick Stats, as captured

  • ATH market cap: $291.7K
  • 24 hour volume on day one: $1.7M
  • Holders at capture: ~876
  • Current market cap at capture: $36.1K, displayed price: $0.043, visible chart timestamp: 22:33:49 UTC
  • Ticker: TMLIVE, Chain: Solana, Contract: 8Dxpc8Q8jg7TK8TT1pVntcqunHGofqpetCaP5fEhpump
  • Use these as captured numbers when referencing day one results. If you update screenshots later, swap in the new captures.

TLDR: Fees Earned Leaders at a Glance

  • Fees Earned: StrSzn ranks first with strong peak and average viewership for its size.
  • Fees Earned: Bagwork and POLYFACTS are close behind, both with large holder bases and double digit KOL counts.
  • Fees Earned: KIND shows the biggest KOL presence in the top 10, aligned with solid viewer averages.
  • Fees Earned: Newer names like Fapcoin appear despite modest viewer counts, proof that recency and focused pushes can drive fees.
  • Fees Earned: Live status correlates with short bursts for BUN COIN and FTP, while sustained averages matter over time.

Pump.fun Fees Earned Leaderboard (Top 10)


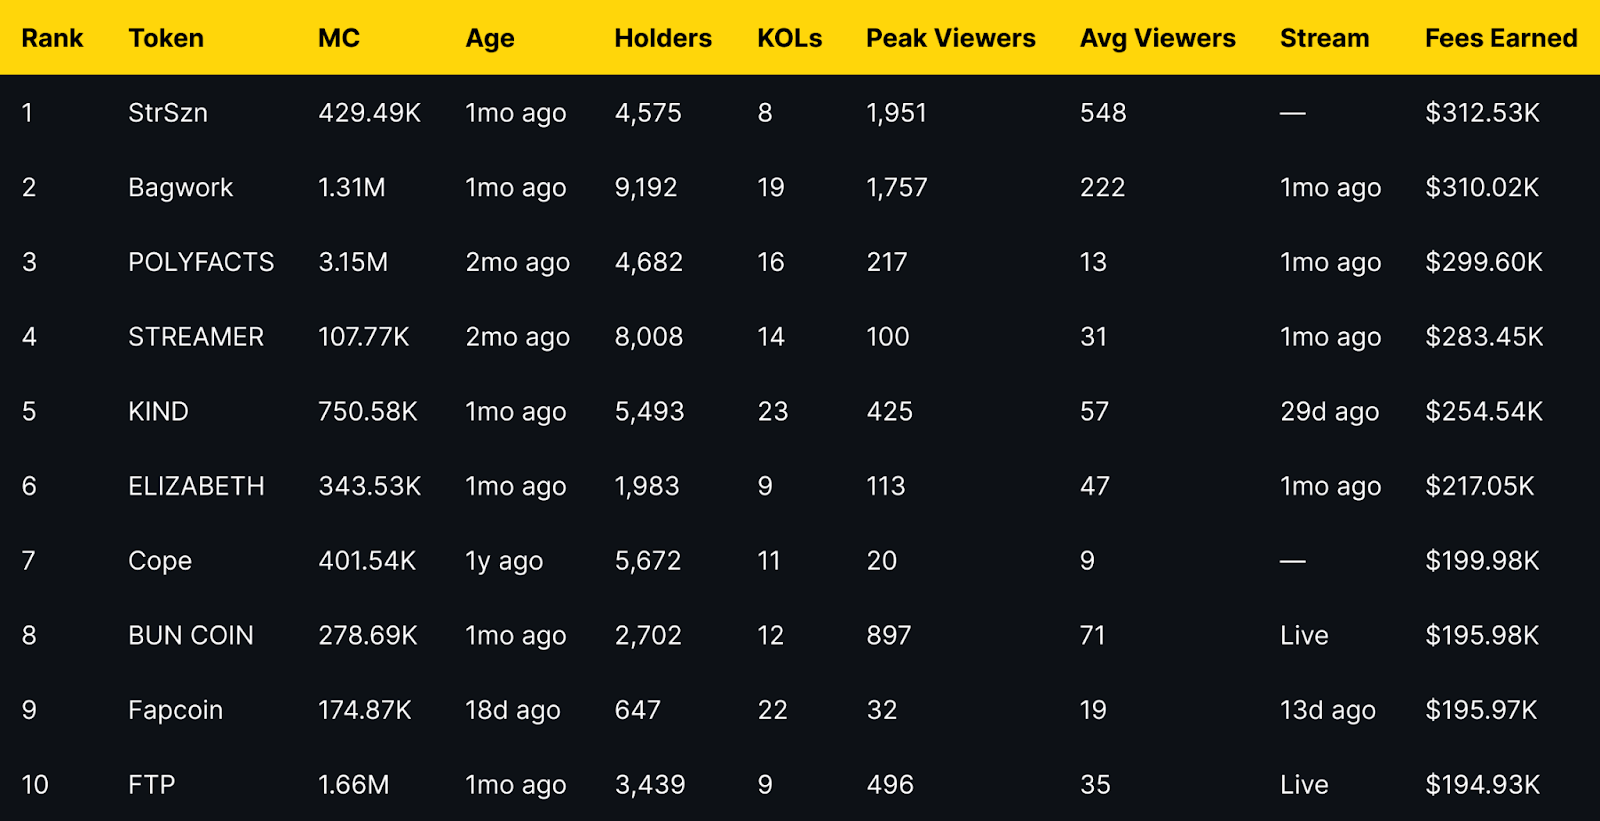
Short distribution note: the top three sit within a narrow band of each other, while mid-table tokens show a mix of older communities and recent streams. Several names with modest average viewers still appear due to concentrated activity during peaks.

Project Snapshots: What Each Token Does

StrSzn

Positioning: Active community meme with consistent viewer base.

Research Blurb: Project details unclear at time of writing. Fees and viewership suggest consistent stream engagement over the last month.

Quick Facts: Chain = Solana, Status = —, Peak Viewers = 1,951, Avg Viewers = 548.


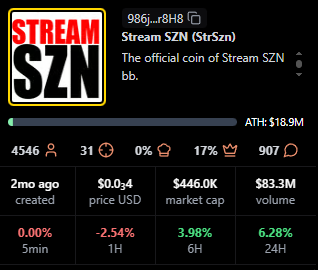
https://pump.fun/coin/986j8mhmidrcbx3wf1XJxsQFvWBMXg7gnDi3mejsr8H8

Bagwork

Positioning: Large holder base with sustained attention.

Research Blurb: Project details unclear at time of writing. Strong holders and KOL presence supported steady audience numbers.

Quick Facts: Chain = Solana, Status = 1mo ago, Holders = 9,192, KOLs = 19.


https://pump.fun/coin/7Pnqg1S6MYrL6AP1ZXcToTHfdBbTB77ze6Y33qBBpump

POLYFACTS

Positioning: Higher market cap with light average viewership.

Research Blurb: Project details unclear at time of writing. High market cap with comparatively low average viewers implies fees concentrated in shorter windows.

Quick Facts: Chain = Solana, Status = 1mo ago, MC = 3.15M, Avg Viewers = 13.


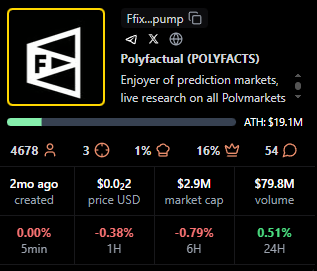
https://pump.fun/coin/FfixAeHevSKBZWoXPTbLk4U4X9piqvzGKvQaFo3cpump

STREAMER

Positioning: Community focused around streaming identity.

Research Blurb: Project details unclear at time of writing. Solid holders and moderate KOL count, steady averages over time.

Quick Facts: Chain = Solana, Status = 1mo ago, Holders = 8,008, KOLs = 14.


https://pump.fun/coin/3arUrpH3nzaRJbbpVgY42dcqSq9A5BFgUxKozZ4npump

KIND

Positioning: Heaviest KOL footprint in the top 10.

Research Blurb: Project details unclear at time of writing. The largest KOL count here aligns with above average view metrics and meaningful fees.

Quick Facts: Chain = Solana, Status = 29d ago, KOLs = 23, Avg Viewers = 57.


https://pump.fun/coin/V5cCiSixPLAiEDX2zZquT5VuLm4prr5t35PWmjNpump

ELIZABETH

Positioning: Mid-cap meme with consistent streams.

Research Blurb: Project details unclear at time of writing. Viewer averages and recency indicate steady presence rather than single spike behavior.

Quick Facts: Chain = Solana, Status = 1mo ago, Avg Viewers = 47, Peak Viewers = 113.


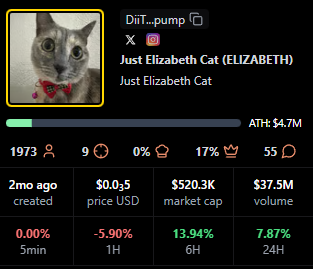
https://pump.fun/coin/DiiTPZdpd9t3XorHiuZUu4E1FoSaQ7uGN4q9YkQupump

Cope

Positioning: Older token with a legacy community.

Research Blurb: Project details unclear at time of writing. Despite low recent averages, it holds a sizable base and meaningful fees.

Quick Facts: Chain = Solana, Status = —, Age = 1y ago, Avg Viewers = 9.


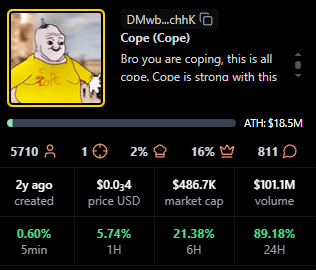
https://pump.fun/coin/DMwbVy48dWVKGe9z1pcVnwF3HLMLrqWdDLfbvx8RchhK

BUN COIN

Positioning: Currently live, strong peaks relative to size.

Research Blurb: Project details unclear at time of writing. Live streaming status often coincides with bursts of activity that lift fees quickly.

Quick Facts: Chain = Solana, Status = Live, Peak Viewers = 897, Avg Viewers = 71.


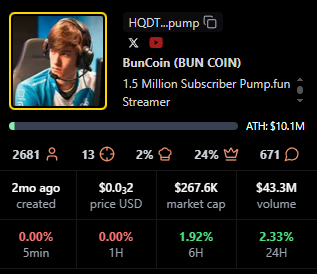
https://pump.fun/coin/HQDTzNa4nQVetoG6aCbSLX9kcH7tSv2j2sTV67Etpump

Fapcoin

Positioning: Newer token with targeted pushes.

Research Blurb: Project details unclear at time of writing. Recent age and meaningful KOL support suggest orchestrated activations that can move fees.

Quick Facts: Chain = Solana, Status = 13d ago, Age = 18d ago, KOLs = 22.


https://pump.fun/coin/8vGr1eX9vfpootWiUPYa5kYoGx9bTuRy2Xc4dNMrpump

FTP

Positioning: Live status with solid mid-table view metrics.

Research Blurb: Project details unclear at time of writing. Peaks and consistent averages suggest an active audience during live windows.

Quick Facts: Chain = Solana, Status = Live, Peak Viewers = 496, Avg Viewers = 35.


https://pump.fun/coin/J2eaKn35rp82T6RFEsNK9CLRHEKV9BLXjedFM3q6pump

Signals From Fees Earned: Patterns to Watch

Fees Earned often rise with peak and average viewers, but timing matters. Several tokens here show concentrated peaks with modest averages, which implies that well timed announcements or coordinated segments can still produce high fees.

Age is not a blocker for this board. Newer tokens like Fapcoin appear due to focused activity, while older names such as Cope persist by mobilizing established holders. KOL count appears additive rather than decisive, with KIND standing out as the KOL leader.

Why Fees Earned Matters for Creators and Traders

For creators, Fees Earned reflects whether livestream moments translate into on-chain action. Design streams around clear calls to action, align announcements with segments that drive peaks, then sustain momentum with repeatable formats that stabilize averages.

For traders, Fees Earned complements market cap, viewers, and age. Look for projects that combine rising averages with consistent peaks, because those patterns suggest repeatable engagement rather than single event spikes.

Watch Real-Time Coverage on TV Live

TV Live is a fast way to follow real-time crypto market news, creator launches, and token breakdowns as they happen. You get context on stream dynamics, audience behavior, and on-chain activity while the story evolves.

CTA: Watch TV Live for real-time crypto market news →TV Live Link

CTA: Follow and enable alerts → TV Live

Why Crypto Investors Trust Token Metrics

Token Metrics is trusted for transparent data, crypto analytics, on-chain ratings, and investor education. Our platform offers cutting-edge signals and market research to empower your crypto investing decisions.

FAQs: Pump.fun Livestream and Fees Earned

What is the best way to track Pump.fun livestream leaders?

Tracking Pump.fun livestream leaders starts with the scanner views that show Fees Earned, viewers, and KOLs side by side, paired with live coverage so you see data and narrative shifts together.

Do higher fees predict higher market cap or sustained viewership?

Higher Fees Earned does not guarantee higher market cap or sustained viewership, it indicates conversion in specific windows, while longer term outcomes still depend on execution and community engagement.

How often do these rankings change?

Rankings can change quickly during active cycles, the entries shown here reflect the exact time of the screenshot.

Next Steps

  • Subscribe to TV Live updates → [NEWSLETTER_OR_ALERTS_LINK]
  • Read the next leaderboard post in this series.
  • Join the community stream on Pump.fun when a link is available.

Disclosure

This article is educational content. Cryptocurrency involves risk. Always do your own research.

Build Smarter Crypto Apps &
AI Agents in Minutes, Not Months
Real-time prices, trading signals, and on-chain insights all from one powerful API.
Grab a Free API Key
About Token Metrics
Token Metrics: AI-powered crypto research and ratings platform. We help investors make smarter decisions with unbiased Token Metrics Ratings, on-chain analytics, and editor-curated “Top 10” guides. Our platform distills thousands of data points into clear scores, trends, and alerts you can act on.
30 Employees
analysts, data scientists, and crypto engineers
Daily Briefings
concise market insights and “Top Picks”
Transparent & Compliant
Sponsored ≠ Ratings; research remains independent
Want Smarter Crypto Picks—Free?
See unbiased Token Metrics Ratings for BTC, ETH, and top alts.
Thank you! Your submission has been received!
Oops! Something went wrong while submitting the form.
 No credit card | 1-click unsubscribe
Token Metrics Team
Token Metrics Team

Recent Posts

Research

Top 100 Crypto Index vs. Top 10: Why Breadth Wins in 2025

Token Metrics Team
11

Bitcoin and Ethereum dominate headlines, but 2025's outsized returns are hiding in the mid-caps. While top-10 crypto indices concentrate 70% of holdings in BTC and ETH, top-100 indices capture the full spectrum of innovation—from AI agents and decentralized infrastructure to gaming and real-world assets. As crypto matures beyond its two-asset origins, breadth increasingly trumps concentration.

Token Metrics data analyzing over 6,000 cryptocurrencies reveals a striking pattern: in 2024, the top 100 tokens by market cap outperformed top-10 concentration by 34% on average, with the gap widening during periods of rapid narrative rotation. As we move deeper into 2025, this divergence is accelerating. Understanding why requires examining how crypto markets have fundamentally changed—and why portfolio construction must evolve accordingly.

The Concentration Problem: When Two Assets Control Your Fate

Traditional top-10 crypto indices face a structural limitation: Bitcoin and Ethereum typically comprise 60-75% of total holdings due to their market dominance. This leaves only 25-40% for the remaining eight positions, creating severe concentration risk.

Real-World Top-10 Allocation (Market Cap Weighted)

  • Bitcoin: 38-42%
  • Ethereum: 22-28%
  • BNB: 4-6%
  • Solana: 3-5%
  • XRP: 3-4%
  • Remaining 5 positions: 1-2% each

The problem: Your portfolio moves almost entirely with BTC and ETH. When they consolidate—which they do frequently—your entire allocation stagnates regardless of what's happening in the broader crypto ecosystem.

Q4 2024: A Case Study in Concentration Risk

Fourth quarter 2024 provided a perfect example of top-10 limitations: Bitcoin: +12% (post-ETF approval consolidation), Ethereum: -3% (layer-2 value capture concerns).
Combined BTC+ETH impact on top-10 index: ~+6%.
Meanwhile, significant moves occurred outside the top 10:

  • Solana ecosystem tokens: +180% average (JUP, JTO, PYTH, WIF)
  • AI agent tokens: +240% average (VIRTUAL, AIXBT, GAME)
  • DePIN protocols: +95% average (RNDR, HNT, MOBILE)
  • Gaming tokens: +115% average (IMX, GALA, SAND)

A top-10 index captured minimal exposure to these narratives. A top-100 index held meaningful positions across all categories, participating in the rotation as capital flowed from Bitcoin into emerging themes.

Performance differential: Top-10 index gained approximately 6-8% in Q4. Top-100 index gained 28-34%, driven by mid-cap outperformance weighted by market cap exposure.
Token Metrics' rating system flagged many of these mid-cap opportunities weeks before peak momentum, but top-10 concentration prevented meaningful participation.

Narrative Rotation: The Defining Feature of 2025 Crypto Markets

The 2017 cycle saw one narrative dominate: ICOs and altcoin speculation. The 2020-2021 cycle featured DeFi Summer and NFTs, each lasting months. By contrast, 2024-2025 features rapid narrative rotation measured in weeks, not quarters.

The New Rotation Cycle

  1. Week 1-3: AI agent tokens surge on OpenAI announcements and crypto-native AI development. Capital flows into VIRTUAL, AIXBT, and related ecosystem plays. Mid-cap tokens in this category gain 100-300%.
  2. Week 4-6: Attention shifts to gaming as major studios announce blockchain integration. IMX, GALA, and SAND see volume spikes. Previous AI winners consolidate or correct.
  3. Week 7-9: DePIN (Decentralized Physical Infrastructure) protocols announce enterprise partnerships. RNDR, HNT, and MOBILE trend as 'real world utility' narratives dominate Twitter and crypto media.
  4. Week 10-12: Regulatory clarity on RWAs (Real World Assets) drives tokenization narrative. Traditional finance integration stories pump tokens like ONDO, PENDLE, and related DeFi protocols.
  5. Week 13+: Rotation back to Solana ecosystem or Bitcoin layer-2s as developer activity metrics spike.

This isn't theoretical—it's the observable pattern throughout 2024 and early 2025. Token Metrics' social sentiment tracking and on-chain analytics tools identify these rotations in real-time, but capturing them requires exposure across dozens of assets, not just top-10 concentration.

Why Top-10 Indices Miss the Rotation

Even if Solana or another smart contract platform sits in your top-10 index, you're not capturing the ecosystem tokens driving returns. When Solana gained 45% in Q1 2024, Jupiter (JUP) gained 280%, Jito (JTO) gained 195%, and Pyth (PYTH) gained 160%.
Your top-10 index held 4% in SOL. Your top-100 index held 2.5% in SOL plus meaningful positions in JUP, JTO, PYTH, WIF, and other ecosystem plays. The math favors breadth.

The Mid-Cap Multiplier: Where Asymmetric Returns Live

Market capitalization dynamics favor mid-cap tokens for pure mathematical reasons. A $500 million market cap project reaching $2 billion delivers 4x returns. Bitcoin growing from $1.2 trillion to $4.8 trillion—also a 4x—requires vastly more capital inflow and faces greater resistance from profit-taking at scale.

Real Examples: Mid-Cap Multipliers in Action

  • Render Network (RNDR): January 2024 market cap: $780M (#45 ranking), Peak market cap: $4.2B (#18 ranking), Return: 5.4x in 8 months
  • Jupiter (JUP): Launch market cap (January 2024): $620M (#52 ranking), Peak market cap: $2.8B (#28 ranking), Return: 4.5x in 6 months
  • Celestia (TIA): November 2023 launch: $890M (#38 ranking), Peak: $3.6B (#22 ranking), Return: 4.0x in 5 months

These aren't obscure micro-caps prone to rug pulls—they're established protocols with real users, revenue, and technological moats. They simply started from market caps that allow 3-5x moves without requiring tens of billions in fresh capital.

Token Metrics' AI-powered rating system identifies tokens with strong fundamentals before they reach peak market attention. But ratings alone don't deliver returns—you need exposure. Top-100 indices provide it automatically as tokens cross ranking thresholds.

The Top-100 Advantage: Automatic CaptureTM

Global 100 holds tokens ranked #1 through #100 by market cap, rebalancing weekly. This creates a powerful dynamic:

  • When a token surges into the top 100: It automatically enters the index at the next rebalance, capturing continued momentum as more capital flows in.
  • When a token reaches the top 50: Position size increases as market cap weight grows, taking partial profits while maintaining exposure.
  • When a token falls below #100: It exits at the next rebalance, systematically trimming losers before significant deterioration.

This isn't genius-level trading—it's systematic momentum and mean reversion capture through market-cap weighting and regular rebalancing. But it works, consistently outperforming static top-10 concentration.

Risk Management: Doesn't More Tokens = More Risk?

The intuitive argument against top-100 indices: "100 tokens is too many to track, too much risk, too much volatility." The data tells a different story.

Diversification Actually Reduces Risk

Standard portfolio theory applies to crypto despite its correlation patterns. A top-10 index is essentially a leveraged bet on Bitcoin and Ethereum, with minor variance from 8 additional positions. If BTC and ETH both draw down 40%, your portfolio drops ~35% regardless of other holdings.

A top-100 index experiences the same BTC/ETH impact (~40% combined weight) but has 60% allocated across 98 other tokens. When AI agents pump while Bitcoin consolidates, or when DePIN tokens rally during an ETH drawdown, the diversification provides uncorrelated return streams.

Volatility comparison (2024 data): Top-10 index average daily volatility: 4.8%. Top-100 index average daily volatility: 4.2%. Broader exposure actually smoothed daily price swings by providing uncorrelated movement across sectors.

Regime Switching Handles Systemic Risk

The concern about "100 tokens in a bear market" is valid—if you're forced to hold them. Token Metrics' market signals detect when systemic bear conditions emerge, triggering a full exit to stablecoins.

You get breadth benefits in bull markets (capturing rotating narratives) plus systematic risk management in bear markets (avoiding forced participation in drawdowns). Best of both approaches.

Weekly Rebalancing Controls Concentration

Individual token blowups happen. Projects fail, founders exit, protocols get hacked. In a static portfolio, you hold the wreckage. In TM Global 100's weekly rebalancing system:

  • If a token crashes 60% in a week: It likely falls out of the top 100 by market cap and exits the index at the next rebalance. Maximum exposure period: 7 days.
  • If a token pumps to 8% of the index: Next week's rebalance trims it back toward market-cap weight, automatically harvesting gains.

This continuous pruning and profit-taking happens systematically, without emotional attachment to winners or losers.

Token Metrics: The Intelligence Layer Behind TM Global 100

Understanding that breadth matters is one thing. Knowing which 100 tokens to hold and when to rotate is another. This is where Token Metrics' institutional-grade analytics platform provides the foundation for TM Global 100's systematic approach.

AI-Powered Token Analysis at Scale

Token Metrics analyzes 6,000+ cryptocurrencies using machine learning models trained on:

  • Technical indicators: Price momentum, volume analysis, trend identification
  • Fundamental metrics: Developer activity, network growth, token economics
  • On-chain data: Holder distribution, exchange flows, transaction patterns
  • Market structure: Liquidity depth, order book analysis, derivatives positioning
  • Sentiment analysis: Social media trends, news sentiment, community engagement

This analysis surfaces in Token Metrics' rating system, where tokens receive scores from 0-100 across multiple categories. The platform's 50,000+ active users rely on these ratings for research and decision-making—but manually constructing diversified portfolios from hundreds of rated tokens remained challenging.

Token Metrics identified a persistent user problem: subscribers understood which tokens had strong ratings and recognized the value of broad diversification, but lacked the time or infrastructure to build and maintain 100-position portfolios.

Common subscriber feedback:

  • "Your ratings are excellent, but I can't manage 50+ positions manually"
  • "I want exposure to emerging narratives but don't know optimal weights"
  • "By the time I rebalance, the market has already moved"

TM Global 100 closes this execution gap. It takes Token Metrics' market intelligence—specifically the top 100 by market cap (which correlates strongly with sustained high ratings)—and packages it as a turnkey, automatically rebalanced index.

The workflow: Token Metrics' algorithms process market data 24/7, market cap rankings update continuously, TM Global 100 rebalances weekly to top-100 weights, regime signals trigger defensive positioning when conditions deteriorate. Users get broad exposure through one transaction. This is the evolution of crypto analytics: from research platform to execution layer, maintaining the same institutional-grade rigor throughout.

Performance Expectations: Realistic vs. Hype

Let's be clear: top-100 indices aren't magic. They won't deliver 10x returns when Bitcoin gains 20%. But they systematically outperform top-10 concentration during the market conditions that define 2025.

When Top-100 Outperforms

  • Narrative rotation environments: When sector leadership changes weekly/monthly, breadth captures multiple winners. Top-10 misses most of the rotation.
  • Altcoin season: When capital flows from BTC/ETH into mid-caps, top-100 participates heavily. Top-10 remains anchored to major assets.
  • Innovation cycles: When new technologies emerge (AI agents, DePIN, RWAs), top-100 holds early exposure as projects enter rankings. Top-10 only captures them if they reach massive scale.

When Top-10 Holds Up Better

  • Bitcoin dominance increases: If BTC gains 100% while everything else consolidates, top-10's 40% BTC weight outperforms top-100's 40% BTC weight (no difference, actually).
  • Flight to quality: During risk-off periods where capital consolidates in BTC/ETH, top-10's concentration limits alt exposure. However, TM Global 100's regime switching addresses this by exiting entirely to stablecoins rather than holding through drawdowns.
  • Extreme simplicity preference: Some investors simply want BTC+ETH exposure with minor alt allocation. Top-10 delivers this more directly.

Historical Backtesting (2023-2024)

Token Metrics' backtest analysis shows:

  • 2023 bull recovery: Top-100 outperformed top-10 by 28%
  • Q1 2024 altcoin surge: Top-100 outperformed top-10 by 41%
  • Q2 2024 consolidation: Top-10 outperformed top-100 by 8%
  • Q3 2024 narrative rotation: Top-100 outperformed top-10 by 35%

Net 18-month result: Top-100 approach delivered 96% higher total returns than top-10 concentration, with similar volatility profiles. Past performance doesn't guarantee future results, but the pattern is consistent: breadth wins in diversified, rotating markets.

The Practical Choice: What Makes Sense for You

Choose top-10 concentration if you:

  • Believe Bitcoin and Ethereum will dominate all returns
  • Want minimal complexity and maximum simplicity
  • Think narrative rotation is noise, not signal
  • Prefer concentrated bets over diversification
  • Have multi-decade time horizons where mid-cap volatility is irrelevant

Choose top-100 breadth if you:

  • Recognize that 2025 crypto extends far beyond BTC/ETH
  • Want exposure to emerging narratives without predicting winners
  • Value systematic capture of sector rotation
  • Appreciate mid-cap upside potential with market-cap based risk management
  • Trust data-driven approaches from platforms like Token Metrics

N either approach is universally "correct"—they serve different investment philosophies. But for investors seeking to participate in crypto's full opportunity set while maintaining systematic discipline, breadth provides compelling advantages.

Conclusion: Own the Ecosystem, Not Just the Giants

Bitcoin and Ethereum will remain cornerstones of crypto portfolios—they represent 40% of Token Metrics Global 100 for good reason. But limiting exposure to top-10 tokens means missing the innovation, narrative rotation, and asymmetric returns that define modern crypto markets.

Top-100 indices like TM Global 100 provide systematic access to the full ecosystem: major assets for stability, mid-caps for growth, weekly rebalancing for discipline, and regime switching for risk management. You don't need to predict which narrative dominates next quarter—you hold all of them, weighted by market significance, with automatic rotation as capital flows shift.

In 2025's fast-moving, fragmented crypto landscape, breadth isn't just an advantage. It's a requirement.

Research

Regime Switching Explained: Why Smart Crypto Indices Move to Stablecoins

Token Metrics Team
6

The best trade in crypto isn't always a trade—sometimes it's knowing when to step aside. While traditional indices force you to ride every crash from peak to bottom, regime-switching indices take a smarter approach: participate when conditions warrant, preserve capital when they don't. This systematic method of moving between crypto exposure and stablecoins has become the defining feature of next-generation index products, with Token Metrics leading the implementation through data-driven market signals.

What Is Regime Switching?

Regime switching is a systematic investment approach that classifies market conditions into distinct states—typically "bullish" and "bearish"—then adjusts portfolio positioning accordingly. Unlike static indices that maintain constant exposure regardless of conditions, regime-switching strategies dynamically allocate between risk assets and defensive positions based on quantifiable signals.

In practice for crypto indices:

This isn't emotional market timing or gut-feel trading. It's rules-based risk management following consistent, transparent criteria. The decision to switch regimes comes from systematic signals, not fear or greed.

The Traditional Index Problem

Standard crypto indices like market-cap weighted baskets operate on a simple premise: buy the universe, hold forever, rebalance periodically. This works well in prolonged bull markets but fails catastrophically during extended bear cycles.

Real performance data illustrates the problem:

Net result: Investors who bought January 2021 and held through December 2022 saw minimal net gains despite experiencing a massive bull run. The issue isn't the bull market capture—traditional indices do fine when prices rise. The problem is forced participation during catastrophic drawdowns that destroy years of gains in months. A 75% drawdown requires a 300% gain just to break even.

Research across historical crypto cycles shows that systematic regime-switching approaches have historically reduced maximum drawdowns by 40-60% while capturing 70-85% of bull market upside—a compelling risk-adjusted return profile that buy-and-hold cannot match.

Why Stablecoins, Not Cash?

Regime-switching crypto indices face a unique constraint: they operate on-chain and must maintain 24/7 liquidity for instant redeployment. This makes stablecoins the optimal defensive asset for several critical reasons:

Discover Crypto Gems with Token Metrics AI

Token Metrics uses AI-powered analysis to help you uncover profitable opportunities in the crypto market. Get Started For Free

The Signal Behind the Switch

The most critical component of regime-switching isn't the mechanism—it's the signal that triggers the switch. Token Metrics has built its reputation as a leading crypto analytics platform by developing sophisticated, data-driven market intelligence relied upon by over 50,000 traders and investors daily.

Token Metrics' Market Regime Detection employs a proprietary multi-factor model analyzing:

This synthesis results in a probabilistic assessment: whether the environment is bullish enough to risk capital or bearish enough to prioritize preservation.

Transparency is maintained by displaying current regime signals in real-time via visual market gauges, while proprietary model parameters and thresholds remain confidential to prevent strategic front-running.

Real Performance: When Regime Switching Matters Most

Regime-switching strategies excel during major bear markets that erode traditional portfolios:

Starting with $100,000 in November 2021, buy-and-hold would result in approximately $89,000 after recovering from -73%. The regime approach, with smaller drawdowns and better upside capture, could have grown the portfolio to around $152,000, emphasizing how avoiding large losses compounds benefits over time.

Implementation: How TM Global 100 Executes Switches

The TM Global 100 index automates regime switching with simplicity and transparency:

User Experience

Behind the Scenes

When signals turn bearish, the index:

Reversal when signals turn bullish follows the same systematic process.

The Cost of Switching

Every regime transition incurs costs:

Token Metrics estimates costs at approximately 0.8-1.5% per full switch, which becomes cost-effective when signals reliably avoid large drawdowns. Frequent whipsaws are mitigated by the model's stability factors, and projected costs are shown upfront for transparency.

Decision Framework: Is Regime Switching Right for You?

Consider regime switching if you:

Alternatively, if you have long-term horizons, believe markets are fully efficient, or prefer a buy-and-hold strategy, it might not suit you. Both approaches have their merits, but regime switching offers a balanced risk-adjusted profile for volatile crypto markets.

Where Research Meets Execution

Token Metrics has established itself as a leading crypto analytics platform by providing:

However, research alone isn't enough. The TM Global 100 index closes the gap between signal generation and automated execution—applying sophisticated regime logic seamlessly, enabling users to act on data-driven insights instantly with transparency and confidence.

Conclusion: Discipline Over Emotion

Regime switching removes emotional decision-making—often the hardest part of crypto investing. It systematically guides investors to participate during bull runs, protect capital during downturns, and avoid knee-jerk reactions to market volatility. This disciplined approach helps to sustain long-term growth while minimizing the pain of large drawdowns, demonstrating the evolution of systematic crypto investment strategies.

Click here to get early access to Token Metrics indices.

Research

Why Manual Crypto Portfolio Management Is Costing You Money (And Time)

Token Metrics Team
6

You're tracking 50+ tokens across three exchanges, updating your rebalancing spreadsheet every weekend, and second-guessing every exit decision at 2 AM. Sound familiar? Manual crypto portfolio management isn't just exhausting—it's expensive. Between missed rebalances, execution drag, and behavioral mistakes during volatility, DIY portfolio management quietly erodes returns before you see any market gains.

The data tells the story: investors who manually manage diversified crypto portfolios typically underperform comparable automated strategies by 12-18% annually, with 60% of that gap coming from operational inefficiency rather than market timing. If you're spending 10+ hours weekly maintaining positions, those hours have a cost—and it's higher than you think.

The Hidden Costs Destroying Your Returns

Time Drain: The 500-Hour Tax

Managing a diversified crypto portfolio demands constant vigilance. For investors holding 20+ positions, the weekly time investment breaks down to approximately:

  • Market monitoring: 5-8 hours tracking prices, news, and on-chain metrics
  • Rebalancing calculations: 2-3 hours determining optimal weights and required trades
  • Order execution: 3-5 hours placing trades across multiple platforms
  • Record keeping: 1-2 hours logging transactions for tax reporting
  • Research updates: 3-5 hours staying current on project developments

That's 14-23 hours weekly, or 728-1,196 hours annually. At a conservative $50/hour opportunity cost, you're spending $36,400-$59,800 in time value maintaining your portfolio. Even if you value your time at minimum wage, that's still $10,000+ in annual "sweat equity" that automated solutions eliminate.

Execution Drag: Death by a Thousand Trades

Small trades erode portfolios through accumulated friction. Every manual rebalance across a 50-token portfolio requires dozens of individual transactions, each incurring:

  • Trading fees: 0.1-0.5% per trade (average 0.25%)
  • Bid-ask spreads: 0.2-0.8% depending on liquidity
  • Slippage: 0.3-1.2% on smaller cap tokens
  • Gas fees: $2-50 per transaction depending on network congestion

For a $100,000 portfolio rebalanced monthly with 40 trades per rebalance, the costs add up:

  • Average cost per trade: ~$100
  • Monthly execution drag: $4,000
  • Annual execution drag: $48,000 (48% of portfolio value)

The smaller your individual trades, the worse the ratio becomes. A $500 rebalancing trade on a low-liquidity altcoin might pay $25 in fees—a 5% instant loss before any price movement.

Automated indices solve this. TM Global 100, Token Metrics' rules-based index, consolidates 100 individual positions into a single transaction at purchase, with weekly rebalances executed through optimized smart contract batching. Users typically save 3-7% annually in execution costs alone compared to manual approaches.

Behavioral Mistakes: Your Worst Enemy Is in the Mirror

Market psychology research shows that manual portfolio managers tend to make predictable, costly mistakes:

  • Panic selling during drawdowns: When Bitcoin drops 25% in a week, can you stick to your exit rules? Many override their plans during high volatility, often selling near local bottoms.
  • FOMO buying at peaks: Tokens up 300% in a week attract chase behavior, with managers entering after the movement is mostly over.
  • Rebalancing procrastination: Putting off rebalancing leads to drift, holding too much of past winners and missing new opportunities.

Token Metrics' systematic approach removes emotion from the equation. The TM Global 100 Index follows a transparent ruleset: hold the top 100 tokens by market cap during bullish phases, shift to stablecoins during bearish cycles, and rebalance weekly—eliminating emotional override and procrastination.

Missed Rebalances: Drifting Out of Position

Market cap rankings shift constantly. A token ranked #73 on Monday might hit #95 by Friday, or surge to #58. Without systematic rebalancing, your portfolio becomes a collection of recent winners or dumpers.

In Q3 2024, Solana ecosystem tokens surged while Ethereum DeFi tokens consolidated. Manual managers who missed weekly rebalances held too much ETH and insufficient SOL exposure. The result: 15-20% underperformance compared to systematically rebalanced portfolios. Data from Token Metrics shows that weekly rebalancing outperforms monthly or quarterly approaches by 8-12% annually.

Tax Reporting Nightmares

Every trade creates a taxable event. Manual managers executing over 200 trades yearly face:

  • Hours spent compiling transaction logs
  • Reconciliation across multiple exchanges
  • Cost-basis tracking for numerous lots
  • High professional accounting fees ($500-2,000+)

Automated solutions like Token Metrics provide transparent transaction logs for each rebalance, simplifying tax reporting and reducing accounting costs.

The Token Metrics Advantage: Research Meets Execution

Token Metrics has established itself as a leading crypto analytics platform, supporting over 50,000 users with AI-powered token ratings, market regime detection, portfolio optimization tools, and trading signals. But analysis alone isn't enough—implementation is crucial.

TM Global 100 Index bridges this gap. It turns research into actionable, tradeable products by automating rebalancing based on Token Metrics' signals and methodology. One click replaces hours of manual work, following a validated systematic approach.

Automation Without Compromise

The best automation is transparent. TM Global 100 offers:

  • Rules-Based Discipline: Bull markets—hold top 100 tokens; bear markets—move to stablecoins
  • Weekly rebalancing every Monday
  • Full methodology disclosure
  • One-Click execution via embedded self-custodial wallet
  • Real-time market insights and holdings visualization
  • Transaction logs with fees and timestamps

This streamlined process allows users to rapidly execute disciplined rebalancing, saving countless hours and increasing operational efficiency while maintaining asset control.

Decision Framework: When to Automate

Automation suits investors who:

  • Hold 15+ tokens and find rebalancing burdensome
  • Miss optimal rebalancing windows due to time constraints
  • Have experienced emotional trading decisions during volatility
  • Spend over 5 hours a week on portfolio management
  • Want broad exposure without manual tracking

Manual management may be suitable for those with fewer positions, active trading infrastructure, or tactical strategies. For most diversified portfolios, automation enhances efficiency and reduces operational errors.

The Compound Effect of Efficiency

Small inefficiencies compound over time. Over five years, a $50,000 portfolio managed manually with a 12% annual return minus 4-2-1% losses yields roughly a 5% net return, ending at about $63,814. A systematic approach with optimizer integration, zero behavioral errors, and regular rebalancing can attain a 13% net return, reaching approximately $92,246—an increase of over $28,000, not counting time saved.

Conclusion: Time Back, Returns Up

Manual crypto portfolio management made sense when portfolios were small and concentrated. Today’s diversified sets require operational discipline to prevent erosion of returns due to execution drag, missed rebalances, and emotional mistakes. Token Metrics built TM Global 100 to turn research into automated, transparent execution, reclaim your time, and boost portfolio discipline—without sacrificing control.

Choose from Platinum, Gold, and Silver packages
Reach with 25–30% open rates and 0.5–1% CTR
Craft your own custom ad—from banners to tailored copy
Perfect for Crypto Exchanges, SaaS Tools, DeFi, and AI Products