


Top AMM Concentrated Crypto Liquidity Managers (2025)
%201.svg)
%201.svg)


Who this guide is for: DeFi liquidity providers seeking automated management of concentrated liquidity positions on AMMs like Uniswap v3, v4, and other CLAMMs (Concentrated Liquidity Automated Market Makers).
Top three picks:
- Gamma Strategies — Best for multi-chain automated vault strategies with proven track record
- Arrakis Finance — Best for institutional-grade liquidity management and token launch support
- Steer Protocol — Best for off-chain compute and cross-chain strategy deployment
Key caveat: Concentrated liquidity managers cannot eliminate impermanent loss; they optimize range management to maximize fee generation, but market volatility can still result in divergence loss. Always verify supported chains and fee structures before depositing.
Introduction: Why AMM Concentrated Liquidity Managers Matter in November 2025
Concentrated liquidity has transformed DeFi capital efficiency since Uniswap v3's 2021 launch, allowing liquidity providers to concentrate capital within specific price ranges for higher fee generation. However, managing these positions requires active monitoring, frequent rebalancing, and sophisticated strategies to remain in-range and profitable—a challenge for most LPs.
AMM concentrated liquidity managers are protocols that automate the complex task of managing concentrated liquidity positions across decentralized exchanges. These platforms use algorithmic strategies to rebalance ranges, compound fees, and optimize capital deployment, transforming concentrated liquidity from an active management burden into a passive income opportunity.
With Uniswap v4's January 2025 launch introducing hooks and new customization capabilities, the concentrated liquidity management landscape has expanded dramatically. LPs now need solutions that can navigate multiple AMMs, chains, and strategy types while maximizing returns and minimizing risks like impermanent loss and out-of-range periods.
This guide evaluates the leading concentrated liquidity managers serving retail LPs, DAOs, and protocols in 2025, helping you select platforms that align with your risk tolerance, capital requirements, and yield objectives.
How We Picked (Methodology & Scoring)
We evaluated 20+ concentrated liquidity management platforms and selected the top 10 based on weighted criteria:
- Liquidity Under Management — 30%: Total value locked (TVL) and managed positions across chains
- Security & Track Record — 25%: Audit history, operational history, security incidents
- Strategy Diversity — 15%: Range of automated strategies and customization options
- Chain & Protocol Coverage — 15%: Supported blockchains and DEX integrations
- Fees & Transparency — 10%: Performance fees, withdrawal fees, and cost clarity
- UX & Accessibility — 5%: Interface quality, documentation, and ease of use
Data sources: Official protocol documentation, pricing pages, security audit reports, blockchain explorers, and TVL data from DefiLlama (cross-checked only; not linked in article body).
Last updated: November 2025
Best AMM Concentrated Liquidity Managers in November 2025 (Comparison Table)
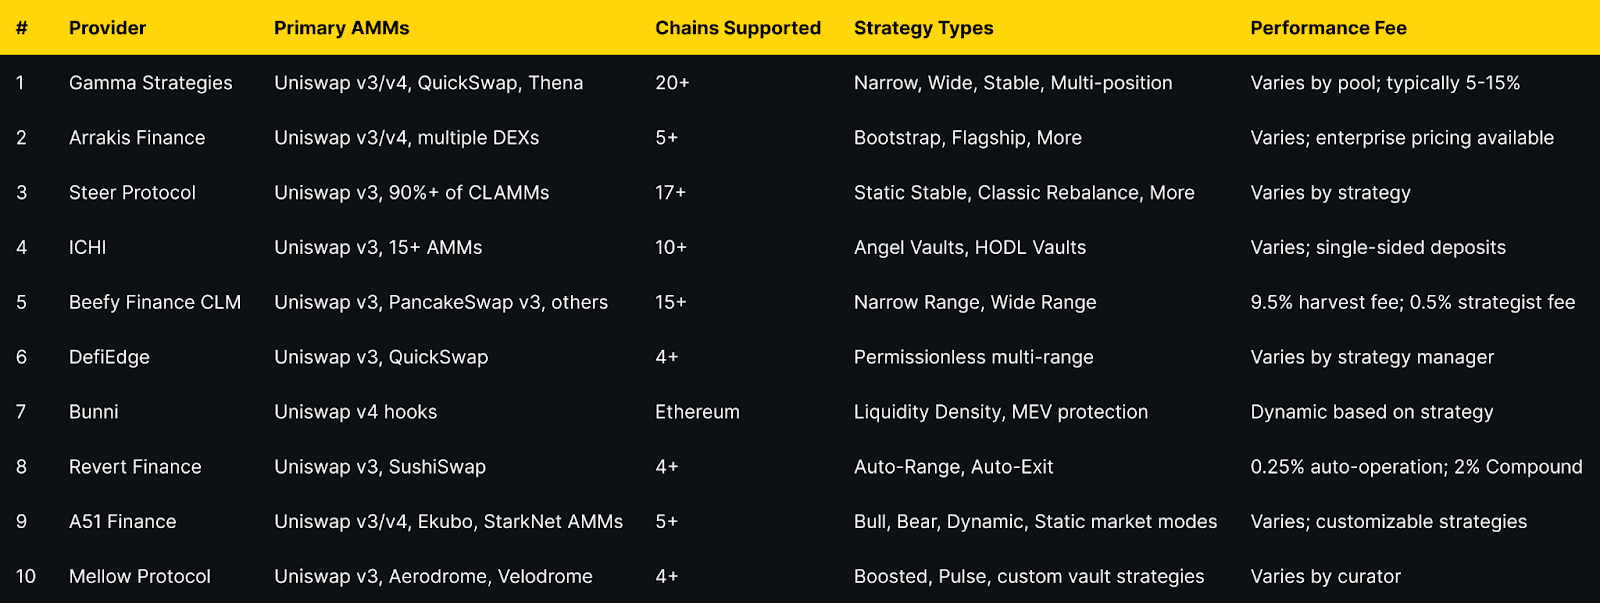
Top 10 AMM Concentrated Liquidity Managers in November 2025
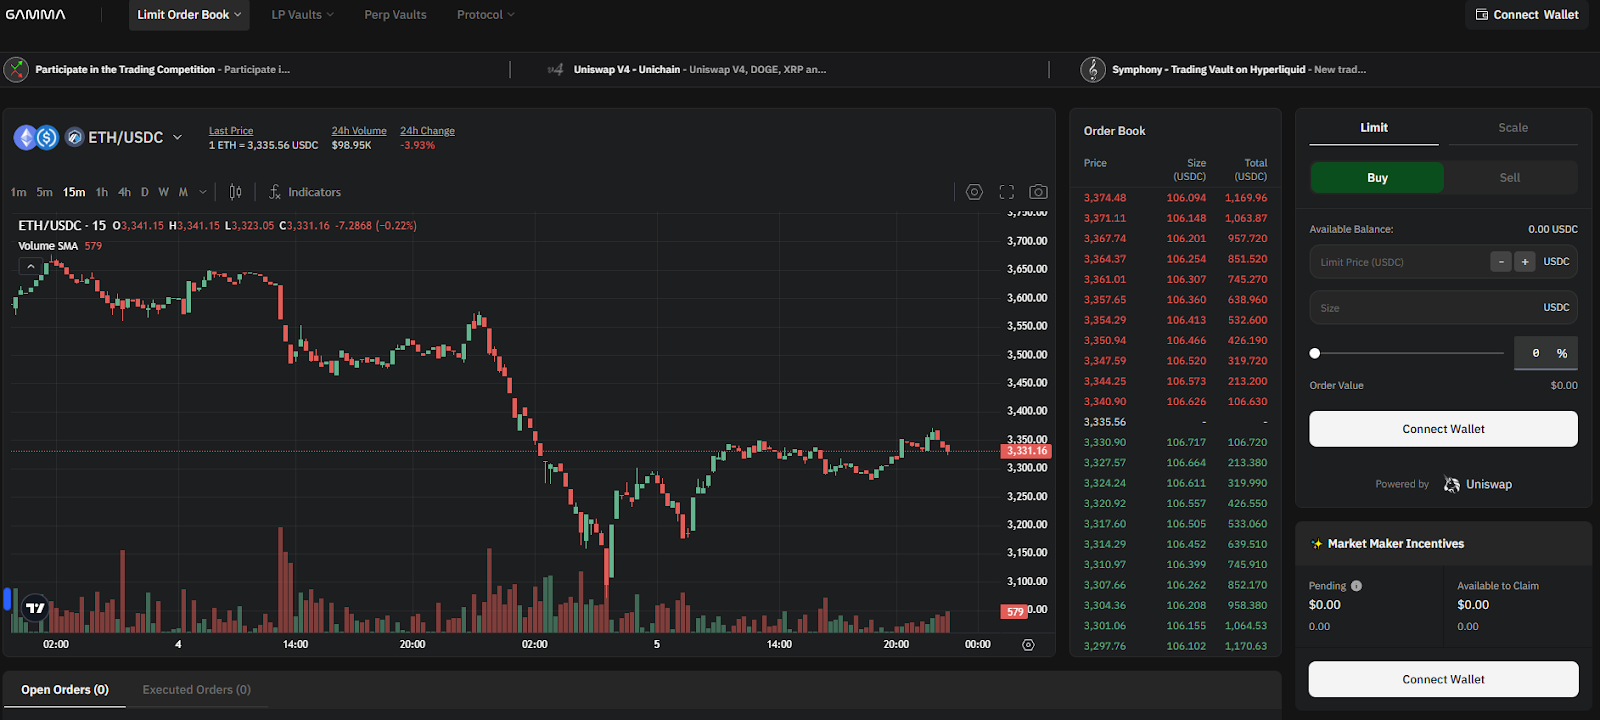
1. Gamma Strategies — Best for Multi-Chain Automated Vaults
Why Use It
Gamma Strategies operates as the most established concentrated liquidity manager with over four years of production history since March 2021. Their Hypervisor vault system automatically rebalances positions, compounds fees, and manages ranges across 20+ blockchains and multiple AMM protocols. Gamma's non-custodial approach means LPs retain control while benefiting from algorithmic management that maximizes capital efficiency and fee generation.
Best For
- Multi-chain liquidity providers seeking diversified exposure
- DAOs and protocols requiring active liquidity management
- LPs wanting automated fee compounding without manual intervention
- Users preferring ERC-20 LP tokens over NFT positions
Notable Features
- Hypervisor smart contracts with automated rebalancing
- Supports dual-position and multi-position strategies (up to 20 positions on Uniswap v4)
- ERC-20 LP tokens for composability in DeFi
- Integration with major DEXs including Uniswap v3/v4, QuickSwap, Thena, Beamswap
- GAMMA token staking for fee-sharing
Consider If: Supported on 20+ chains but fee structures vary by pool; verify specific pool performance fees before depositing. Some pools charge 10-15% of generated fees.
Regions: Global; no geographic restrictions
Alternatives: Arrakis Finance, Steer Protocol
2. Arrakis Finance — Best for Institutional Liquidity Management
Why Use It
Arrakis Finance delivers MEV-aware onchain market making specifically designed for token issuers and institutional liquidity providers. Their Arrakis Pro service offers white-glove liquidity management with strategic templates including Bootstrap for TGE, Flagship for mature projects, and Treasury Diversification for passive accumulation. Arrakis has become the go-to solution for protocols like ether.fi, Euler, and Stargate seeking professional-grade liquidity infrastructure.
Best For
- Token launch teams needing TGE liquidity support
- Protocols managing protocol-owned liquidity (POL)
- Institutional LPs requiring custom strategy execution
- Projects seeking multi-DEX liquidity deployment
Notable Features
- Four strategy templates: Bootstrap, Flagship, Treasury Diversification, Custom
- Multi-DEX support (Uniswap v3/v4, PancakeSwap v3, and others)
- MEV-aware rebalancing algorithms
- Modules for concentrated liquidity across chains
- Enterprise-grade support and customization
Consider If: Primarily targets institutional clients; retail LPs may find Arrakis V1 (older version) more accessible than Arrakis Pro. Performance fees vary and often involve revenue-sharing arrangements.
Fees Notes: Enterprise pricing; contact for specific fee structures
Regions: Global; primarily serves protocols and DAOs
Alternatives: Gamma Strategies, Steer Protocol
3. Steer Protocol — Best for Off-Chain Compute Strategies
Why Use It
Steer Protocol distinguishes itself through decentralized off-chain computation that enables sophisticated strategy execution without on-chain gas overhead. Supporting 17+ chains and over 90% of concentrated liquidity AMMs, Steer provides automated range management using strategies like Elastic Expansion (Bollinger Bands), Moving Volatility Channel (Keltner), and Static Stable for pegged assets. Their infrastructure powers liquidity automation for platforms like QuickSwap, Taiko, and Kinetic.
Best For
- LPs seeking advanced technical analysis-based strategies
- Cross-chain liquidity providers
- Projects requiring custom liquidity shapes and automation
- Users wanting minimal gas costs for strategy execution
Notable Features
- Off-chain compute protocol reducing on-chain execution costs
- Support for TypeScript, Rust, and Go strategy development
- Multiple strategy families: Static Stable, Classic Rebalance, Volatility Channel, Elastic Expansion
- Integration with 90%+ of CLAMMs
- White-label infrastructure for protocols
Consider If: Strategy complexity may require more sophisticated understanding; best for LPs comfortable with advanced AMM concepts.
Fees Notes: Varies by strategy and deployment; network fees apply
Regions: Global; no restrictions
Alternatives: DefiEdge, Gamma Strategies
4. ICHI — Best for Single-Sided Deposits
Why Use It
ICHI's Yield IQ vaults revolutionize concentrated liquidity provision by accepting single-token deposits, eliminating the need for LPs to hold both sides of a trading pair. Using algorithmic strategies that maintain an 80:20 ratio, ICHI enables users to earn concentrated liquidity fees while effectively holding a single asset. Their Angel Vaults create buy-side liquidity that supports price stability for project tokens.
Best For
- LPs wanting single-token exposure without impermanent loss on both sides
- Projects seeking buy-side liquidity support
- Long-term holders wanting to earn yield without selling tokens
- DAOs managing treasury diversification
Notable Features
- Single-sided liquidity deposits (Angel Vaults and HODL Vaults)
- Automated rebalancing with Chainlink Keepers
- 80:20 asset ratio maintenance
- Support for 15+ AMMs across 10+ networks
- Integration with concentrated liquidity incentive programs
Consider If: 80:20 rebalancing means you'll still experience some token ratio changes; not pure single-asset exposure. Best for those comfortable with managed rebalancing.
Fees Notes: Varies by vault; performance fees typically 5-10% of yields
Regions: Global; available on multiple L1s and L2s
Alternatives: DefiEdge, Gamma Strategies
5. Beefy Finance CLM — Best for Yield Optimizer Integration
Why Use It
Beefy's Concentrated Liquidity Manager (CLM) extends their proven auto-compounding infrastructure to concentrated liquidity pools, providing automated range management integrated with Beefy's broader yield optimization ecosystem. Their "Cow Token" system converts non-fungible CL positions into fungible ERC-20 tokens while maximizing capital utilization through strategies that keep positions in-range and fully active.
Best For
- Existing Beefy users expanding into concentrated liquidity
- LPs seeking integrated yield farming and CLM
- Multi-chain passive investors
- Users wanting fungible CL position tokens
Notable Features
- Integration with Beefy's yield optimizer ecosystem
- Supports 15+ chains including BSC, Arbitrum, Polygon, Base, Avalanche
- Narrow and wide range strategies
- ERC-20 "Cow Tokens" for fungible CL positions
- Automatic fee compounding
Consider If: 9.5% harvest fee is higher than some competitors; suitable for long-term holders where compounding benefits outweigh fees.
Fees Notes: 9.5% performance fee on harvest; 0.5% to strategist; variable harvest call fee
Regions: Global; multi-chain support
Alternatives: Gamma Strategies, A51 Finance
6. DefiEdge — Best for Strategy Marketplace
Why Use It
DefiEdge creates a permissionless layer over concentrated liquidity AMMs where strategy managers can deploy custom strategies supporting up to 20 price ranges and built-in limit orders. This marketplace approach allows LPs to select from community-created strategies or deploy their own, providing unprecedented flexibility in concentrated liquidity management.
Best For
- Advanced LPs wanting custom multi-range strategies
- Strategy managers seeking to monetize their expertise
- Users requiring limit order functionality
- Projects needing tailored liquidity deployment
Notable Features
- Support for up to 20 simultaneous price ranges
- Built-in limit order functionality
- Permissionless strategy creation marketplace
- Real-time position monitoring interface
- Automatic integration with incentive protocols like Merkl
Consider If: More complex than single-strategy platforms; requires evaluating individual strategy manager performance.
Fees Notes: Varies by strategy manager; typically 5-15% performance fees
Regions: Global; primarily Ethereum, Polygon, Optimism, Arbitrum
Alternatives: A51 Finance, Gamma Strategies
7. Bunni — Best for Uniswap v4 Innovation
Why Use It
Bunni emerged as the leading Uniswap v4 hook implementation, using programmable Liquidity Density Functions (LDFs) to create custom liquidity shapes within concentrated ranges. Their Shapeshifting feature dynamically adjusts positions, while MEV protection through am-AMM auctions and Surge Fees recaptures value that would otherwise go to arbitrageurs. Bunni also rehypothecates idle capital to Aave and Yearn for additional yield.
Best For
- Early adopters of Uniswap v4 infrastructure
- LPs seeking MEV-protected concentrated liquidity
- Advanced users wanting programmable liquidity shapes
- Projects requiring dynamic fee structures
Notable Features
- Liquidity Density Functions for custom liquidity distribution
- Shapeshifting for dynamic position adjustment
- MEV protection via am-AMM mechanism and dynamic fees
- Rehypothecation to Aave/Yearn for additional yield
- Auto-compounding of fees and rewards
Consider If: Currently Ethereum-focused with Uniswap v4; may expand to other chains. Newer platform compared to established players like Gamma.
Fees Notes: Dynamic fees based on volatility and strategy; typical range 5-20% of yields
Regions: Global; Ethereum mainnet
Alternatives: Gamma Strategies (Uniswap v4 support), Arrakis Finance
8. Revert Finance — Best for Analytics-First Management
Why Use It
Revert Finance combines powerful analytics tools with automated management features, enabling LPs to backtest strategies, analyze top-performing positions, and then deploy automation like Auto-Range (automatic rebalancing) and Auto-Exit (stop-loss protection). Their Initiator tool allows LPs to simulate historical performance before committing capital, making Revert ideal for data-driven liquidity providers.
Best For
- Analytical LPs wanting to backtest before deploying
- Users seeking automated stop-loss protection (Auto-Exit)
- LPs wanting to copy successful positions
- Investors prioritizing transparency and performance tracking
Notable Features
- Comprehensive analytics suite with backtesting
- Auto-Range for automated rebalancing
- Auto-Exit for stop-loss automation
- Position management tools (add/withdraw/claim)
- Top Positions discovery for copying successful strategies
Consider If: Automation features (Auto-Range/Exit) charge 0.25% per operation; may not trigger if gas costs exceed fees. Best for larger positions.
Fees Notes: 2% auto-compound fee; 0.25% per auto-operation (Range/Exit); 0.65% swap fee
Regions: Global; Ethereum, Polygon, Optimism, Arbitrum
Alternatives: Gamma Strategies, Steer Protocol
9. A51 Finance — Best for Strategy Customization
Why Use It
A51 Finance (formerly Unipilot) offers autonomous liquidity provisioning with highly customizable parameters including market modes (Bull, Bear, Dynamic, Static), rebasing strategies, and liquidity distribution patterns. Supporting Uniswap v3/v4 and expanding to StarkNet, A51 empowers LPs to design advanced strategies using hooks while addressing loss-versus-rebalancing (LVR) through sophisticated hedging mechanisms.
Best For
- Advanced LPs wanting full strategy customization
- Multi-chain liquidity providers (EVM + StarkNet)
- Users requiring market-mode specific strategies
- Projects needing flexible liquidity allocation
Notable Features
- Market mode selection: Bull, Bear, Dynamic, Static
- Customizable rebasing and exit preferences
- Multiple liquidity distribution options (exponential, flat, single-tick)
- Hedging through borrowing and options
- Support for Uniswap v4 hooks
Consider If: Complexity requires deeper understanding of concentrated liquidity mechanics; best for experienced LPs.
Fees Notes: Varies by strategy; typically performance-based
Regions: Global; EVM chains and StarkNet
Alternatives: DefiEdge, Steer Protocol
10. Mellow Protocol — Best for Institutional Vaults
Why Use It
Mellow Protocol provides infrastructure for institutional-grade vaults with sophisticated curator models where professional risk managers and funds deploy strategies on behalf of LPs. While their focus has shifted toward broader vault infrastructure, Mellow's ALM toolkit remains integrated with Aerodrome and Velodrome, offering optimized range management with automated reward harvesting on SuperChain DEXs.
Best For
- Institutional LPs seeking professional management
- Aerodrome and Velodrome liquidity providers
- Users wanting curator-managed strategies
- Projects requiring compliance-ready vault infrastructure
Notable Features
- Institutional-grade vault infrastructure
- Integration with Aerodrome/Velodrome on Base and Optimism
- Curator marketplace with professional risk management
- Automated reward harvesting and compounding
- Audited by ChainSecurity and BlockSec
Consider If: Less focused on pure CLM compared to dedicated platforms; best for users seeking broader DeFi yield strategies including staking and lending.
Fees Notes: Varies by curator and vault; typically 10-20% performance fees
Regions: Global; primarily Ethereum, Optimism, Base, Arbitrum
Alternatives: Arrakis Finance, Gamma Strategies
Decision Guide: Best By Use Case
- Best for Multi-Chain Coverage → Gamma Strategies, Steer Protocol
- Best for Token Launches (TGE) → Arrakis Finance, ICHI (Angel Vaults)
- Best for Single-Sided Deposits → ICHI
- Best for Lowest Management Fees → Revert Finance (for analytics + selective automation)
- Best for Uniswap v4 Hooks → Bunni, Gamma Strategies
- Best for Analytics & Backtesting → Revert Finance
- Best for Institutional Management → Arrakis Finance, Mellow Protocol
- Best for Strategy Customization → A51 Finance, DefiEdge
- Best for BSC & Multi-Chain Yield → Beefy Finance CLM
- Best for Aerodrome/Velodrome on SuperChain → Mellow Protocol, Steer Protocol
How to Choose the Right Concentrated Liquidity Manager (Checklist)
Before selecting a CLM platform, verify:
- ☑ Chain Compatibility — Confirm the platform supports your target blockchain and DEX
- ☑ Strategy Alignment — Match strategy types (narrow/wide range, stable pairs, volatile pairs) to your goals
- ☑ Fee Structure Transparency — Understand performance fees, harvest fees, and withdrawal costs
- ☑ Track Record & TVL — Check operational history, total value managed, and security incidents
- ☑ Audit Status — Verify smart contracts have been audited by reputable firms
- ☑ Token Pairs Supported — Confirm your desired liquidity pools are available
- ☑ Rebalancing Frequency — Understand how often positions are rebalanced and gas cost implications
- ☑ Exit Flexibility — Check withdrawal timeframes, fees, and liquidity availability
- ☑ Performance Metrics — Review historical APRs accounting for impermanent loss
- ☑ Composability Needs — If using LP tokens elsewhere, verify ERC-20 support vs. NFTs
Red Flags:
- 🚩 No audits or anonymous teams without established track record
- 🚩 Unclear fee structures or hidden withdrawal penalties
- 🚩 Very high performance fees (>20%) without justified value-add
- 🚩 Limited chain support if you need multi-chain exposure
Use Token Metrics With Any Concentrated Liquidity Manager
Token Metrics complements your concentrated liquidity strategy by providing:
AI Ratings — Screen tokens for quality and momentum before selecting trading pairs for liquidity provision
Narrative Detection — Identify emerging DeFi themes early to position liquidity in high-growth sectors
Portfolio Optimization — Balance concentrated liquidity positions across chains and risk profiles
Alerts & Signals — Time liquidity entries and exits based on technical and on-chain indicators
Workflow Example:
- Research → Use Token Metrics AI to identify high-quality token pairs
- Select CLM → Choose appropriate concentrated liquidity manager based on chain and strategy
- Deploy → Provide liquidity through automated vault or custom range
- Monitor → Track performance with Token Metrics alerts for rebalancing or exit signals
Start free trial to screen assets and optimize your concentrated liquidity strategy with AI-powered insights.

Security & Compliance Tips
Protect Your Concentrated Liquidity Positions:
- Verify Contract Addresses — Always confirm official contract addresses on protocol documentation before depositing; bookmark official sites
- Check Audit Reports — Review smart contract audits from firms like Consensys, ChainSecurity, Hydn, or BlockSec before using new platforms
- Start Small — Test new CLM platforms with modest capital before committing significant liquidity
- Monitor Phishing — Be wary of fake CLM interfaces; never share seed phrases or sign suspicious transactions
- Understand Permissions — Review what approvals you're granting; consider using revoke.cash to audit token approvals
- Track IL Exposure — Concentrated liquidity amplifies impermanent loss; monitor positions regularly and understand divergence loss implications
- Diversify CLM Providers — Don't concentrate all liquidity with a single manager; spread risk across multiple audited platforms
- Check Rebalancing Limits — Understand if CLMs have daily rebalancing limits or gas thresholds that might delay adjustments
- Verify Withdrawal Process — Test small withdrawals to ensure liquidity is accessible and fees match expectations
- Stay Informed — Follow CLM protocol announcements for security updates, parameter changes, or migration requirements
This article is for research and educational purposes only, not financial advice. Always conduct your own due diligence and consider consulting with financial advisors before providing liquidity.
Beginner Mistakes to Avoid
- Ignoring Impermanent Loss — CLMs optimize fee generation but cannot eliminate IL; highly volatile pairs will still result in divergence loss
- Chasing High APRs Without Context — Displayed APRs often exclude impermanent loss and may reflect short-term incentives, not sustainable yields
- Not Understanding Fee Structures — Performance fees compound over time; a 15% fee on yields can significantly impact long-term returns
- Depositing Without Strategy Alignment — Narrow ranges earn higher fees but require more active management; ensure strategy matches your risk tolerance
- Overlooking Gas Costs — Rebalancing and compounding operations cost gas; on Ethereum mainnet, frequent rebalancing may erode returns for small positions
- Assuming "Set and Forget" — While automated, CLM positions require periodic review; market regime changes may necessitate strategy adjustments
- Not Tracking Net Performance — Always calculate returns vs. simply holding tokens; CLM fees + IL may underperform holding in ranging markets
- Concentrating in Illiquid Pairs — Low-volume pairs may have insufficient fee generation to cover management costs and rebalancing slippage
FAQs
What is a concentrated liquidity manager?
A concentrated liquidity manager (CLM) is a DeFi protocol that automates the management of concentrated liquidity positions on AMMs like Uniswap v3. CLMs handle range selection, rebalancing, fee compounding, and position optimization, converting active liquidity provision into a passive strategy. They typically provide ERC-20 LP tokens representing managed positions, making them composable across DeFi.
Are concentrated liquidity managers safe?
Security varies by platform. Established CLMs like Gamma Strategies, Arrakis, and Steer have multiple audits and years of operational history without major exploits. However, smart contract risk always exists; never deposit more than you can afford to lose, and prioritize audited platforms with proven track records. Review audit reports and monitor protocol security updates.
What fees do concentrated liquidity managers charge?
Most CLMs charge performance fees ranging from 5-15% of generated yields. Some add harvest fees (like Beefy's 9.5%), automation fees (Revert's 0.25% per operation), or swap fees for rebalancing. Always review the specific fee structure before depositing, as fees compound over time and can significantly impact net returns.
Which chains support concentrated liquidity managers?
Major CLMs support Ethereum, Polygon, Arbitrum, Optimism, and Base. Gamma Strategies leads with 20+ chains including BSC, Avalanche, Fantom, and newer L2s. Steer Protocol supports 17+ chains with 90%+ CLAMM coverage. Always verify your target chain is supported before selecting a CLM platform.
Can I use concentrated liquidity managers on mobile?
Most CLMs offer web interfaces compatible with mobile wallets like MetaMask Mobile, Coinbase Wallet, or WalletConnect. However, complex features like strategy backtesting (Revert) or custom position building may be better suited for desktop. Core functions like depositing, withdrawing, and monitoring positions work well on mobile.
Do CLMs work with Uniswap v4?
Yes. Gamma Strategies, Bunni, and A51 Finance support Uniswap v4, which launched in January 2025. Bunni is the leading v4 hook implementation, offering advanced features like Liquidity Density Functions. Arrakis is also developing v4 modules. Expect more CLMs to add v4 support as the protocol matures.
How do CLMs handle impermanent loss?
CLMs cannot eliminate impermanent loss—they optimize range management to maximize fee generation that can offset IL. Some platforms (Bunni, ICHI) offer specific strategies to mitigate IL through MEV protection or single-sided deposits, but divergence loss remains inherent to providing liquidity in volatile pairs.
What's the difference between CLMs and regular yield optimizers?
Regular yield optimizers (like Beefy for Uniswap v2) auto-compound rewards from liquidity mining programs. CLMs specifically manage concentrated liquidity positions, handling range selection and rebalancing. Some platforms (Beefy CLM) combine both, offering concentrated liquidity management integrated with yield optimization.
Conclusion + Related Reads
Concentrated liquidity managers have matured into essential DeFi infrastructure, transforming active LP strategies into accessible passive income opportunities. For multi-chain diversification and proven track record, Gamma Strategies remains the industry standard. Token launch teams and protocols requiring institutional-grade management should consider Arrakis Finance, while those seeking cutting-edge Uniswap v4 features can explore Bunni. LPs prioritizing single-sided deposits will find ICHI most suitable, and analytics-focused investors should evaluate Revert Finance.
Remember that no CLM eliminates impermanent loss—they optimize for fee generation and capital efficiency. Always verify fee structures, audit status, and supported chains before deploying capital. Start with smaller positions to understand platform mechanics and performance before scaling up.
Related Reads:
AI Agents in Minutes, Not Months

.svg)


%201.svg)

.png)


.svg)
No Credit Card Required


Online Payment


SSL Encrypted
.png)
Token Metrics Media LLC is a regular publication of information, analysis, and commentary focused especially on blockchain technology and business, cryptocurrency, blockchain-based tokens, market trends, and trading strategies.
Token Metrics Media LLC does not provide individually tailored investment advice and does not take a subscriber’s or anyone’s personal circumstances into consideration when discussing investments; nor is Token Metrics Advisers LLC registered as an investment adviser or broker-dealer in any jurisdiction.
Information contained herein is not an offer or solicitation to buy, hold, or sell any security. The Token Metrics team has advised and invested in many blockchain companies. A complete list of their advisory roles and current holdings can be viewed here: https://tokenmetrics.com/disclosures.html/
Token Metrics Media LLC relies on information from various sources believed to be reliable, including clients and third parties, but cannot guarantee the accuracy and completeness of that information. Additionally, Token Metrics Media LLC does not provide tax advice, and investors are encouraged to consult with their personal tax advisors.
All investing involves risk, including the possible loss of money you invest, and past performance does not guarantee future performance. Ratings and price predictions are provided for informational and illustrative purposes, and may not reflect actual future performance.