Back to blog
Research

Top Data Availability Layers (2025)

Compare the top 10 data availability layers for rollups and appchains in 2025. See who leads on DA security, costs, and modular integrations. Includes use case decision guide and common pitfalls.
Token Metrics Team
11 min read
Want Smarter Crypto Picks—Free?
See unbiased Token Metrics Ratings for BTC, ETH, and top alts.
Thank you! Your submission has been received!
Oops! Something went wrong while submitting the form.
 No credit card | 1-click unsubscribe

Who this guide is for. Teams launching rollups or appchains that need reliable, verifiable data availability layers to minimize costs while preserving security.

Top three picks.

  • Celestia — lowest-friction modular DA with broad tooling and clear blob fee model.
  • EigenDA — high-throughput, Ethereum-aligned DA with reserved/on-demand bandwidth tiers.
  • Avail — production DA with developer-friendly docs and transparent fee formula.

Caveat. Fees vary by data size, congestion, and commitment type (on-chain blobs vs. off-chain DA/DAC). Always confirm region eligibility and SLAs in provider docs.


Introduction: Why Data Availability Layers Matter in November 2025

Data availability layers let rollups publish transaction data so anyone can reconstruct state and verify proofs. In 2025, modular stacks (OP Stack, Polygon CDK, ZK Stack) routinely separate execution from DA to optimize costs and performance. Your DA choice affects security (trust assumptions), fees (blob gas vs. DA network fees), and UX (latency, bandwidth caps).
Search intent here is commercial-investigational: teams comparing providers by cost, security model, and integration options. We’ll keep things concrete, link only official sources, and show exactly who each option fits.

How We Picked (Methodology & Scoring)

  • Liquidity/Scale — 30%: adoption, throughput, sustained bandwidth.
  • Security — 25%: trust assumptions (L1 blobs vs. DAC), transparency, docs.
  • Coverage — 15%: SDKs, stacks supported (OP Stack, Polygon CDK, ZK Stack), bridges.
  • Costs — 15%: posted pricing/fee mechanics.
  • UX — 10%: setup, tooling, observability.
  • Support — 5%: docs, guides, contact points.
    Data from official docs/pricing/status pages; third-party datasets used only for cross-checks. Last updated November 2025.


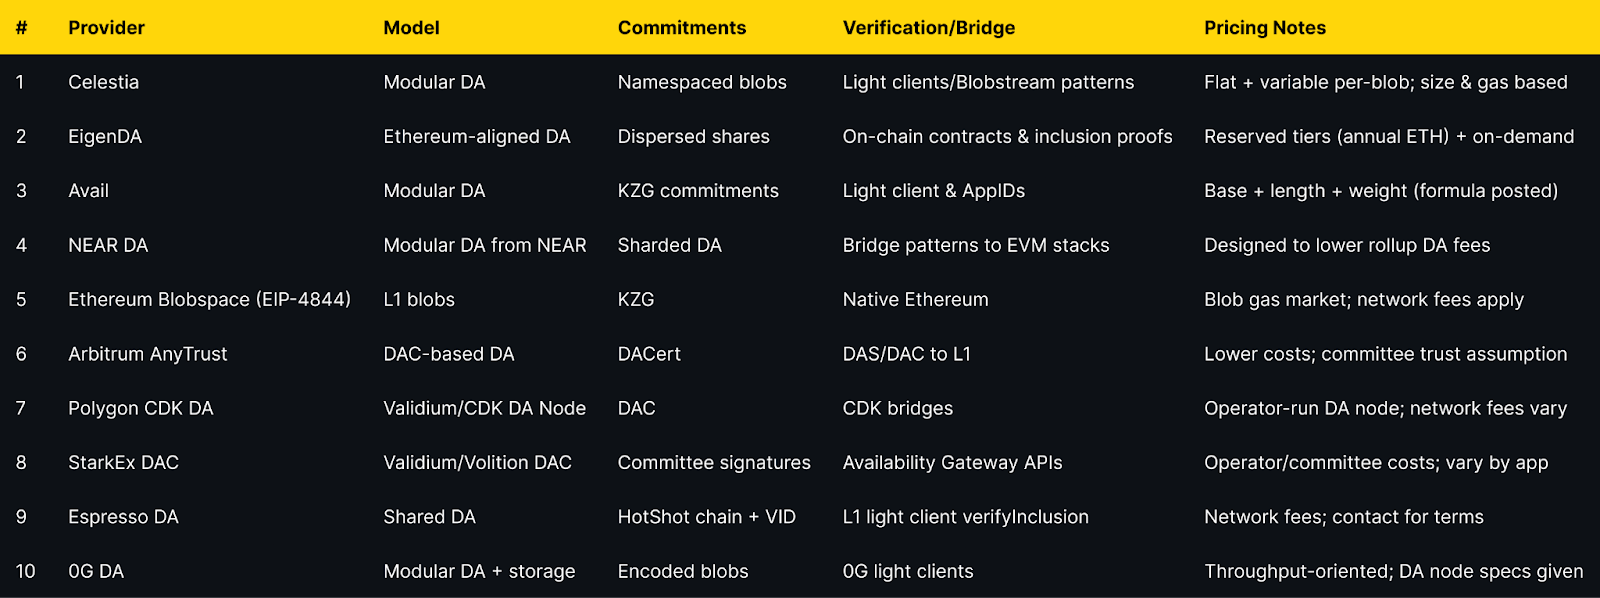
Top 10 Data Availability Layers in November 2025

1. Celestia — Best for modular DA at predictable blob economics

Why Use It. Celestia specializes in DA with namespaced blobs and data availability sampling. Fees are a flat transaction fee plus a variable component based on blob size, so costs scale with data posted rather than execution. Clear “PayForBlobs” guidance and explorers make planning straightforward. (blog.bcas.io)
Best For. OP Stack/sovereign rollups; teams optimizing DA cost; multi-chain deployments.
Notable Features. Namespaced blobs; fee market tied to blob size; tooling for PFB; docs on submitting and estimating fees. (Celestia Docs)
Fees Notes. Flat + variable per-blob; gas-price prioritized. (Celestia Docs)
Regions. Global (check validator/geography exposure in explorers).
Consider If. You want modular DA with transparent per-blob costs.
Alternatives. EigenDA, Avail.  


2. EigenDA — Best for high throughput with reserved bandwidth tiers

Why Use It. EigenDA is built on EigenLayer and offers mainnet DA with published reserved bandwidth tiers (annual ETH) and on-demand options. Strong alignment with Ethereum restaking and high advertised throughput. (docs.eigencloud.xyz)
Best For. High-throughput L2s; OP Stack/Orbit/CDK chains seeking cloud-grade throughput.
Notable Features. Reserved tiers (e.g., 512–2048 KiB/s and up), on-demand pricing updates, EigenLayer operator set. (eigenda.xyz)
Fees Notes. Reserved pricing in ETH per year; on-demand available. (eigenda.xyz)
Regions. Global.
Consider If. You want capacity commitments and Ethereum-aligned security.
Alternatives. Celestia, Avail.  


3. Avail — Best for dev-friendly docs and transparent fee formula

Why Use It. Avail provides DA with clear developer pathways (AppIDs, deploy rollups) and posts a fee formula: base + length + weight + optional tip. Guides include OP Stack and ZK Stack integrations. (docs.availproject.org)
Best For. Teams needing step-by-step deployment templates and cost modeling.
Notable Features. AppID model; OP Stack/Validium guides; fee components documented. (docs.availproject.org)
Fees Notes. Base + length + weight + optional tip; congestion multiplier. (docs.availproject.org)
Regions. Global.
Consider If. You want docs-first integration and a transparent pricing formula.
Alternatives. Celestia, EigenDA.  


4. NEAR Data Availability (NEAR DA) — Best for cost-reduction via NEAR’s sharded DA

Why Use It. NEAR modularizes its DA layer for external rollups, aiming to lower DA fees while leveraging its sharded architecture. Official materials target Ethereum rollups explicitly. (docs.near.org)
Best For. Rollups prioritizing low DA cost and sharded throughput.
Notable Features. Sharded DA; chain-abstraction docs; community implementations (e.g., Nuffle). (docs.near.org)
Fees Notes. Designed to reduce rollup DA cost; confirm network fees in docs. (NEAR)
Regions. Global.
Consider If. You want a low-cost DA path and EVM interoperability.
Alternatives. Avail, Celestia.


5. Ethereum Blobspace (EIP-4844) — Best for maximum L1 neutrality with ephemeral blobs

Why Use It. Post data to Ethereum blobs for protocol-level guarantees during the blob retention window (~18 days). Ideal for projects that want L1 alignment and can operate within ephemeral storage constraints and blob gas markets. (Ethereum Improvement Proposals)
Best For. Security-first teams preferring L1 attestation and ecosystem neutrality.
Notable Features. KZG commitments; ephemeral blob storage; native verification. (ethereum.org)
Fees Notes. Blob gas; variable by demand; L1 network fees apply. (ethereum.org)
Regions. Global.
Consider If. You accept blob retention limits and variable blob pricing.
Alternatives. Celestia, EigenDA.


6. Arbitrum AnyTrust (DAC) — Best for cost-optimized OP-style chains using a DAC

Why Use It. AnyTrust lowers costs by storing data with a Data Availability Committee and posting certificates on L1. Detailed runbooks exist for configuring DACs for Orbit chains. (docs.arbitrum.io)
Best For. Orbit chains and apps with mild trust assumptions for lower fees.
Notable Features. DACert flow; DAS; step-by-step DAC deployment docs. (docs.arbitrum.io)
Fees Notes. Lower posting costs; committee/infra costs vary. (docs.arbitrum.io)
Regions. Global (committee member distribution varies).
Consider If. You want cheaper DA and can trust a DAC quorum.
Alternatives. Polygon CDK DA, StarkEx DAC.


7. Polygon CDK Data Availability — Best for CDK chains wanting Validium-style DA

Why Use It. CDK chains can use a DA node and DAC approach for Validium-style costs, with official repos describing the CDK DA component. Best fit if you’re already on CDK and want DA flexibility. (polygon.technology)
Best For. Polygon CDK deployers; validium-first apps.
Notable Features. CDK DA node repo; DAC configuration; CDK ecosystem tooling. (GitHub)
Fees Notes. Operator/committee costs; network fees vary by setup. (polygon.technology)
Regions. Global.
Consider If. You need CDK-native DA with Validium trade-offs.
Alternatives. Arbitrum AnyTrust, EigenDA.


8. StarkEx Data Availability Committee — Best for Validium/Volition deployments needing DAC maturity

Why Use It. StarkEx supports Validium and Volition modes via a DAC with APIs (Availability Gateway) and reference implementations for committee nodes. Production-hardened across top apps. (docs.starkware.co)
Best For. High-volume ZK apps on StarkEx preferring low DA costs.
Notable Features. DAC reference code; Volition support; batch data APIs. (GitHub)
Fees Notes. Committee/infra costs; app-specific. (docs.starkware.co)
Regions. Global (committee selection per app).
Consider If. You accept DAC trust assumptions for cost savings.
Alternatives. Arbitrum AnyTrust, Polygon CDK DA.


9. Espresso DA — Best for shared DA paired with neutral sequencing

Why Use It. Espresso offers a shared DA with HotShot consensus and a light-client verifyInclusion function for on-chain verification, designed to interoperate with other DA choices if desired. (docs.espressosys.com)
Best For. Rollups adopting shared sequencing and wanting cheap DA.
Notable Features. HotShot consensus; three-layer DA architecture; flexible with other DAs. (L2BEAT)
Fees Notes. Network fees; contact providers/infrastructure partners for terms. (blockdaemon.com)
Regions. Global.
Consider If. You want shared sequencing + DA as a package.
Alternatives. EigenDA, Celestia.


10. 0G DA — Best for high-throughput apps (AI/gaming) needing DA + storage

Why Use It. 0G pairs a DA layer with a general-purpose storage system and provides DA node specs and runbooks. Positioned for high-volume data workloads and fast retrieval. (docs.0g.ai)
Best For. Data-heavy chains (AI, gaming) needing scalable DA and storage.
Notable Features. Encoded blob data; DA node specs; whitepaper architecture (DA atop storage). (GitHub)
Fees Notes. Throughput-oriented network; confirm current pricing with 0G. (0g.ai)
Regions. Global.
Consider If. You’re optimizing for data-heavy throughput and retrieval.
Alternatives. Celestia, Avail.


Decision Guide: Best By Use Case


How to Choose the Right Data Availability Layer (Checklist)

  • ☐ Region eligibility and any operator restrictions documented
  • ☐ Security model fits app (L1 blobs vs. modular DA vs. DAC)
  • ☐ Fee mechanics are explicit (blob gas, per-blob size, or formula)
  • ☐ Tooling and SDKs for your stack (OP Stack, CDK, ZK Stack)
  • ☐ Throughput/bandwidth and quotas published or contractually reserved
  • ☐ Observability: explorers, status pages, inclusion proofs/light clients
  • ☐ Clear guides for deployment and migration paths
  • ☐ Support channels and escalation (SLA/contacts)
  • Red flags: no official fee notes, opaque committees, or missing verification docs.

Use Token Metrics With Any Data Availability Layer

  • AI Ratings to screen assets by quality and momentum.


  • Narrative Detection to spot early theme shifts.
  • Portfolio Optimization to balance risk across chains.
  • Alerts & Signals to time entries/exits.
    Workflow: Research → Select DA → Launch rollup/appchain → Monitor with alerts.

Start free trial to screen assets and time entries with AI.  


Security & Compliance Tips

  • Run independent verification (light clients/inclusion proofs) where available.
  • For DACs, diversify committee members and publish membership changes.
  • Monitor quotas/latency; set fallbacks (e.g., switch DA mode where stack supports Alt-DA). (docs.optimism.io)
  • Validate official endpoints; beware of phishing and copycat docs.
  • Track fee spikes (blob gas, congestion multipliers) and set budget alarms. (ethereum.org)
  • Document upgrade paths and retention windows (e.g., blob expiry). (ethereum.org)

This article is for research/education, not financial advice.


Beginner Mistakes to Avoid

  • Treating DA choice as “set-and-forget” without monitoring fees and bandwidth.
  • Ignoring blob retention on Ethereum and assuming permanence. (ethereum.org)
  • Using a DAC without clear membership and recovery processes. (docs.arbitrum.io)
  • Skipping test deployments to measure real blob sizes and costs.
  • Overlooking verification UX (light clients/proofs) for end users.
  • Assuming all stacks support seamless DA switching without work. (docs.optimism.io)

How We Picked (Methodology & Scoring)

Scoring Weights (sum = 100): Liquidity/Scale 30, Security 25, Coverage 15, Costs 15, UX 10, Support 5.
We examined official docs for pricing/fees, security/verification, and deployment guides. We favored providers with explicit fee notes (formulas or tiers), clear verification models, and active ecosystem integrations. Last updated November 2025.


FAQs

What are data availability layers?
 They’re systems that publish rollup data so anyone can reconstruct state and verify proofs. They range from L1 blobs (Ethereum EIP-4844) to modular DA networks (Celestia, Avail) and DACs. (ethereum.org)

Are blobs on Ethereum permanent?
 No. Blob data is retained for a limited window (~18 days). If you need permanent access, you must snapshot or use a DA with different retention. (ethereum.org)

How do DA fees work?
 Fees vary: Celestia ties fees to blob size and gas; Avail publishes a base/length/weight formula; Ethereum blobs use a blob-gas market; EigenDA offers reserved bandwidth tiers. (Celestia Docs)

What’s a DAC and when should I use one?
 A Data Availability Committee stores data off-chain and posts certificates or signatures to L1. It’s cheaper but introduces committee trust assumptions. Used by Arbitrum AnyTrust, StarkEx/Volition, and CDK Validium. (docs.arbitrum.io)

Can OP Stack chains plug into alternative DA?
 Yes. OP Stack supports Alt-DA mode to integrate various DA layers. Validate trade-offs and tooling before switching. (docs.optimism.io)


Conclusion + Related Reads

If you want transparent per-blob costs and strong tooling, pick Celestia. For capacity commitments and Ethereum alignment, choose EigenDA. If you want a formula-based fee model with practical guides, Avail is compelling. DAC-based routes (AnyTrust, StarkEx, CDK) suit cost-sensitive apps comfortable with committee trust assumptions.

Related Reads (Token Metrics)

Build Smarter Crypto Apps &
AI Agents in Minutes, Not Months
Real-time prices, trading signals, and on-chain insights all from one powerful API.
Grab a Free API Key
About Token Metrics
Token Metrics: AI-powered crypto research and ratings platform. We help investors make smarter decisions with unbiased Token Metrics Ratings, on-chain analytics, and editor-curated “Top 10” guides. Our platform distills thousands of data points into clear scores, trends, and alerts you can act on.
30 Employees
analysts, data scientists, and crypto engineers
Daily Briefings
concise market insights and “Top Picks”
Transparent & Compliant
Sponsored ≠ Ratings; research remains independent
Want Smarter Crypto Picks—Free?
See unbiased Token Metrics Ratings for BTC, ETH, and top alts.
Thank you! Your submission has been received!
Oops! Something went wrong while submitting the form.
 No credit card | 1-click unsubscribe
Token Metrics Team
Token Metrics Team

Recent Posts

Research

Shiba Inu Price Prediction 2027: SHIB Forecast & Risk Warning

Token Metrics Team
6 min read

Shiba Inu Price Prediction: Understanding SHIB's Speculative Nature

Shiba Inu operates as a community-driven meme token where price action stems primarily from social sentiment, attention cycles, and speculative trading rather than fundamental value drivers. SHIB exhibits extreme volatility with no defensive characteristics or revenue-generating mechanisms typical of utility tokens. Token Metrics price prediction scenarios below provide technical price forecasts across different market cap environments, though meme tokens correlate more strongly with viral trends and community engagement than systematic market cap models. Positions in SHIB should be sized as high-risk speculative bets with potential for total loss.


Disclosure

Educational purposes only, not financial advice. Crypto is volatile, do your own research and manage risk.

How to read this price prediction:

Each band blends cycle analogues and market-cap share math with TA guardrails. Base assumes steady adoption and neutral or positive macro. Moon layers in a liquidity boom. Bear assumes muted flows and tighter liquidity. For meme tokens, actual price prediction outcomes depend heavily on social trends and community momentum beyond what market cap models capture.

TM Agent baseline:

Token Metrics TM Grade is 24.1%, Sell, with a bearish trading signal. The concise 12‑month numeric price prediction view centers between $0.000005 and $0.000035, with a base case price target near $0.000012.

TM Agent numeric view: scenarios center roughly between $0.000005 and $0.000035, with a base case near $0.000012.

Live details: Token Details 

Key Takeaways for SHIB Price Prediction

  • Highly speculative asset driven by sentiment and attention rather than fundamentals
  • Scenario driven: price prediction outcomes hinge on total crypto market cap and viral momentum
  • Extreme volatility characteristic - SHIB can experience double-digit percentage moves daily
  • TM Agent gist: Bearish short term, price prediction range $0.000005–$0.000035
  • Entertainment risk only, not financial advice

Shiba Inu Price Prediction: Scenario Analysis

Token Metrics price prediction scenarios provide technical price bands across market cap tiers:

8T Market Cap Price Prediction:

At 8 trillion total crypto market cap, SHIB price prediction projects to $0.041998 (bear), $0.042366 (base), and $0.042734 (moon).

16T Market Cap Price Prediction:

At 16 trillion total crypto market cap, SHIB price forecast projects to $0.043973 (bear), $0.045077 (base), and $0.046182 (moon).

23T Market Cap Price Prediction:

At 23 trillion total crypto market cap, SHIB price prediction projects to $0.045948 (bear), $0.047789 (base), and $0.049629 (moon).

  31T Market Cap Price Prediction:

At 31 trillion total crypto market cap, SHIB price prediction projects to $0.047923 (bear), $0.051050 (base), and $0.051307 (moon).

 These technical price prediction ranges assume meme tokens maintain market cap share proportional to overall crypto growth. Actual outcomes for speculative tokens typically exhibit higher variance and stronger correlation to social trends than these price prediction models predict.

What Is Shiba Inu?

Shiba Inu is a meme-born crypto project that centers on community and speculative culture. Unlike utility tokens with specific use cases, SHIB operates primarily as a speculative asset and community symbol. The project focuses on community engagement and entertainment value.

SHIB has demonstrated viral moments and community loyalty within the broader meme token category. The token trades on community sentiment and attention cycles more than fundamentals. Market performance depends heavily on social media attention and broader meme coin cycles.

Risks That Skew Bearish for Price Prediction

  • Extreme volatility from pure sentiment-driven price action with no fundamental support
  • Attention cycles shift rapidly, leaving early viral tokens abandoned as new memes emerge
  • Liquidity can evaporate quickly during downturns, creating severe slippage and exit difficulty
  • Regulatory scrutiny may target meme tokens as securities or gambling instruments
  • Macro risk-off environments hit speculative assets hardest, with meme coins showing largest drawdowns
  • Community fragmentation or developer abandonment can eliminate remaining narrative support
  • These factors could push SHIB price predictions toward the lower bear scenarios

Make Your Next Move with Token Metrics

Token Metrics provides technical analysis, scenario math, price prediction models, and rigorous risk evaluation for hundreds of crypto tokens. Want to dig deeper? Explore our powerful AI-powered ratings and scenario tools here.

FAQs: Shiba Inu Price Prediction

Will SHIB 10x from here according to price predictions?

At current price of $0.041027, a 10x reaches $0.41027. This level does not appear in any of the listed bear, base, or moon price prediction scenarios across 8T, 16T, 23T, or 31T tiers. Meme tokens can 10x rapidly during viral moments but can also lose 90%+ just as quickly. Position sizing for potential total loss is critical. Not financial advice.

What are the biggest risks to SHIB price predictions?

Primary risks include attention shifting to newer memes, community fragmentation, developer abandonment, regulatory crackdowns, and liquidity collapse during downturns. Unlike utility tokens with defensive characteristics, SHIB has zero fundamental floor. Price can approach zero if community interest disappears. Total loss is a realistic outcome that price prediction models cannot fully account for. Not financial advice.

What is the 2027 Shiba Inu price prediction?

Based on Token Metrics analysis, the 2027 price prediction for SHIB centers around $0.000012 in the base case under current market conditions. However, meme token price predictions are highly unreliable due to extreme dependence on social trends, viral cycles, and community sentiment that can change rapidly. These technical price prediction ranges should be viewed with extreme caution.

Can SHIB reach $0.01 according to price predictions?

Based on the price prediction scenarios across all market cap tiers (8T-31T), SHIB projections range from $0.041998 to $0.051307. While these technical price predictions show SHIB trading above $0.04, the extreme volatility and sentiment-driven nature of meme tokens means actual outcomes can vary dramatically from model projections. Not financial advice.


Next Steps

Track live data: Token Details

• Consider fundamental crypto assets with utility and defensive characteristics rather than pure speculation.

Disclosure

Educational purposes only, not financial advice. SHIB is a highly speculative asset with extreme volatility and high risk of total loss. Meme tokens operate as entertainment and gambling instruments rather than investments. Only allocate capital you can afford to lose entirely. Do your own research and manage risk appropriately.

Research

WhiteBIT Coin Price Prediction 2028: $40-$272 Target Analysis

Token Metrics Team
7 min read

WhiteBIT Coin Price Prediction: Portfolio Context for WBT in the 2028 Landscape

Exchange tokens like WhiteBIT Coin offer leveraged exposure to overall market activity, creating concentration risk around a single platform's success. While WBT can deliver outsized returns during bull markets with high trading volumes, platform-specific risks like regulatory action, security breaches, or competitive displacement amplify downside exposure. Portfolio theory suggests balancing such concentrated bets with broader sector exposure.

The price prediction scenarios below show how WBT might perform across different crypto market cap environments. Rather than betting entirely on WhiteBIT Coin's exchange succeeding, diversified strategies blend exchange tokens with L1s, DeFi protocols, and infrastructure plays to capture crypto market growth while mitigating single-platform risk.

The Case for Diversified Index Exposure

Portfolio theory teaches that diversification is the only free lunch in investing. WBT concentration violates this principle by tying your crypto returns to one protocol's fate. Token Metrics Indices blend WhiteBIT Coin with the top one hundred tokens, providing broad exposure to crypto's growth while smoothing volatility through cross-asset diversification. This approach captures market-wide tailwinds without overweighting any single point of failure.

Systematic rebalancing within index strategies creates an additional return source that concentrated positions lack. As some tokens outperform and others lag, regular rebalancing mechanically sells winners and buys laggards, exploiting mean reversion and volatility. Single-token holders miss this rebalancing alpha and often watch concentrated gains evaporate during corrections while index strategies preserve more gains through automated profit-taking.

Beyond returns, diversified indices improve the investor experience by reducing emotional decision-making. Concentrated WBT positions subject you to severe drawdowns that trigger panic selling at bottoms. Indices smooth the ride through natural diversification, making it easier to maintain exposure through full market cycles.

Get Early Acces


Disclosure

Educational purposes only, not financial advice. Crypto is volatile, do your own research and manage risk.

How to read this price prediction:

Each band blends cycle analogues and market-cap share math with TA guardrails. Base assumes steady adoption and neutral or positive macro. Moon layers in a liquidity boom. Bear assumes muted flows and tighter liquidity.

TM Agent baseline:

Token Metrics long term price prediction view for WhiteBIT Coin, cashtag $WBT. Lead metric first, Token Metrics TM Grade is 52.5%, Hold, and the trading signal is bearish, indicating short-term downward momentum. Concise 12-month numeric price prediction view: Token Metrics scenarios center roughly between $10 and $85, with a base case price target near $40.

Live details: Token Details

Key Takeaways for WBT Price Prediction

  • Scenario driven: price prediction outcomes hinge on total crypto market cap; higher liquidity and adoption lift the price bands
  • Single-asset concentration amplifies both upside and downside versus diversified approaches
  • Fundamentals: Fundamental Grade 52.35% (Community 82%, Tokenomics 60%, Exchange 50%, VC —, DeFi Scanner N/A)
  • TM Agent gist: Bearish momentum, 12-month price prediction range $10 to $85
  • Education only, not financial advice

WhiteBIT Coin Price Prediction: Scenario Analysis

Token Metrics price prediction scenarios span four market cap tiers, each representing different levels of crypto market maturity and liquidity:

8T Market Cap Price Prediction:

At an 8 trillion dollar total crypto market cap, WBT price prediction projects to $54.50 in bear conditions, $64.88 in the base case, and $75.26 in bullish scenarios.

16T Market Cap Price Prediction:

Doubling the market to 16 trillion expands the price prediction range to $78.61 (bear), $109.75 (base), and $140.89 (moon).

23T Market Cap Price Prediction:

At 23 trillion, the price forecast scenarios show $102.71, $154.61, and $206.51 respectively.

31T Market Cap Price Prediction:

In the maximum liquidity scenario of 31 trillion, WBT price prediction could reach $126.81 (bear), $199.47 (base), or $272.13 (moon).


These price prediction ranges illustrate potential outcomes for concentrated WBT positions, but investors should weigh whether single-asset exposure matches their risk tolerance or whether diversified strategies better suit their objectives.

What Is WhiteBIT Coin?

WhiteBIT Coin is the native exchange token associated with the WhiteBIT ecosystem. It is designed to support utility on the platform and related services.

WBT typically provides fee discounts and ecosystem benefits where supported. Usage depends on exchange activity and partner integrations.

Token Metrics AI Analysis for Price Prediction

Token Metrics AI provides comprehensive context on WhiteBIT Coin's positioning and challenges that inform our price prediction models.

Vision: The stated vision for WhiteBIT Coin centers on enhancing user experience within the WhiteBIT exchange ecosystem by providing tangible benefits such as reduced trading fees, access to exclusive features, and participation in platform governance or rewards programs. It aims to strengthen user loyalty and engagement by aligning token holders' interests with the exchange's long-term success. While not positioned as a decentralized protocol token, its vision reflects a broader trend of exchanges leveraging tokens to build sustainable, incentivized communities.

Problem: Centralized exchanges often face challenges in retaining active users and differentiating themselves in a competitive market. Users may be deterred by high trading fees, limited reward mechanisms, or lack of influence over platform developments. WhiteBIT Coin aims to address these frictions by introducing a native incentive layer that rewards participation, encourages platform loyalty, and offers cost-saving benefits. This model seeks to improve user engagement and create a more dynamic trading environment on the WhiteBIT platform.

Solution: WhiteBIT Coin serves as a utility token within the WhiteBIT exchange, offering users reduced trading fees, staking opportunities, and access to special events such as token sales or airdrops. It functions as an economic lever to incentivize platform activity and user retention. While specific governance features are not widely documented, such tokens often enable voting on platform upgrades or listing decisions. The solution relies on integrating the token deeply into the exchange's operational model to ensure consistent demand and utility for holders.

Market Analysis: Exchange tokens like WhiteBIT Coin operate in a competitive landscape led by established players such as Binance Coin (BNB) and KuCoin Token (KCS). While BNB benefits from a vast ecosystem including a launchpad, decentralized exchange, and payment network, WBT focuses on utility within its native exchange. Adoption drivers include the exchange's trading volume, security track record, and the attractiveness of fee discounts and staking yields. Key risks involve regulatory pressure on centralized exchanges and competition from other exchange tokens that offer similar benefits.

Fundamental Snapshot from Token Metrics

Fundamental Grade: 52.35% (Community 82%, Tokenomics 60%, Exchange 50%, VC —, DeFi Scanner N/A).


Catalysts That Skew Bullish for Price Prediction

  • Institutional and retail access expands with ETFs, listings, and integrations
  • Macro tailwinds from lower real rates and improving liquidity
  • Product or roadmap milestones such as upgrades, scaling, or partnerships
  • These factors could push WBT toward higher price prediction targets

Risks That Skew Bearish for Price Prediction

  • Macro risk-off from tightening or liquidity shocks
  • Regulatory actions or infrastructure outages
  • Concentration in validator economics and competitive displacement
  • Protocol-specific execution risk and competitive pressure from alternatives
  • These factors could push WBT toward lower price prediction scenarios

FAQs: WhiteBIT Coin Price Prediction

Can WBT reach $100 according to price predictions?

Based on the price prediction scenarios, WBT could reach $100 in the 16T base case. The 16T tier projects $109.75 in the base case price forecast. Achieving this price prediction requires both broad market cap expansion and WhiteBIT Coin maintaining competitive position. Not financial advice.

What's the risk/reward profile for WBT price prediction?

Risk and reward in our price prediction model span from $54.50 in the lowest bear case to $272.13 in the highest moon case. Downside risks include regulatory actions and competitive displacement, while upside drivers include expanding access and favorable macro liquidity. Concentrated positions amplify both tails, while diversified strategies smooth outcomes.

What gives WBT value and impacts price predictions?

WBT accrues value through fee discounts, staking rewards, access to special events, and potential participation in platform programs. Demand drivers include exchange activity, user growth, and security reputation. While these fundamentals matter for price predictions, diversified portfolios capture value accrual across multiple tokens rather than betting on one protocol's success.

What is the 2028 WhiteBIT Coin price prediction?

Based on Token Metrics analysis, the 2028 price prediction for WhiteBIT Coin centers around $40 in the base case under current market conditions, with a range between $10 and $85 depending on market scenarios. Bullish price predictions range from $64.88 to $272.13 across different total crypto market cap environments.

Can WBT reach $200 by 2028?

According to our price prediction models, WBT could reach $200 in the 23T moon case ($206.51) and in the 31T scenarios where the base case is $199.47 and the moon case is $272.13. These price prediction outcomes require significant crypto market expansion and WhiteBIT maintaining strong competitive positioning. Not financial advice.


Next Steps

Disclosure

Educational purposes only, not financial advice. Crypto is volatile, concentration amplifies risk, and diversification is a fundamental principle of prudent portfolio construction. Do your own research and manage risk appropriately.

Research

Predicting Litecoin Price in 2027: Scenario Analysis & On-Chain Scores

Token Metrics Team
6 min read

Litecoin Price Prediction Framework: Market Cap Scenarios & 2027 Forecast

Layer 1 tokens capture value through transaction fees and miner economics. Litecoin processes blocks every 2.5 minutes using Proof of Work, targeting fast, low-cost payments. The price prediction scenarios below model LTC outcomes across different total crypto market sizes, reflecting network adoption and transaction volume.


Disclosure

Educational purposes only, not financial advice. Crypto is volatile, do your own research and manage risk.

How to read this price prediction:

Each band blends cycle analogues and market-cap share math with TA guardrails. Base assumes steady adoption and neutral or positive macro. Moon layers in a liquidity boom. Bear assumes muted flows and tighter liquidity.

TM Agent baseline:

Token Metrics price prediction scenarios center roughly between $35 and $160, with a base case price target near $75, assuming gradual adoption, occasional retail rotation into major alts, and no major network issues. In a broad crypto rally LTC could test the upper bound price prediction, while in risk-off conditions it would likely drift toward the lower bound.

Live details: Token Details

Key Takeaways for LTC Price Prediction

  • Scenario driven: price prediction outcomes hinge on total crypto market cap; higher liquidity and adoption lift the price bands
  • Fundamentals: Fundamental Grade 83.98% (Community 79%, Tokenomics 100%, Exchange 100%, VC —, DeFi Scanner 57%)
  • Technology: Technology Grade 46.67% (Activity 51%, Repository 72%, Collaboration 60%, Security 20%, DeFi Scanner 57%)
  • TM Agent gist: the TM Grade is 21.8 (Sell), and the trading signal is bearish, indicating short-term downward momentum
  • Education only, not financial advice

Litecoin Price Prediction: Scenario Analysis

Token Metrics price prediction scenarios span four market cap tiers reflecting different crypto market maturity levels:

8T Market Cap Price Prediction:

At an 8 trillion dollar total crypto market cap, LTC price prediction projects to $115.80 in bear conditions, $137.79 in the base case, and $159.79 in bullish scenarios.

16T Market Cap Price Prediction:

At 16 trillion, the price prediction range expands to $154.54 (bear), $220.52 (base), and $286.50 (moon).

23T Market Cap Price Prediction:

The 23 trillion tier price forecast shows $193.28, $303.25, and $413.21 respectively.

31T Market Cap Price Prediction:

In the maximum liquidity scenario at 31 trillion, LTC price prediction reaches $232.03 (bear), $385.98 (base), or $539.92 (moon).


What Is Litecoin?

Litecoin is a peer-to-peer cryptocurrency launched in 2011 as an early Bitcoin fork. It uses Proof of Work with Scrypt and targets faster settlement, processing blocks roughly every 2.5 minutes with low fees.

LTC is the native token used for transaction fees and miner rewards. Its primary utilities are fast, low-cost payments and serving as a testing ground for Bitcoin-adjacent upgrades, with adoption in retail payments, remittances, and exchange trading pairs.

Token Metrics AI Analysis for Price Prediction

Token Metrics AI provides additional context on Litecoin's technical positioning and market dynamics that inform our price prediction models.

Vision: Litecoin's vision is to serve as a fast, low-cost, and accessible digital currency for everyday transactions. It aims to complement Bitcoin by offering quicker settlement times and a more efficient payment system for smaller, frequent transfers.

Problem: Bitcoin's relatively slow block times and rising transaction fees during peak usage make it less ideal for small, frequent payments. This creates a need for a cryptocurrency that maintains security and decentralization while enabling faster and cheaper transactions suitable for daily use.

Solution: Litecoin addresses this by using a 2.5-minute block time and the Scrypt algorithm, which initially allowed broader participation in mining and faster transaction processing. It functions primarily as a payment-focused blockchain, supporting peer-to-peer transfers with low fees and high reliability, without the complexity of smart contract functionality.

Market Analysis: Litecoin operates in the digital payments segment of the cryptocurrency market, often compared to Bitcoin but positioned as a more efficient medium of exchange. While it lacks the smart contract capabilities of platforms like Ethereum or Solana, its simplicity, long-standing network security, and brand recognition give it a stable niche. It competes indirectly with other payment-focused cryptocurrencies like Bitcoin Cash and Dogecoin. Adoption is sustained by its integration across major exchanges and payment services, but growth is limited by the broader shift toward ecosystems offering decentralized applications.

Fundamental and Technology Snapshot from Token Metrics

Fundamental Grade: 83.98% (Community 79%, Tokenomics 100%, Exchange 100%, VC —, DeFi Scanner 57%).


Technology Grade: 46.67% (Activity 51%, Repository 72%, Collaboration 60%, Security 20%, DeFi Scanner 57%).


Catalysts That Skew Bullish for Price Prediction

  • Institutional and retail access expands with ETFs, listings, and integrations
  • Macro tailwinds from lower real rates and improving liquidity
  • Product or roadmap milestones such as upgrades, scaling, or partnerships
  • These factors could push LTC toward higher price prediction targets

Risks That Skew Bearish for Price Prediction

  • Macro risk-off from tightening or liquidity shocks
  • Regulatory actions or infrastructure outages
  • Concentration in validator economics and competitive displacement
  • These factors could push LTC toward lower price prediction scenarios

Where to get deeper research and insights?

For comprehensive Litecoin ratings, on-chain analysis, AI-powered price forecasts, and trading signals, go to Token Metrics.

FAQs: Litecoin Price Prediction

What is LTC used for?

Primary use cases include fast peer-to-peer payments, low-cost remittances, and exchange settlement/liquidity pairs. LTC holders primarily pay transaction fees and support miner incentives. Adoption depends on active addresses and payment integrations, which directly impact long-term price prediction models.

What price could LTC reach in the moon case price prediction?

Moon case price predictions range from $159.79 at 8T to $539.92 at 31T total crypto market cap. These price prediction scenarios require maximum market cap expansion and strong adoption dynamics. Not financial advice.

What is the 2027 Litecoin price prediction?

Based on Token Metrics analysis, the 2027 price prediction for Litecoin centers around $75 in the base case under current market conditions, with a range between $35 and $160 depending on market scenarios. Bullish price predictions range from $137.79 to $539.92 across different total crypto market cap environments.

Can LTC reach $500 according to price predictions?

According to our price prediction models, LTC could reach $500+ in the 31T moon case where it projects to $539.92. This price prediction outcome requires significant crypto market expansion (31 trillion total market cap) combined with strong Litecoin network adoption. Not financial advice.

How does Litecoin's price prediction compare to Bitcoin?

While Litecoin was designed as "silver to Bitcoin's gold," its price prediction typically reflects a fraction of Bitcoin's value due to lower market cap and adoption. However, LTC often benefits from Bitcoin rallies while offering faster transaction times, which can impact relative price performance during payment-focused adoption cycles.


Next Steps

Track live grades and signals: Token Details 

Buy LTC on MEXC

Disclosure

Educational purposes only, not financial advice. Crypto is volatile, do your own research and manage risk.

Choose from Platinum, Gold, and Silver packages
Reach with 25–30% open rates and 0.5–1% CTR
Craft your own custom ad—from banners to tailored copy
Perfect for Crypto Exchanges, SaaS Tools, DeFi, and AI Products