Back to blog
Research

Top Optimistic Rollups & L2 Ecosystems (2025)

Discover the top optimistic rollups and OP Stack L2s for 2025 with in-depth comparisons, decision guides, and methodology. Learn which L2 fits your DeFi, NFT, or consumer needs with trustworthy research.
Token Metrics Team
13 min read
Want Smarter Crypto Picks—Free?
See unbiased Token Metrics Ratings for BTC, ETH, and top alts.
Thank you! Your submission has been received!
Oops! Something went wrong while submitting the form.
 No credit card | 1-click unsubscribe

Who this guide is for. Builders, power users, and teams choosing where to deploy or transact on Ethereum-style optimistic rollups and OP Stack L2s in 2025.

Top three picks.

  • Arbitrum One — broadest DeFi depth and mature fraud proofs.
  • OP Mainnet (Optimism) — feature-complete fault proofs, the Superchain standard.
  • Base — OP Stack at scale with strong developer docs and low, predictable fees. (docs.arbitrum.io)

One key caveat. Withdrawals to L1 use a challenge period (~7 days) on optimistic rollups; fast bridges can bypass with extra trust/cost. (docs.arbitrum.io)


Introduction: Why Optimistic Rollups & L2 Ecosystems Matter in November 2025

Optimistic rollups are L2 networks that post transaction data to Ethereum and assume validity unless challenged via fraud (fault) proofs, enabling cheaper, faster transactions while inheriting Ethereum’s security. They matter now because OP Stack chains have standardized tooling, bridges, and proofs, and multiple ecosystems (Arbitrum, Optimism, Base, Mode, World Chain, Fraxtal, Zora, opBNB, Blast, Metis) have reached scale. Primary keyword: Top Optimistic Rollups. (docs.arbitrum.io)


How We Picked (Methodology & Scoring)

We shortlisted ~20 credible L2s, then scored and selected TOP_N = 10 using official docs for architecture, fees, bridges, and proof status. Third-party datasets were used only for cross-checks.

Scoring Weights (sum = 100):

  • Liquidity — 30%
  • Security (proofs, upgrade path, disclosures) — 25%
  • Coverage (ecosystem depth, tooling) — 15%
  • Costs (fees, DA approach) — 15%
  • UX (bridging, docs) — 10%
  • Support — 5%

Freshness: Last updated November 2025. (docs.optimism.io)


Notes: “Typical fees” reflect L2 execution + L1 data costs; withdraws to L1 follow a challenge window on optimistic designs. (docs.arbitrum.io)


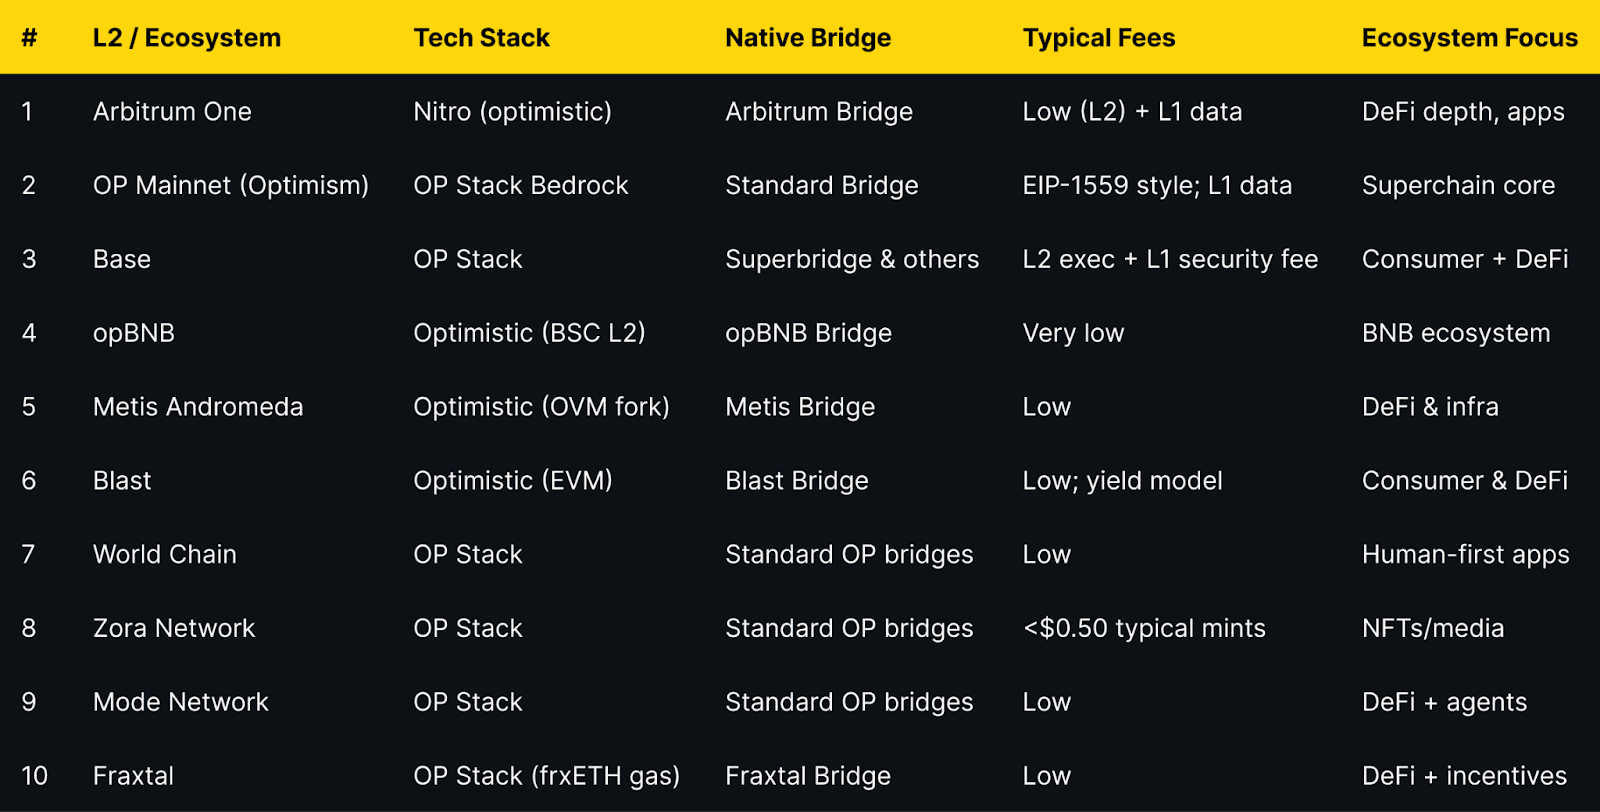
Top 10 Optimistic Rollups & L2 Ecosystems in November 2025

1. Arbitrum One — Best for deep DeFi liquidity

Why Use It. Arbitrum’s Nitro stack delivers mature optimistic security with interactive fraud proofs and broad app coverage. Official docs emphasize the one-week challenge window for L1 withdrawals and support for fast-withdrawal patterns. (docs.arbitrum.io)
Best For. DeFi protocols, power users, market makers.
Notable Features. Fraud-proof system; Nitro throughput; ecosystem depth; L2→L1 fast-withdraw patterns. (docs.arbitrum.io)
Fees Notes. L2 gas + L1 data costs.
Regions. Global (availability depends on wallet/exchange access).
Alternatives. OP Mainnet, Base.  

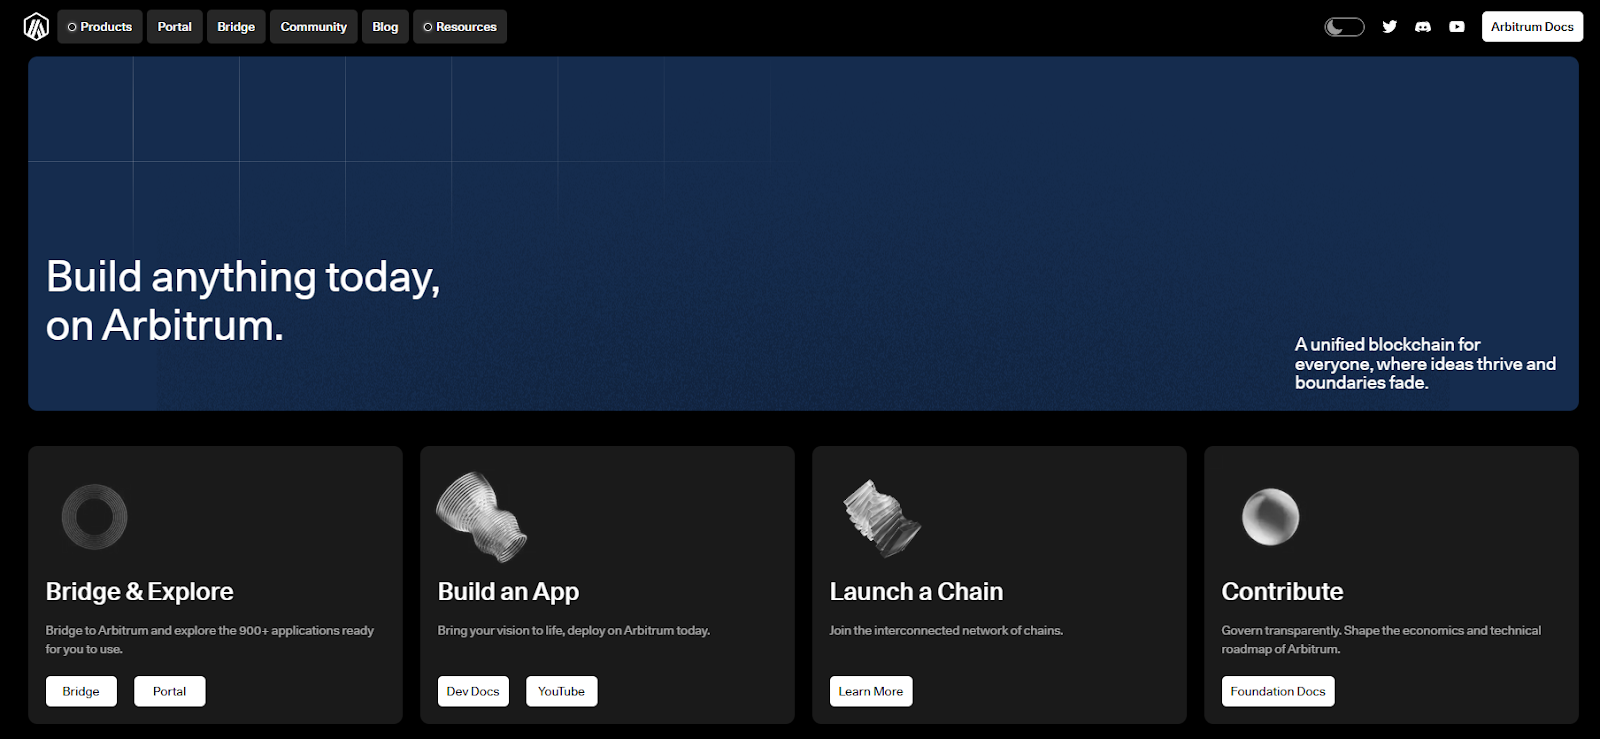
2. OP Mainnet (Optimism) — Best for Superchain standardization

Why Use It. The OP Stack introduced feature-complete fault proofs on June 10, 2024, enabling permissionless challenge of proposed outputs. Fees follow EIP-1559-style mechanics, with Ecotone updates relaying blob base fees. (docs.optimism.io)
Best For. Teams planning multichain OP Stack deployments; public goods alignment.
Notable Features. Standard Bridge; strong docs; Superchain governance. (docs.optimism.io)
Fees Notes. Execution gas as on L1 plus L1 data; EIP-1559 style. (docs.optimism.io)
Regions. Global.
Alternatives. Base, Mode.  

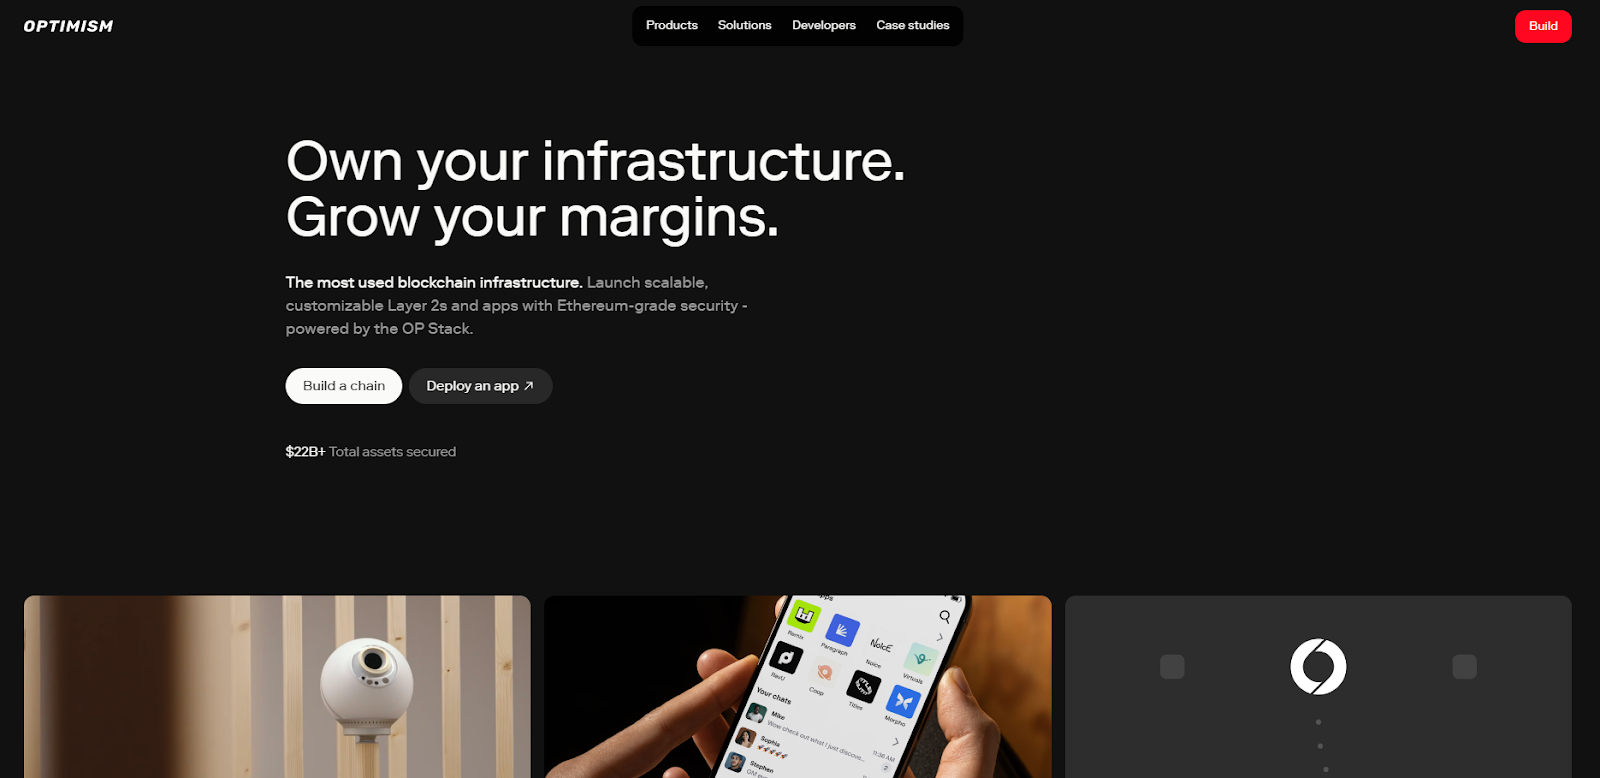
3. Base — Best for builder UX at scale

Why Use It. Base provides clear fee breakdowns (L2 execution + L1 security fee) and robust docs for bridging and development; widely adopted across consumer and DeFi apps. (docs.base.org)
Best For. Consumer apps, gaming, creators, DeFi teams.
Notable Features. OP Stack chain; programmatic bridging examples; security council documentation. (docs.base.org)
Fees Notes. Two-component fee model (L2 + L1). (docs.base.org)
Regions. Global.
Alternatives. OP Mainnet, Arbitrum.  

4. opBNB (BNB Chain) — Best for BNB ecosystem cost sensitivity

Why Use It. opBNB uses an optimistic rollup to scale BNB Smart Chain with very low fees and high throughput for EVM apps. Docs include explicit L1 data fee formulas. (docs.bnbchain.org)
Best For. Cost-sensitive deployments, BNB ecosystem projects.
Notable Features. OP-style architecture; low-fee environment; BNB chain integrations. (docs.bnbchain.org)
Fees Notes. Very low L2 gas; DA fee formula documented. (docs.bnbchain.org)
Regions. Global.
Alternatives. Base, Mode.

5. Metis Andromeda — Best for sequencer decentralization roadmap

Why Use It. Metis is an optimistic rollup emphasizing a decentralized sequencer pool and performance improvements through its Andromeda roadmap. (metis.io)
Best For. Teams valuing sequencer-level resiliency; DeFi infra.
Notable Features. OVM-lineage EVM equivalence; decentralizing sequencer; ecosystem grants. (L2BEAT)
Fees Notes. Low L2 gas; standard optimistic withdrawal window.
Regions. Global.
Alternatives. Arbitrum, OP Mainnet.

6. Blast — Best for native yield design

Why Use It. Blast is an EVM-compatible optimistic rollup with native yield for ETH and stables at the protocol level, while inheriting Ethereum security. (docs.blast.io)
Best For. Consumer apps and DeFi seeking built-in yield flows.
Notable Features. Yield on bridged assets; OP-style architecture; EVM tooling. (L2BEAT)
Fees Notes. Low L2 gas; standard optimistic withdrawal semantics.
Regions. Global.
Alternatives. Base, Mode.

7. World Chain — Best for human-centric apps

Why Use It. Built on the OP Stack, World Chain prioritizes verified human users with gas allowances and personhood-aware UX, suitable for consumer on-ramps and identity-heavy apps. (docs.world.org)
Best For. Identity-centric consumer apps, payments.
Notable Features. OP Stack standardization; personhood primitives; Superchain membership. (L2BEAT)
Fees Notes. Low L2 gas; standard OP Stack bridging/withdrawals.
Regions. Global.
Alternatives. Base, OP Mainnet.

8. Zora Network — Best for creators & NFTs

Why Use It. Zora is an OP Stack L2 focused on media/NFTs, with docs citing typical NFT mint costs under $0.50 and clear OP Stack security inheritance. (zora.energy)
Best For. NFT marketplaces, media apps, creator tools.
Notable Features. Flat mint fees for collectors; OP Stack tooling; creator-first ecosystem. (docs.growthepie.xyz)
Fees Notes. Low, NFT-friendly fees; network fees apply. (zora.energy)
Regions. Global.
Alternatives. Base, Blast.

9. Mode Network — Best for DeFi + agentic apps

Why Use It. Mode is an OP Stack L2 positioned as a DeFi and agent economy hub, aligning to the Superchain and contributing sequencer fees to OP Collective. (docs.mode.network)
Best For. DeFi protocols, AI/agentic apps.
Notable Features. OP Stack mainnet configuration; Superchain integrations; incentives. (docs.mode.network)
Fees Notes. Low L2 gas; standard OP Stack bridging/withdrawals.
Regions. Global.
Alternatives. OP Mainnet, Base.

10. Fraxtal — Best for DeFi incentives & frxETH gas

Why Use It. Fraxtal is an OP Stack L2 with frxETH as gas and modular DA; official docs cover bridge support and OP Stack compatibility. (docs.frax.finance)
Best For. DeFi protocols leveraging blockspace incentives and ETH-centric gas.
Notable Features. OP Stack; frxETH gas; Flox incentives; native bridge. (Frax)
Fees Notes. Low L2 gas; standard OP Stack withdrawal semantics.
Regions. Global.
Alternatives. Mode, OP Mainnet.


Decision Guide: Best By Use Case


How to Choose the Right Optimistic Rollup (Checklist)

  • Region eligibility for your users and app store distribution.
  • Fraud/fault proofs live and documented; withdrawal challenge period understood. (docs.optimism.io)
  • Data availability costs and L1 data fee exposure. (docs.optimism.io)
  • Bridge UX: native vs third-party, fast-withdraw options. (docs.optimism.io)
  • Sequencer model and roadmap to decentralization. (metis.io)
  • Fees transparency (L2 execution + L1 security fee). (docs.base.org)
  • Official docs, status, and upgrade cadence. (docs.optimism.io)
  • Ecosystem fit (DeFi, NFTs, consumer, identity).
  • Support channels, incident response, and disclosures.
  • Red flags: unclear proofs, opaque bridges, or abandoned docs.

Use Token Metrics With Any Optimistic Rollup

  • AI Ratings to screen assets by quality and momentum.


  • Narrative Detection to spot early theme shifts across ecosystems.
  • Portfolio Optimization to balance risk across L1/L2 exposure.
  • Alerts & Signals to time entries/exits as fees and activity shift.

Start free trial to screen assets and time entries with AI.  


Security & Compliance Tips

  • Prefer official standard bridges when possible; understand trust trade-offs of fast bridges. (docs.optimism.io)
  • Expect a ~7-day withdrawal window on optimistic rollups; plan treasury ops accordingly. (docs.arbitrum.io)
  • Verify contract addresses on official explorers/docs before bridging. (docs.base.org)
  • Monitor L1 data fee swings during high Ethereum congestion. (docs.optimism.io)
  • Review sequencer centralization and posted upgrade paths. (metis.io)
  • Keep seed/MPC practices high-hygiene; use hardware where possible.
  • {This article is for research/education, not financial advice.}

Beginner Mistakes to Avoid

  • Ignoring the challenge window and expecting instant L1 finality. (docs.arbitrum.io)
  • Bridging via unofficial URLs; always verify official docs. (docs.base.org)
  • Underestimating L1 data fees during network spikes. (docs.optimism.io)
  • Choosing an L2 without considering ecosystem fit (DeFi vs NFTs vs identity).
  • Deploying without reading security/proofs and upgrade notes. (docs.optimism.io)
  • Skipping incident/status pages and disclosures.

How We Picked (Methodology & Scoring)

  • Liqudity (30%) — adoption and app depth.
  • Security (25%) — proofs live, challenge periods, sequencer posture.
  • Coverage (15%) — ecosystem tooling, bridges.
  • Costs (15%) — fee transparency and DA approach.
  • UX (10%) — docs, onboarding, explorers, tooling.
  • Support (5%) — responsiveness and clarity.

We relied on official provider docs for architecture, fees, and bridges, cross-checking details where prudent. Last updated November 2025. (docs.optimism.io)


FAQs

What is an optimistic rollup?
 An L2 that posts transaction data to Ethereum and assumes validity unless challenged via fraud/fault proofs, cutting fees while inheriting L1 security. (docs.arbitrum.io)

How long do withdrawals take?
 Native L2→L1 withdrawals on optimistic designs include a challenge window (~7 days); fast bridges can provide liquidity sooner with additional trust/cost. (docs.arbitrum.io)

Why are fees sometimes higher?
 Your cost = L2 execution fee + L1 data fee; L1 data fees fluctuate with Ethereum demand and blob/base fee dynamics. (docs.base.org)

Is OP Stack the “standard” for OP-style chains?
 Yes, the OP Stack is the public-goods framework for OP-style L2s and Superchain members (e.g., OP Mainnet, Base, Mode, World Chain, Zora, Fraxtal). (docs.optimism.io)

What’s special about opBNB?
 It brings optimistic rollup design to the BNB ecosystem with very low fees and BSC alignment. (docs.bnbchain.org)

Which L2 is best for NFTs and creators?
 Zora Network is OP Stack-based and optimized for media/NFT mints with sub-$0.50 typical costs. (zora.energy)


Conclusion + Related Reads

If you want DeFi depth, start with Arbitrum or Base. For Superchain standardization and OP-native tooling, OP Mainnet and Mode are strong defaults. Creator projects should consider Zora, identity-centric apps World Chain, and yield-aware consumer apps Blast. For BNB-aligned deployments, opBNB offers ultra-low fees.

Related Reads (Token Metrics):

Build Smarter Crypto Apps &
AI Agents in Minutes, Not Months
Real-time prices, trading signals, and on-chain insights all from one powerful API.
Grab a Free API Key
About Token Metrics
Token Metrics: AI-powered crypto research and ratings platform. We help investors make smarter decisions with unbiased Token Metrics Ratings, on-chain analytics, and editor-curated “Top 10” guides. Our platform distills thousands of data points into clear scores, trends, and alerts you can act on.
30 Employees
analysts, data scientists, and crypto engineers
Daily Briefings
concise market insights and “Top Picks”
Transparent & Compliant
Sponsored ≠ Ratings; research remains independent
Want Smarter Crypto Picks—Free?
See unbiased Token Metrics Ratings for BTC, ETH, and top alts.
Thank you! Your submission has been received!
Oops! Something went wrong while submitting the form.
 No credit card | 1-click unsubscribe
Token Metrics Team
Token Metrics Team

Recent Posts

Research

Shiba Inu Price Prediction 2027: SHIB Forecast & Risk Warning

Token Metrics Team
6 min read

Shiba Inu Price Prediction: Understanding SHIB's Speculative Nature

Shiba Inu operates as a community-driven meme token where price action stems primarily from social sentiment, attention cycles, and speculative trading rather than fundamental value drivers. SHIB exhibits extreme volatility with no defensive characteristics or revenue-generating mechanisms typical of utility tokens. Token Metrics price prediction scenarios below provide technical price forecasts across different market cap environments, though meme tokens correlate more strongly with viral trends and community engagement than systematic market cap models. Positions in SHIB should be sized as high-risk speculative bets with potential for total loss.


Disclosure

Educational purposes only, not financial advice. Crypto is volatile, do your own research and manage risk.

How to read this price prediction:

Each band blends cycle analogues and market-cap share math with TA guardrails. Base assumes steady adoption and neutral or positive macro. Moon layers in a liquidity boom. Bear assumes muted flows and tighter liquidity. For meme tokens, actual price prediction outcomes depend heavily on social trends and community momentum beyond what market cap models capture.

TM Agent baseline:

Token Metrics TM Grade is 24.1%, Sell, with a bearish trading signal. The concise 12‑month numeric price prediction view centers between $0.000005 and $0.000035, with a base case price target near $0.000012.

TM Agent numeric view: scenarios center roughly between $0.000005 and $0.000035, with a base case near $0.000012.

Live details: Token Details 

Key Takeaways for SHIB Price Prediction

  • Highly speculative asset driven by sentiment and attention rather than fundamentals
  • Scenario driven: price prediction outcomes hinge on total crypto market cap and viral momentum
  • Extreme volatility characteristic - SHIB can experience double-digit percentage moves daily
  • TM Agent gist: Bearish short term, price prediction range $0.000005–$0.000035
  • Entertainment risk only, not financial advice

Shiba Inu Price Prediction: Scenario Analysis

Token Metrics price prediction scenarios provide technical price bands across market cap tiers:

8T Market Cap Price Prediction:

At 8 trillion total crypto market cap, SHIB price prediction projects to $0.041998 (bear), $0.042366 (base), and $0.042734 (moon).

16T Market Cap Price Prediction:

At 16 trillion total crypto market cap, SHIB price forecast projects to $0.043973 (bear), $0.045077 (base), and $0.046182 (moon).

23T Market Cap Price Prediction:

At 23 trillion total crypto market cap, SHIB price prediction projects to $0.045948 (bear), $0.047789 (base), and $0.049629 (moon).

  31T Market Cap Price Prediction:

At 31 trillion total crypto market cap, SHIB price prediction projects to $0.047923 (bear), $0.051050 (base), and $0.051307 (moon).

 These technical price prediction ranges assume meme tokens maintain market cap share proportional to overall crypto growth. Actual outcomes for speculative tokens typically exhibit higher variance and stronger correlation to social trends than these price prediction models predict.

What Is Shiba Inu?

Shiba Inu is a meme-born crypto project that centers on community and speculative culture. Unlike utility tokens with specific use cases, SHIB operates primarily as a speculative asset and community symbol. The project focuses on community engagement and entertainment value.

SHIB has demonstrated viral moments and community loyalty within the broader meme token category. The token trades on community sentiment and attention cycles more than fundamentals. Market performance depends heavily on social media attention and broader meme coin cycles.

Risks That Skew Bearish for Price Prediction

  • Extreme volatility from pure sentiment-driven price action with no fundamental support
  • Attention cycles shift rapidly, leaving early viral tokens abandoned as new memes emerge
  • Liquidity can evaporate quickly during downturns, creating severe slippage and exit difficulty
  • Regulatory scrutiny may target meme tokens as securities or gambling instruments
  • Macro risk-off environments hit speculative assets hardest, with meme coins showing largest drawdowns
  • Community fragmentation or developer abandonment can eliminate remaining narrative support
  • These factors could push SHIB price predictions toward the lower bear scenarios

Make Your Next Move with Token Metrics

Token Metrics provides technical analysis, scenario math, price prediction models, and rigorous risk evaluation for hundreds of crypto tokens. Want to dig deeper? Explore our powerful AI-powered ratings and scenario tools here.

FAQs: Shiba Inu Price Prediction

Will SHIB 10x from here according to price predictions?

At current price of $0.041027, a 10x reaches $0.41027. This level does not appear in any of the listed bear, base, or moon price prediction scenarios across 8T, 16T, 23T, or 31T tiers. Meme tokens can 10x rapidly during viral moments but can also lose 90%+ just as quickly. Position sizing for potential total loss is critical. Not financial advice.

What are the biggest risks to SHIB price predictions?

Primary risks include attention shifting to newer memes, community fragmentation, developer abandonment, regulatory crackdowns, and liquidity collapse during downturns. Unlike utility tokens with defensive characteristics, SHIB has zero fundamental floor. Price can approach zero if community interest disappears. Total loss is a realistic outcome that price prediction models cannot fully account for. Not financial advice.

What is the 2027 Shiba Inu price prediction?

Based on Token Metrics analysis, the 2027 price prediction for SHIB centers around $0.000012 in the base case under current market conditions. However, meme token price predictions are highly unreliable due to extreme dependence on social trends, viral cycles, and community sentiment that can change rapidly. These technical price prediction ranges should be viewed with extreme caution.

Can SHIB reach $0.01 according to price predictions?

Based on the price prediction scenarios across all market cap tiers (8T-31T), SHIB projections range from $0.041998 to $0.051307. While these technical price predictions show SHIB trading above $0.04, the extreme volatility and sentiment-driven nature of meme tokens means actual outcomes can vary dramatically from model projections. Not financial advice.


Next Steps

Track live data: Token Details

• Consider fundamental crypto assets with utility and defensive characteristics rather than pure speculation.

Disclosure

Educational purposes only, not financial advice. SHIB is a highly speculative asset with extreme volatility and high risk of total loss. Meme tokens operate as entertainment and gambling instruments rather than investments. Only allocate capital you can afford to lose entirely. Do your own research and manage risk appropriately.

Research

WhiteBIT Coin Price Prediction 2028: $40-$272 Target Analysis

Token Metrics Team
7 min read

WhiteBIT Coin Price Prediction: Portfolio Context for WBT in the 2028 Landscape

Exchange tokens like WhiteBIT Coin offer leveraged exposure to overall market activity, creating concentration risk around a single platform's success. While WBT can deliver outsized returns during bull markets with high trading volumes, platform-specific risks like regulatory action, security breaches, or competitive displacement amplify downside exposure. Portfolio theory suggests balancing such concentrated bets with broader sector exposure.

The price prediction scenarios below show how WBT might perform across different crypto market cap environments. Rather than betting entirely on WhiteBIT Coin's exchange succeeding, diversified strategies blend exchange tokens with L1s, DeFi protocols, and infrastructure plays to capture crypto market growth while mitigating single-platform risk.

The Case for Diversified Index Exposure

Portfolio theory teaches that diversification is the only free lunch in investing. WBT concentration violates this principle by tying your crypto returns to one protocol's fate. Token Metrics Indices blend WhiteBIT Coin with the top one hundred tokens, providing broad exposure to crypto's growth while smoothing volatility through cross-asset diversification. This approach captures market-wide tailwinds without overweighting any single point of failure.

Systematic rebalancing within index strategies creates an additional return source that concentrated positions lack. As some tokens outperform and others lag, regular rebalancing mechanically sells winners and buys laggards, exploiting mean reversion and volatility. Single-token holders miss this rebalancing alpha and often watch concentrated gains evaporate during corrections while index strategies preserve more gains through automated profit-taking.

Beyond returns, diversified indices improve the investor experience by reducing emotional decision-making. Concentrated WBT positions subject you to severe drawdowns that trigger panic selling at bottoms. Indices smooth the ride through natural diversification, making it easier to maintain exposure through full market cycles.

Get Early Acces


Disclosure

Educational purposes only, not financial advice. Crypto is volatile, do your own research and manage risk.

How to read this price prediction:

Each band blends cycle analogues and market-cap share math with TA guardrails. Base assumes steady adoption and neutral or positive macro. Moon layers in a liquidity boom. Bear assumes muted flows and tighter liquidity.

TM Agent baseline:

Token Metrics long term price prediction view for WhiteBIT Coin, cashtag $WBT. Lead metric first, Token Metrics TM Grade is 52.5%, Hold, and the trading signal is bearish, indicating short-term downward momentum. Concise 12-month numeric price prediction view: Token Metrics scenarios center roughly between $10 and $85, with a base case price target near $40.

Live details: Token Details

Key Takeaways for WBT Price Prediction

  • Scenario driven: price prediction outcomes hinge on total crypto market cap; higher liquidity and adoption lift the price bands
  • Single-asset concentration amplifies both upside and downside versus diversified approaches
  • Fundamentals: Fundamental Grade 52.35% (Community 82%, Tokenomics 60%, Exchange 50%, VC —, DeFi Scanner N/A)
  • TM Agent gist: Bearish momentum, 12-month price prediction range $10 to $85
  • Education only, not financial advice

WhiteBIT Coin Price Prediction: Scenario Analysis

Token Metrics price prediction scenarios span four market cap tiers, each representing different levels of crypto market maturity and liquidity:

8T Market Cap Price Prediction:

At an 8 trillion dollar total crypto market cap, WBT price prediction projects to $54.50 in bear conditions, $64.88 in the base case, and $75.26 in bullish scenarios.

16T Market Cap Price Prediction:

Doubling the market to 16 trillion expands the price prediction range to $78.61 (bear), $109.75 (base), and $140.89 (moon).

23T Market Cap Price Prediction:

At 23 trillion, the price forecast scenarios show $102.71, $154.61, and $206.51 respectively.

31T Market Cap Price Prediction:

In the maximum liquidity scenario of 31 trillion, WBT price prediction could reach $126.81 (bear), $199.47 (base), or $272.13 (moon).


These price prediction ranges illustrate potential outcomes for concentrated WBT positions, but investors should weigh whether single-asset exposure matches their risk tolerance or whether diversified strategies better suit their objectives.

What Is WhiteBIT Coin?

WhiteBIT Coin is the native exchange token associated with the WhiteBIT ecosystem. It is designed to support utility on the platform and related services.

WBT typically provides fee discounts and ecosystem benefits where supported. Usage depends on exchange activity and partner integrations.

Token Metrics AI Analysis for Price Prediction

Token Metrics AI provides comprehensive context on WhiteBIT Coin's positioning and challenges that inform our price prediction models.

Vision: The stated vision for WhiteBIT Coin centers on enhancing user experience within the WhiteBIT exchange ecosystem by providing tangible benefits such as reduced trading fees, access to exclusive features, and participation in platform governance or rewards programs. It aims to strengthen user loyalty and engagement by aligning token holders' interests with the exchange's long-term success. While not positioned as a decentralized protocol token, its vision reflects a broader trend of exchanges leveraging tokens to build sustainable, incentivized communities.

Problem: Centralized exchanges often face challenges in retaining active users and differentiating themselves in a competitive market. Users may be deterred by high trading fees, limited reward mechanisms, or lack of influence over platform developments. WhiteBIT Coin aims to address these frictions by introducing a native incentive layer that rewards participation, encourages platform loyalty, and offers cost-saving benefits. This model seeks to improve user engagement and create a more dynamic trading environment on the WhiteBIT platform.

Solution: WhiteBIT Coin serves as a utility token within the WhiteBIT exchange, offering users reduced trading fees, staking opportunities, and access to special events such as token sales or airdrops. It functions as an economic lever to incentivize platform activity and user retention. While specific governance features are not widely documented, such tokens often enable voting on platform upgrades or listing decisions. The solution relies on integrating the token deeply into the exchange's operational model to ensure consistent demand and utility for holders.

Market Analysis: Exchange tokens like WhiteBIT Coin operate in a competitive landscape led by established players such as Binance Coin (BNB) and KuCoin Token (KCS). While BNB benefits from a vast ecosystem including a launchpad, decentralized exchange, and payment network, WBT focuses on utility within its native exchange. Adoption drivers include the exchange's trading volume, security track record, and the attractiveness of fee discounts and staking yields. Key risks involve regulatory pressure on centralized exchanges and competition from other exchange tokens that offer similar benefits.

Fundamental Snapshot from Token Metrics

Fundamental Grade: 52.35% (Community 82%, Tokenomics 60%, Exchange 50%, VC —, DeFi Scanner N/A).


Catalysts That Skew Bullish for Price Prediction

  • Institutional and retail access expands with ETFs, listings, and integrations
  • Macro tailwinds from lower real rates and improving liquidity
  • Product or roadmap milestones such as upgrades, scaling, or partnerships
  • These factors could push WBT toward higher price prediction targets

Risks That Skew Bearish for Price Prediction

  • Macro risk-off from tightening or liquidity shocks
  • Regulatory actions or infrastructure outages
  • Concentration in validator economics and competitive displacement
  • Protocol-specific execution risk and competitive pressure from alternatives
  • These factors could push WBT toward lower price prediction scenarios

FAQs: WhiteBIT Coin Price Prediction

Can WBT reach $100 according to price predictions?

Based on the price prediction scenarios, WBT could reach $100 in the 16T base case. The 16T tier projects $109.75 in the base case price forecast. Achieving this price prediction requires both broad market cap expansion and WhiteBIT Coin maintaining competitive position. Not financial advice.

What's the risk/reward profile for WBT price prediction?

Risk and reward in our price prediction model span from $54.50 in the lowest bear case to $272.13 in the highest moon case. Downside risks include regulatory actions and competitive displacement, while upside drivers include expanding access and favorable macro liquidity. Concentrated positions amplify both tails, while diversified strategies smooth outcomes.

What gives WBT value and impacts price predictions?

WBT accrues value through fee discounts, staking rewards, access to special events, and potential participation in platform programs. Demand drivers include exchange activity, user growth, and security reputation. While these fundamentals matter for price predictions, diversified portfolios capture value accrual across multiple tokens rather than betting on one protocol's success.

What is the 2028 WhiteBIT Coin price prediction?

Based on Token Metrics analysis, the 2028 price prediction for WhiteBIT Coin centers around $40 in the base case under current market conditions, with a range between $10 and $85 depending on market scenarios. Bullish price predictions range from $64.88 to $272.13 across different total crypto market cap environments.

Can WBT reach $200 by 2028?

According to our price prediction models, WBT could reach $200 in the 23T moon case ($206.51) and in the 31T scenarios where the base case is $199.47 and the moon case is $272.13. These price prediction outcomes require significant crypto market expansion and WhiteBIT maintaining strong competitive positioning. Not financial advice.


Next Steps

Disclosure

Educational purposes only, not financial advice. Crypto is volatile, concentration amplifies risk, and diversification is a fundamental principle of prudent portfolio construction. Do your own research and manage risk appropriately.

Research

Predicting Litecoin Price in 2027: Scenario Analysis & On-Chain Scores

Token Metrics Team
6 min read

Litecoin Price Prediction Framework: Market Cap Scenarios & 2027 Forecast

Layer 1 tokens capture value through transaction fees and miner economics. Litecoin processes blocks every 2.5 minutes using Proof of Work, targeting fast, low-cost payments. The price prediction scenarios below model LTC outcomes across different total crypto market sizes, reflecting network adoption and transaction volume.


Disclosure

Educational purposes only, not financial advice. Crypto is volatile, do your own research and manage risk.

How to read this price prediction:

Each band blends cycle analogues and market-cap share math with TA guardrails. Base assumes steady adoption and neutral or positive macro. Moon layers in a liquidity boom. Bear assumes muted flows and tighter liquidity.

TM Agent baseline:

Token Metrics price prediction scenarios center roughly between $35 and $160, with a base case price target near $75, assuming gradual adoption, occasional retail rotation into major alts, and no major network issues. In a broad crypto rally LTC could test the upper bound price prediction, while in risk-off conditions it would likely drift toward the lower bound.

Live details: Token Details

Key Takeaways for LTC Price Prediction

  • Scenario driven: price prediction outcomes hinge on total crypto market cap; higher liquidity and adoption lift the price bands
  • Fundamentals: Fundamental Grade 83.98% (Community 79%, Tokenomics 100%, Exchange 100%, VC —, DeFi Scanner 57%)
  • Technology: Technology Grade 46.67% (Activity 51%, Repository 72%, Collaboration 60%, Security 20%, DeFi Scanner 57%)
  • TM Agent gist: the TM Grade is 21.8 (Sell), and the trading signal is bearish, indicating short-term downward momentum
  • Education only, not financial advice

Litecoin Price Prediction: Scenario Analysis

Token Metrics price prediction scenarios span four market cap tiers reflecting different crypto market maturity levels:

8T Market Cap Price Prediction:

At an 8 trillion dollar total crypto market cap, LTC price prediction projects to $115.80 in bear conditions, $137.79 in the base case, and $159.79 in bullish scenarios.

16T Market Cap Price Prediction:

At 16 trillion, the price prediction range expands to $154.54 (bear), $220.52 (base), and $286.50 (moon).

23T Market Cap Price Prediction:

The 23 trillion tier price forecast shows $193.28, $303.25, and $413.21 respectively.

31T Market Cap Price Prediction:

In the maximum liquidity scenario at 31 trillion, LTC price prediction reaches $232.03 (bear), $385.98 (base), or $539.92 (moon).


What Is Litecoin?

Litecoin is a peer-to-peer cryptocurrency launched in 2011 as an early Bitcoin fork. It uses Proof of Work with Scrypt and targets faster settlement, processing blocks roughly every 2.5 minutes with low fees.

LTC is the native token used for transaction fees and miner rewards. Its primary utilities are fast, low-cost payments and serving as a testing ground for Bitcoin-adjacent upgrades, with adoption in retail payments, remittances, and exchange trading pairs.

Token Metrics AI Analysis for Price Prediction

Token Metrics AI provides additional context on Litecoin's technical positioning and market dynamics that inform our price prediction models.

Vision: Litecoin's vision is to serve as a fast, low-cost, and accessible digital currency for everyday transactions. It aims to complement Bitcoin by offering quicker settlement times and a more efficient payment system for smaller, frequent transfers.

Problem: Bitcoin's relatively slow block times and rising transaction fees during peak usage make it less ideal for small, frequent payments. This creates a need for a cryptocurrency that maintains security and decentralization while enabling faster and cheaper transactions suitable for daily use.

Solution: Litecoin addresses this by using a 2.5-minute block time and the Scrypt algorithm, which initially allowed broader participation in mining and faster transaction processing. It functions primarily as a payment-focused blockchain, supporting peer-to-peer transfers with low fees and high reliability, without the complexity of smart contract functionality.

Market Analysis: Litecoin operates in the digital payments segment of the cryptocurrency market, often compared to Bitcoin but positioned as a more efficient medium of exchange. While it lacks the smart contract capabilities of platforms like Ethereum or Solana, its simplicity, long-standing network security, and brand recognition give it a stable niche. It competes indirectly with other payment-focused cryptocurrencies like Bitcoin Cash and Dogecoin. Adoption is sustained by its integration across major exchanges and payment services, but growth is limited by the broader shift toward ecosystems offering decentralized applications.

Fundamental and Technology Snapshot from Token Metrics

Fundamental Grade: 83.98% (Community 79%, Tokenomics 100%, Exchange 100%, VC —, DeFi Scanner 57%).


Technology Grade: 46.67% (Activity 51%, Repository 72%, Collaboration 60%, Security 20%, DeFi Scanner 57%).


Catalysts That Skew Bullish for Price Prediction

  • Institutional and retail access expands with ETFs, listings, and integrations
  • Macro tailwinds from lower real rates and improving liquidity
  • Product or roadmap milestones such as upgrades, scaling, or partnerships
  • These factors could push LTC toward higher price prediction targets

Risks That Skew Bearish for Price Prediction

  • Macro risk-off from tightening or liquidity shocks
  • Regulatory actions or infrastructure outages
  • Concentration in validator economics and competitive displacement
  • These factors could push LTC toward lower price prediction scenarios

Where to get deeper research and insights?

For comprehensive Litecoin ratings, on-chain analysis, AI-powered price forecasts, and trading signals, go to Token Metrics.

FAQs: Litecoin Price Prediction

What is LTC used for?

Primary use cases include fast peer-to-peer payments, low-cost remittances, and exchange settlement/liquidity pairs. LTC holders primarily pay transaction fees and support miner incentives. Adoption depends on active addresses and payment integrations, which directly impact long-term price prediction models.

What price could LTC reach in the moon case price prediction?

Moon case price predictions range from $159.79 at 8T to $539.92 at 31T total crypto market cap. These price prediction scenarios require maximum market cap expansion and strong adoption dynamics. Not financial advice.

What is the 2027 Litecoin price prediction?

Based on Token Metrics analysis, the 2027 price prediction for Litecoin centers around $75 in the base case under current market conditions, with a range between $35 and $160 depending on market scenarios. Bullish price predictions range from $137.79 to $539.92 across different total crypto market cap environments.

Can LTC reach $500 according to price predictions?

According to our price prediction models, LTC could reach $500+ in the 31T moon case where it projects to $539.92. This price prediction outcome requires significant crypto market expansion (31 trillion total market cap) combined with strong Litecoin network adoption. Not financial advice.

How does Litecoin's price prediction compare to Bitcoin?

While Litecoin was designed as "silver to Bitcoin's gold," its price prediction typically reflects a fraction of Bitcoin's value due to lower market cap and adoption. However, LTC often benefits from Bitcoin rallies while offering faster transaction times, which can impact relative price performance during payment-focused adoption cycles.


Next Steps

Track live grades and signals: Token Details 

Buy LTC on MEXC

Disclosure

Educational purposes only, not financial advice. Crypto is volatile, do your own research and manage risk.

Choose from Platinum, Gold, and Silver packages
Reach with 25–30% open rates and 0.5–1% CTR
Craft your own custom ad—from banners to tailored copy
Perfect for Crypto Exchanges, SaaS Tools, DeFi, and AI Products