Back to blog
Research

What Are Trading Fees and How Do They Work?

Learn what crypto trading fees are, how they’re calculated, and how to minimize them. Discover how Token Metrics’ AI tools can help you trade smarter and reduce costs.
Token Metrics Team
8 min
Want Smarter Crypto Picks—Free?
See unbiased Token Metrics Ratings for BTC, ETH, and top alts.
Thank you! Your submission has been received!
Oops! Something went wrong while submitting the form.
 No credit card | 1-click unsubscribe

If you’ve ever bought or sold cryptocurrency, you’ve likely noticed that exchanges charge trading fees. While these fees may seem small at first glance, they can add up significantly over time, especially for frequent traders.

Understanding how trading fees work is essential for maximizing your profits and choosing the right platform and strategy. In this guide, we’ll explain what trading fees are, how they’re calculated, the different types of fees, and how Token Metrics can help you minimize costs while optimizing your trades.

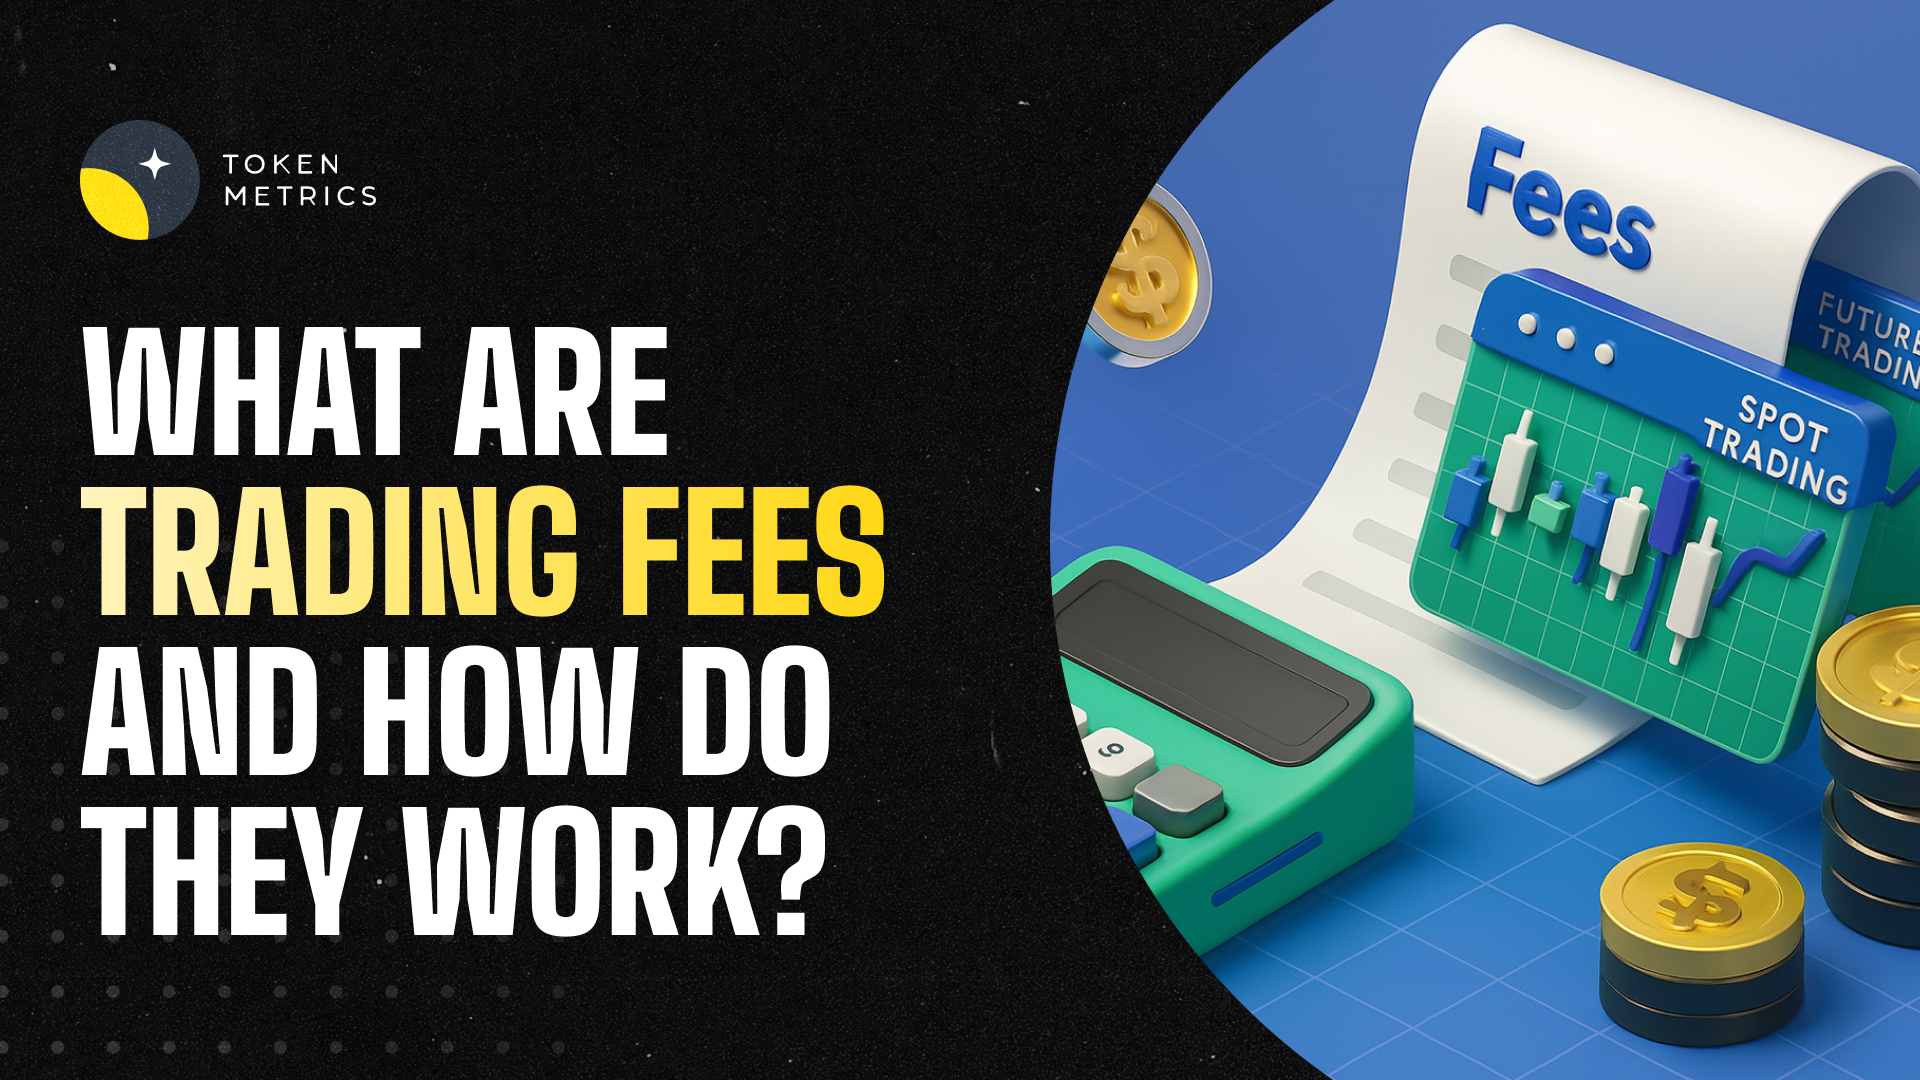
What Are Trading Fees?

Trading fees are charges imposed by cryptocurrency exchanges whenever you execute a trade—whether you’re buying, selling, or swapping digital assets.

  • Purpose:

    • They compensate exchanges for providing liquidity, security, and order-matching services.
    • They discourage spam orders that could overload the exchange.

Example:
If you buy $1,000 worth of Bitcoin with a 0.1% trading fee, you’ll pay $1 in fees for that transaction.

How Are Trading Fees Calculated?

Most crypto exchanges calculate fees based on:

  1. Trade Value (Percentage):

    • The most common model.
    • Fees are a percentage of the total trade amount (e.g., 0.1% per trade).

  2. Flat Fees:

    • Some platforms charge a fixed fee per trade, regardless of trade size.

  3. Tiered Fee Structures:

    • Frequent traders often benefit from lower fees when they reach certain monthly trading volumes.

Maker vs. Taker Fees

Many exchanges use a maker-taker model to incentivize liquidity:

  • Maker Fees:

    • You pay a lower fee (or sometimes nothing) when you add liquidity by placing a limit order that isn’t immediately matched.

  • Taker Fees:

    • You pay a higher fee when you remove liquidity by placing a market order that is filled instantly.

Example:
On Binance, makers might pay 0.08%, while takers pay 0.1%.

Types of Crypto Trading Fees

When trading crypto, you’ll encounter more than just trading fees:

1. Trading (Transaction) Fees

  • Charged when buying or selling crypto.
  • Often range from 0.05%–0.5% depending on the exchange.

2. Deposit Fees

  • Some exchanges charge when funding accounts via credit card, PayPal, or bank transfers.
  • Crypto deposits are typically free.

3. Withdrawal Fees

  • Charged when moving funds off the exchange.
  • Often fixed per withdrawal (e.g., 0.0005 BTC).

4. Network (Gas) Fees

  • Separate from exchange fees, paid to blockchain validators.
  • Ethereum and other networks can have high gas fees during peak demand.

Why Do Trading Fees Matter?

Even small fees can significantly impact your profits, especially if you trade often.

Example:

  • A day trader making 50 trades/month with a 0.1% fee per trade on $1,000 positions will pay $50/month in fees.
  • Over a year, that’s $600 lost to fees—before considering withdrawal or gas costs.

This is why reducing fees is crucial for active traders.

How to Minimize Trading Fees

1. Use Low-Fee Exchanges

Compare platforms—Binance, Bybit, and Kraken often offer competitive rates for high-volume traders.

2. Increase Your Trading Volume

Many exchanges lower fees as your monthly trading volume increases.

3. Use Limit Orders

Save on fees by acting as a maker instead of a taker whenever possible.

4. Pay with Exchange Tokens

Some exchanges offer discounts when fees are paid with their native token (e.g., BNB on Binance).

5. Optimize Your Trading Strategy with AI

Instead of making dozens of small trades, use data-driven insights from Token Metrics to make high-probability trades—reducing overall fee impact.

How Token Metrics Helps You Save on Fees

Token Metrics isn’t an exchange—it’s an AI-powered crypto research and trading platform designed to maximize your profits.

Here’s how it helps with trading fees:

1. AI-Powered Trade Optimization

Token Metrics provides bullish/bearish trading signals based on 80+ technical indicators, helping you enter fewer but higher-quality trades—minimizing unnecessary fees.

2. Trader & Investor Grades

Our proprietary grading system helps you identify top-performing cryptos, reducing guesswork and avoiding costly trial-and-error trading.

3. AI-Managed Indices

Instead of manually rebalancing portfolios (and paying multiple trading fees), use Token Metrics AI-driven crypto indices, which rebalance intelligently while keeping transaction costs low.

4. Narrative Tracking

Our AI detects emerging crypto narratives early, helping you position yourself before the market gets crowded—reducing the need for excessive short-term trading.

Practical Example: Using Token Metrics to Reduce Fees

Imagine you’re trading altcoins manually and make 20 trades/month.

  • At 0.2% per trade on $1,000 positions, you pay $40/month in fees.
  • With Token Metrics AI signals, you cut this down to 8 high-probability trades per month—reducing your fees by 60% while increasing win rates.

This is how data-driven trading saves both money and stress.

Final Thoughts

So, what are trading fees and how do they work? They’re the charges exchanges take for facilitating trades, withdrawals, and transactions—and while they may seem small, they can eat into your profits quickly.

The good news? You can minimize trading fees with the right strategies—and Token Metrics can help.

By providing AI-powered trading signals, long-term Investor Grades, and automated crypto indices, Token Metrics helps you reduce unnecessary trades, make smarter decisions, and maximize your returns—all while minimizing the impact of trading fees.

Whether you’re a beginner or advanced trader, using Token Metrics means trading smarter, not harder.

Build Smarter Crypto Apps &
AI Agents in Minutes, Not Months
Real-time prices, trading signals, and on-chain insights all from one powerful API.
Grab a Free API Key
About Token Metrics
Token Metrics: AI-powered crypto research and ratings platform. We help investors make smarter decisions with unbiased Token Metrics Ratings, on-chain analytics, and editor-curated “Top 10” guides. Our platform distills thousands of data points into clear scores, trends, and alerts you can act on.
30 Employees
analysts, data scientists, and crypto engineers
Daily Briefings
concise market insights and “Top Picks”
Transparent & Compliant
Sponsored ≠ Ratings; research remains independent
Want Smarter Crypto Picks—Free?
See unbiased Token Metrics Ratings for BTC, ETH, and top alts.
Thank you! Your submission has been received!
Oops! Something went wrong while submitting the form.
 No credit card | 1-click unsubscribe
Token Metrics Team
Token Metrics Team

Recent Posts

Research

How Token Metrics Spotted HYPE Before the Breakout — And Why It Matters for Every Crypto Trader

Token Metrics Team
4 min

The crypto market has been a rollercoaster lately.

Bitcoin is dipping. Altcoins are bleeding. Sentiment across the board is skittish. Fear is gripping retail traders — and in times like these, many are unsure where to turn, what to buy, or when to hold back.

But not everyone’s losing.

Some traders are still finding wins. One example? Hyperliquid (HYPE) — a standout performer in April 2025. And here’s the kicker: Token Metrics called the move before it happened.

While most traders were distracted by meme coins or frozen in fear, Token Metrics users were riding a +51.8% breakout, armed with AI-driven insights and data-backed confidence. This blog breaks down what happened, how Token Metrics spotted the trade before the crowd, and what tools you can use today to find the next HYPE-level breakout before it happens.

The Hyperliquid Surge: What Happened?

On April 14, while much of Crypto Twitter was silent on HYPE, Token Metrics issued a bullish signal on the token. The platform’s AI-powered Trader Grade identified a strong setup forming — based on technical indicators, rising volume, and early momentum shifts.

That signal marked the beginning of a +51.8% price surge, which saw HYPE peak at $38.50 before a broad market correction pulled it back to ~$32.40.

Even with the correction, traders who acted on the early signal locked in solid profits, exited smart, or are now watching for the next move with eyes wide open — guided by grades, not guesswork.

Why Token Metrics Got It Right — When Others Missed It

While most platforms react to price action after it happens, Token Metrics is built to anticipate movement before it’s obvious. Here’s how:

Technical Momentum Detection

The Trader Grade analyzes short-term price action, RSI trends, MACD crossovers, breakout patterns, and dozens of other technical indicators. HYPE’s chart showed tightening consolidation and rising buy volume — and TM’s systems flagged it in real time.

Volume Spike Recognition

One of the earliest clues in any breakout is an uptick in volume. Token Metrics identifies surging liquidity that precedes breakouts — something that traditional screeners miss or catch late.

Narrative Tracking

Hyperliquid was part of a subtle but growing "on-chain perpetuals" narrative — a theme most traders weren’t tracking yet. TM’s AI-powered narrative filters helped surface HYPE as an early player in a trending category.

Signal Strength Confidence

Token Metrics doesn’t just throw out signals randomly. The platform assigns confidence scores based on data quality, historical performance, and AI pattern recognition. HYPE didn’t just look good — it looked statistically strong.

Current Situation: Pullback or Setup?

After topping at $38.50, HYPE retraced — now sitting about 15.8% below its high. Some might see weakness. But Token Metrics helps traders read beyond the price:

  • 📈 Trader Grade still says “Buy” — meaning short-to-mid-term bullish momentum is intact.
  • 🟡 Investor Grade is Neutral — a smart, cautious stance until more long-term data emerges.
  • 🔍 Key Level: $32 — this is the zone bulls need to defend to keep the trend alive.

This context is what makes Token Metrics invaluable. While the crowd panics, TM users stay informed, balanced, and ready.

Token Metrics in Action: Trading with Data, Not Emotion

Let’s zoom out. Why does this matter for your trading journey?

Most traders operate on emotion, social media chatter, or FOMO. Token Metrics flips that model on its head — giving you a complete data-driven crypto trading toolkit:

🧠 AI-Powered Trader Grades

These grades score tokens on a 0–100 scale based on short-term technical momentum. A Trader Grade above 80 often precedes a strong move — as seen with HYPE.

📊 Investor Grades for Long-Term Confidence

Built from 80+ on-chain and off-chain data points — including liquidity, tokenomics, VC backers, exchange listings, community engagement, and developer activity.

📈 Real-Time Market Signals

Get alerted when a new bullish or bearish signal is triggered. These alerts are based on pattern recognition, performance history, and current price action.

🌐 Narrative Filters

Narratives drive price — from DeFi Summer to AI Agent tokens. TM helps you stay on top of evolving themes and find the tokens leading those trends early.

🔔 Alerts & Watchlists

Set custom alerts for grade movements, bold signals, or top gainer movements — so you never miss a trade even when you’re not glued to the screen.

Key Trading Benefits of Using Token Metrics

Let’s break it down: Why use Token Metrics instead of trading blindly?

1. Spot Breakouts Early

Tools like the Market Page and Top Gainers tab help you spot tokens heating up — before they explode. You won’t be the one buying at the top anymore.

2. Avoid FOMO and Bad Buys

TM’s objective grades help filter out low-quality tokens. You can avoid chasing scams or hype-based pumps with no foundation.

3. Simplify Your Research

Instead of spending hours flipping through charts and Twitter threads, Token Metrics gives you instant, high-signal data — all in one place.

4. Trade With Confidence

Whether you’re swing trading or building a long-term bag, the Trader and Investor Grades help validate (or invalidate) your bias.

5. Stay Ahead of Market Rotations

The crypto market rotates fast. Token Metrics surfaces where capital is flowing — and which narratives are gaining strength — so you can rotate with it.

What to Do Next: Trade the Signal, Not the Crowd

Looking ahead, HYPE’s next move depends on what happens at the $32 support zone:

  • ✅ If it holds: there’s room for upside continuation. The Trader Grade supports it.
  • ❌ If it breaks: eyes shift to $25 — a critical support where new buyers may step in.

Either way, Token Metrics users won’t be guessing. They’ll wait for the next signal — bullish or bearish — and make calculated moves based on real data.

This is the difference between reactive trading and strategic trading.

Final Takeaway: Token Metrics Helps You Trade Smarter, Not Harder

The HYPE breakout wasn’t luck. It was the result of acting on strong, data-backed signals before the crowd caught on.

If you’re tired of chasing pumps, panicking in drawdowns, or wondering why others always seem to find winners early, then it's time to level up.

With Token Metrics, you can:

  • 🔍 Spot early movers like HYPE
  • 📊 Trade with AI-powered confidence
  • 📈 Get in before the trend — and exit before the crash
  • 🧠 Make every trade a calculated decision

Ready to Catch the Next HYPE?

Join thousands of traders using Token Metrics to find breakout tokens before they pump.

👉 Explore the platform now at tokenmetrics.com
👉 Get real-time signals, bold alerts, and daily data updates
👉 Trade with structure — not speculation

Because in crypto, the edge goes to the trader with information, not emotion.

Research

Solana Price Action: Will the Bulls Regain Control? Token Metrics Signals Offer Clues

Token Metrics Team
4 min

Solana has been one of the most closely watched altcoins in the 2025 crypto cycle. With its blazing speed, developer activity, and expanding DePIN ecosystem, Solana has remained on every smart investor’s radar. But with the broader market pulling back sharply — and Bitcoin dipping below $105K — traders are asking: Is Solana still a buy?

Token Metrics' AI-powered tools offer critical insights into this volatile moment.

April's Bullish Signal Paid Off
Token Metrics’ proprietary indicator turned bullish on Solana on April 19, when the price was just $138.18. That signal wasn’t just noise. Within a month, Solana surged by 33.1%, reaching $184 by May 23.

This kind of real-time, data-driven signal is exactly why traders are turning to Token Metrics. Rather than guessing or chasing hype, our platform delivers objective, AI-backed alerts that help traders enter early and exit intelligently.

The Pullback: Market-Wide, Not Solana-Specific
Fast forward to today, and the story has changed. Solana is undergoing a major pullback, largely driven by the overall market correction. Bitcoin’s slide below $105K has dragged most altcoins down, Solana included.

However, Token Metrics' Trader Grade for Solana is now 'Neutral' — not bearish. That’s a crucial distinction. While momentum has cooled, our system is not yet signaling a full reversal. That means there’s still room for recovery.

Technical Outlook: The $160 Level is Critical
Technical analysis highlights a key battleground at $160. If bulls can reclaim this level in the near term, the uptrend could resume. Failure to hold above it, however, could open the door for deeper losses.

Token Metrics users can monitor these levels in real-time with our dynamic charts, trend indicators, and updated market signals.

What Traders Should Watch Next

  • Market Signal Shift: If the Token Metrics market signal flips to bearish, it’s a red flag. Until then, volatility may still offer upside.
  • $160 Breakout: This is the technical threshold bulls must defend.
  • Volume and Sentiment: A spike in volume or positive narrative news could signal a reversal.

Conclusion
Solana remains a high-potential asset — but trading it without real-time analytics in this environment is risky. Token Metrics doesn’t just tell you what’s happening; it shows why it’s happening and what to do next.

Join Token Metrics today to access AI-powered trading signals, risk analysis, and the tools to trade crypto like a pro — even in uncertain markets.

Research

Bearish Signals Ahead? How to Spot Early Warnings Before a Crash

Token Metrics Team
4 min

In crypto, everything can change overnight. One minute the market’s bullish — the next, it’s bleeding red. That’s why the ability to spot bearish signals early is crucial for protecting capital and maximizing long-term gains. Token Metrics gives traders an edge with AI-driven alerts that help you act before the crash hits.

Why Most Traders Miss the Top
Retail traders often get caught in the hype. By the time “everyone” is talking about a token, it’s usually too late. The smartest investors are watching subtle changes in data: volume drops, negative sentiment, weakening momentum.

Token Metrics makes those patterns visible before price crashes.

What Is a Bearish Signal on Token Metrics?
A bearish signal is a warning based on:

  • Declining Trader Grade (below 30)
  • Negative ROI since signal
  • Volume drying up while price holds
  • Bearish crossover in trend indicators
  • Weakening fundamentals or fading narratives

These signals are automatically triggered and displayed on the Market Page.

How to Identify Bearish Tokens Early

  1. Sort by Negative ROI – See which tokens have declined most after a bold signal.
  2. Filter by Trader Grade < 30 – These are tokens losing short-term momentum.
  3. Look for Divergence – If price is flat but volume or sentiment drops, the setup may be turning bearish.

Behavioral Clues You Shouldn’t Ignore

  • Signal stops updating – Token Metrics halts signals when confidence fades.
  • Narrative dies down – No more tweets, community quiets down? Trouble ahead.
  • Trending to Stagnant – Tokens drop from Top Gainers list quickly.

Real Example: Avoiding Losses with Signal Data
Ian Balina mentioned how users avoided major losses by exiting weak tokens early thanks to falling grades and bearish signals. Instead of hoping, they acted — preserving capital and rotating into stronger plays like Launch Coin or AI tokens.

What to Do When You See Bearish Signs

  • Don’t panic – Act on data, not emotion.
  • Set stop-losses based on bold signal entry points.
  • Rotate capital into high-grade tokens or stablecoins.
  • Monitor daily – The market can flip from bullish to bearish in hours.

Combining Risk Management with Signals
Token Metrics isn’t just about finding moonshots. It’s also about knowing when not to buy or when to exit early. By using bearish signals, you protect yourself from downside while staying positioned for the next big opportunity.

Conclusion
The best crypto traders aren’t just profit-hunters — they’re risk managers. Bearish signals from Token Metrics help you anticipate weakness, reduce losses, and trade with clarity. In a volatile market, that edge can make all the difference.

Choose from Platinum, Gold, and Silver packages
Reach with 25–30% open rates and 0.5–1% CTR
Craft your own custom ad—from banners to tailored copy
Perfect for Crypto Exchanges, SaaS Tools, DeFi, and AI Products