Token Metrics API

Technology Grade API: Identify Real Innovation and Build Smarter Crypto Apps

Use the Technology Grade API to assess scalability, innovation, and code quality. Copy-paste JS/Python, watch the demo, and build bots, dashboards, and screeners that prioritize real builders.
Sam Monac
7 min
MIN

Hype is loud, but code is what lasts. The Technology Grade API helps you measure the engineering strength behind a token—scalability, innovation, and real code quality—so you can prioritize serious projects in your bots, dashboards, or research tools. In this guide, you’ll query the /v2/technology-grade endpoint, embed the score in your UI, and ship a feature that turns technical due diligence into a single actionable signal. Start by grabbing your key at Get API Key, Run Hello-TM to validate your first call, then Clone a Template to go live fast.

‍

What You’ll Build in 2 Minutes

  • A minimal script that fetches Technology Grade for any symbol via /v2/technology-grade.

  • A copy-paste curl to smoke-test your key.

  • A starter UX pattern: display the headline Technology Grade + component breakdown (scalability, innovation, code quality).

  • Endpoints to add next for full context: /v2/fundamental-grade (business quality), /v2/tm-grade (technicals/sentiment/momentum), /v2/trading-signals (timing), /v2/quantmetrics (risk/return).

Why This Matters

Separate hype from substance. Whitepapers and roadmaps are cheap; shipped code, throughput, and upgrade cadence are not. The Technology Grade API rolls engineering reality into a comparable score so you can rank ecosystems, filter listings, and surface projects with staying power.

Faster diligence, clearer decisions. For bot builders, Technology Grade is an upstream filter that keeps low-quality projects out of your universe. For dashboard builders, it adds credibility—users can see why a project ranks well. And for screeners, it’s a one-score signal that’s easy to sort, badge, and alert on with low latency.

Where to Find 

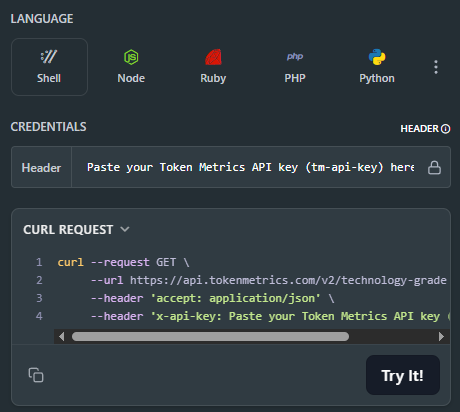
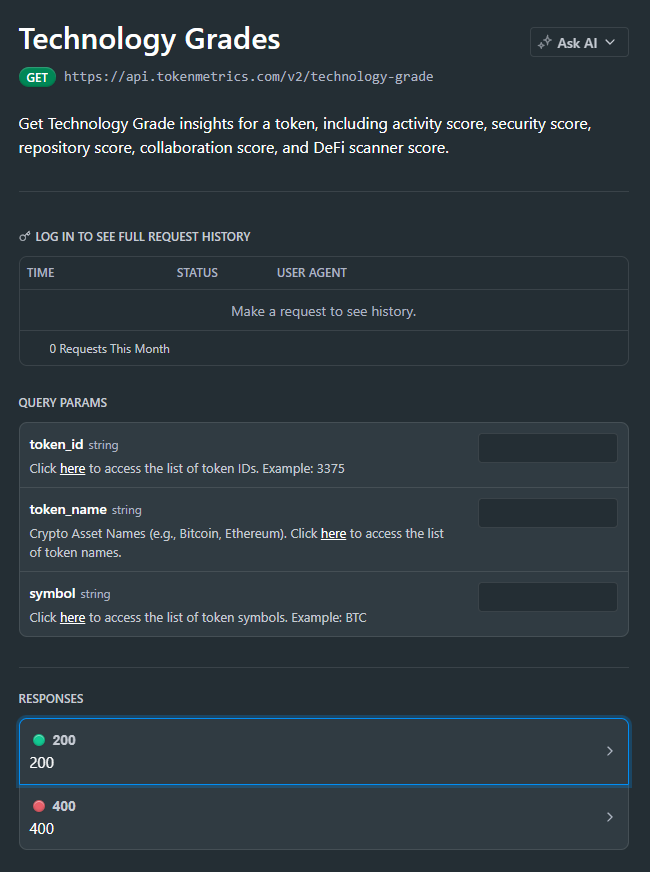
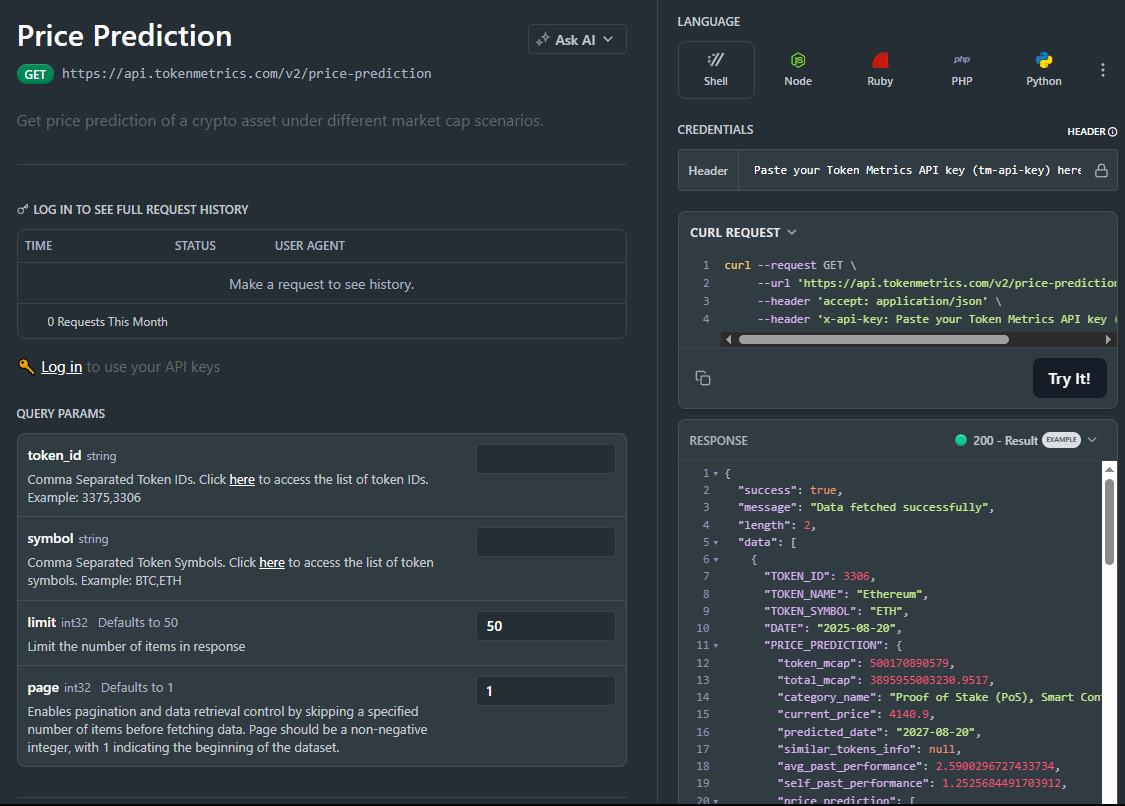
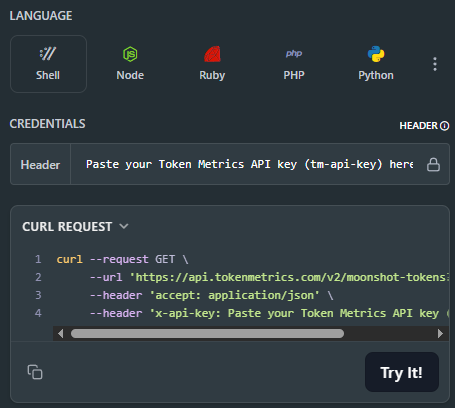
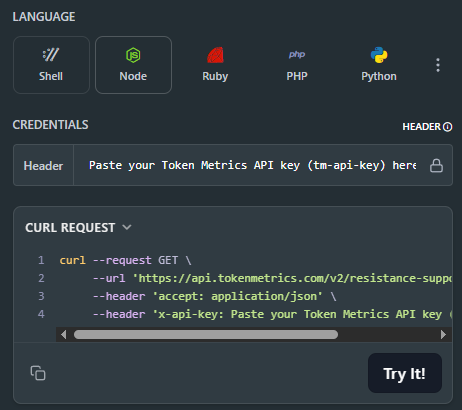
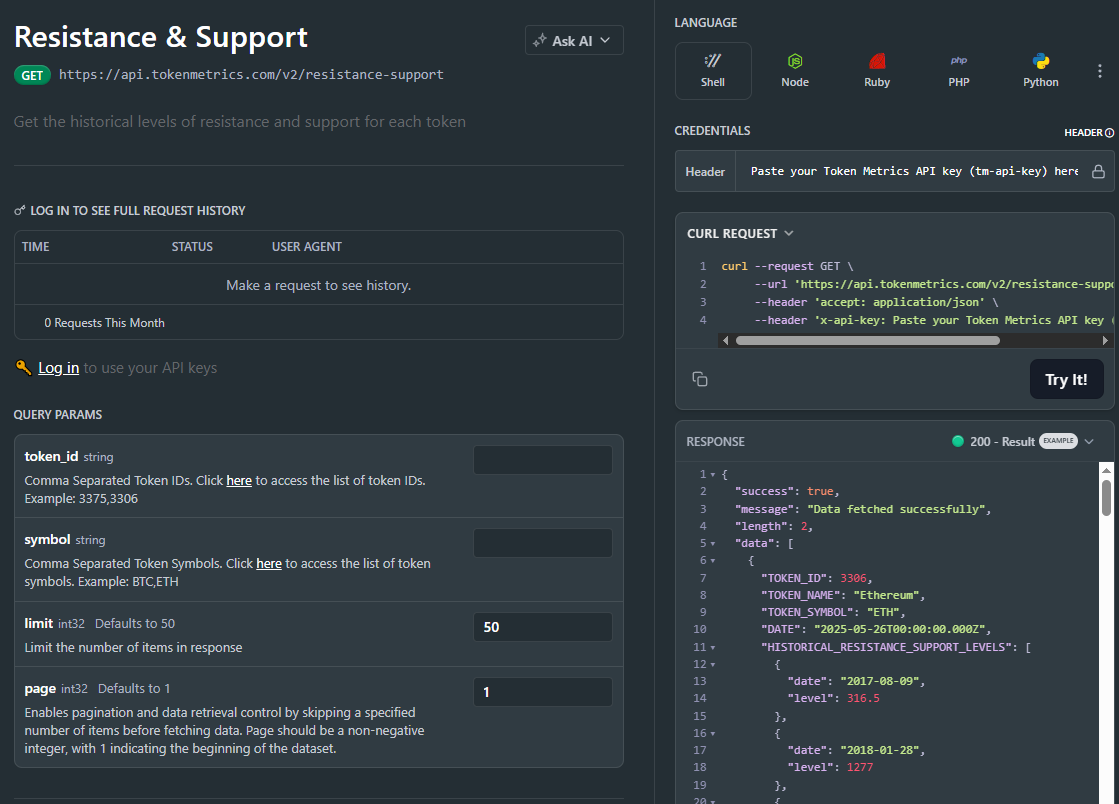
For the Technology Grade information, check the top right of the API Reference. You'll find the cURL request to connect effortlessly.

‍

‍

👉 Next: Get API Key • Run Hello-TM • Clone a Template

Live Demo & Templates

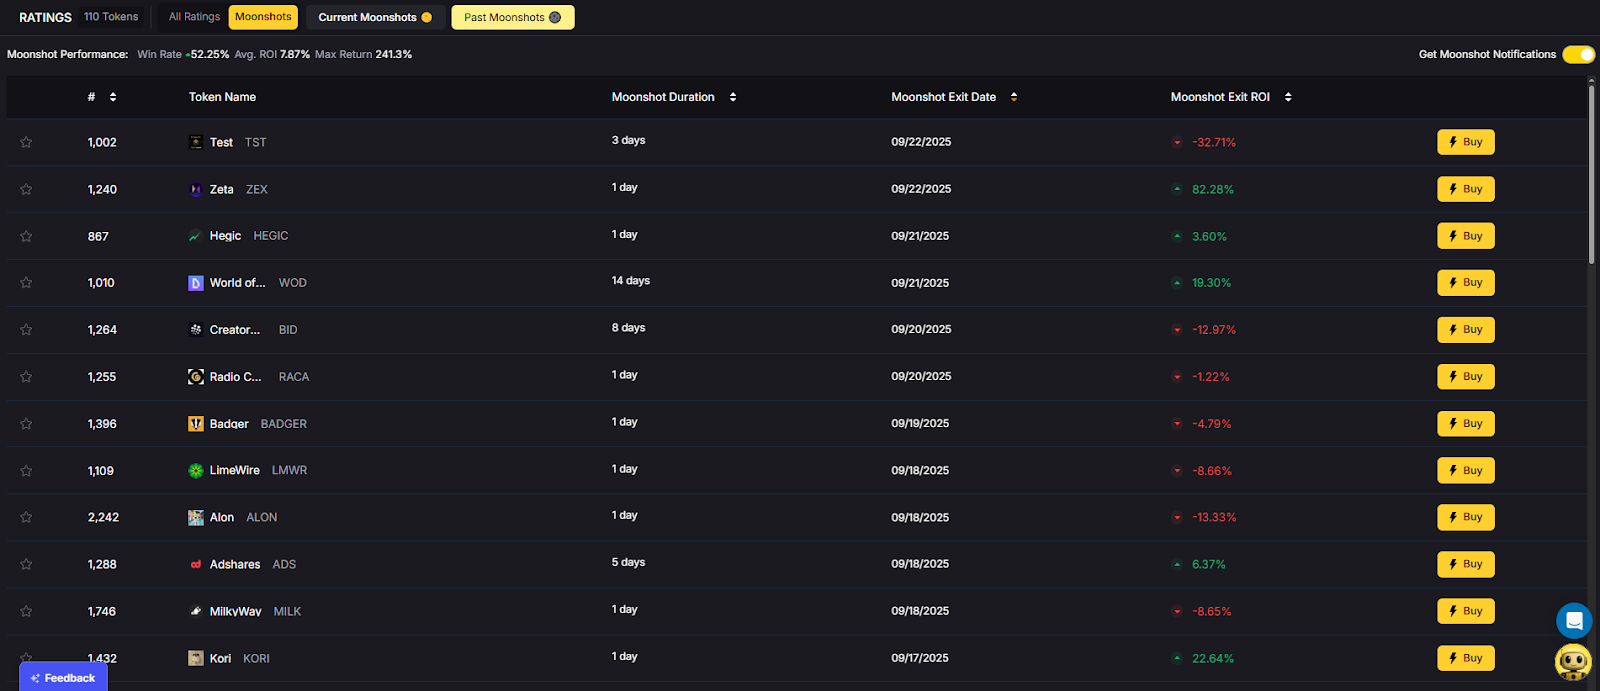
  • Investor/Due-Diligence Token Page: Show a Technology Grade dial with component bars and a “What improved?” changelog snippet.

  • Screener/Leaderboard: Rank by Technology Grade; add sector and market-cap filters; badge “Rising Tech” week-over-week.

  • Bot Universe Filter: Require a minimum Technology Grade before a token is eligible for strategies; combine with signals for entries/exits.

Kick off from quickstarts in the docs—fork a dashboard or screener and deploy. Validate your environment with Run Hello-TM, then scale usage. When you need higher limits and SLAs, compare API plans.

How It Works (Under the Hood)

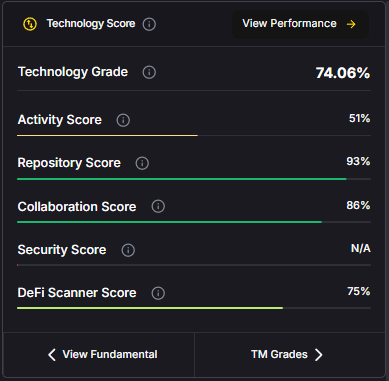
Technology Grade synthesizes engineering-centric evidence—such as throughput/scalability, rate of innovation (feature velocity, upgrade cadence), and code quality (maintainability, robustness cues)—into a normalized score and grade (e.g., Strong / Average / Weak). It’s designed to be comparable across projects and stable enough to inform filters, tiers, and badges.

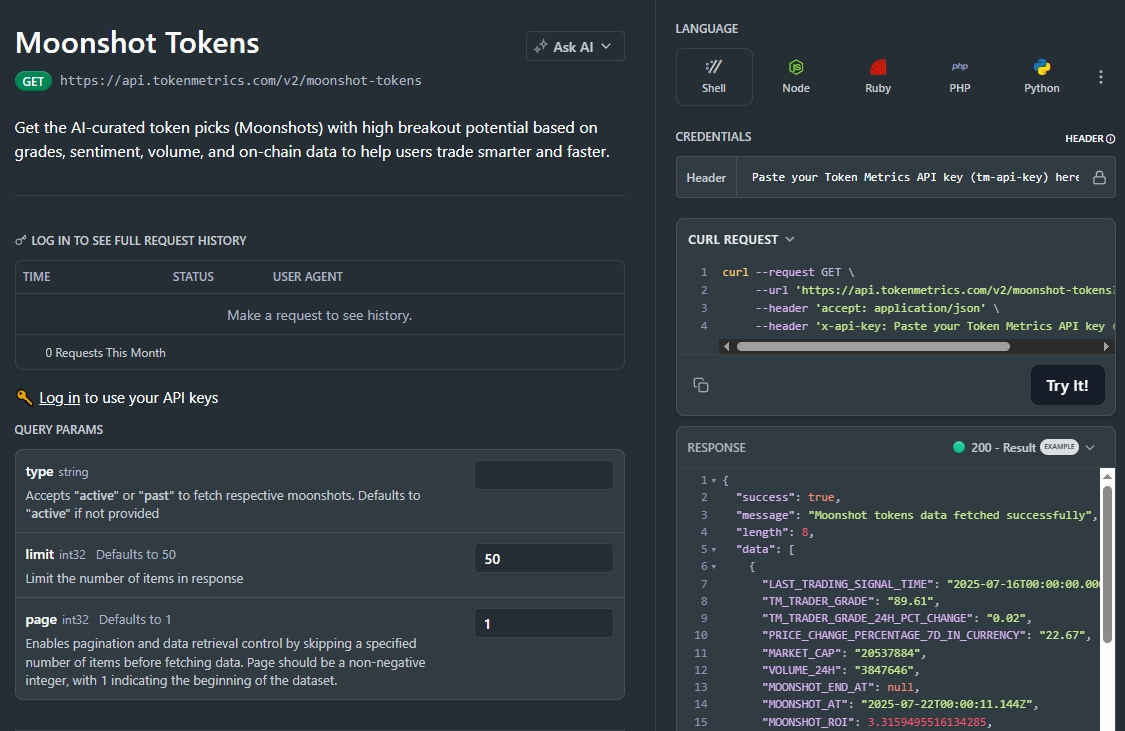
At query time, you request /v2/technology-grade?symbol=<ASSET>. The response includes the headline score and component scores you can display in bars or a radar chart. For dashboards with many assets, use batched calls and short-TTL caching. If you push upgrade/downgrade alerts, queue notifications or use webhooks to avoid bursty polling.

Production Checklist

  • Rate limits: Understand your tier’s caps; add client-side throttling.

  • Retries & backoff: Use exponential backoff with jitter; handle 429/5xx gracefully.

  • Idempotency: Ensure retried fetches don’t double-trigger downstream actions.

  • Caching: Memory/Redis/KV with short TTLs; pre-warm popular symbols; ETag if available.

  • Webhooks & jobs: Prefer queued jobs or webhooks for grade-change alerts.

  • Pagination/Bulk: Batch symbols; parallelize with care; respect limits.

  • Error catalog: Map common 4xx/5xx to remediation steps; log request IDs.

  • Observability: Track p95/p99 latency and error rates per endpoint; alert on drift.

  • Security: Keep API keys in secrets managers; rotate and scope keys.

Use Cases & Patterns

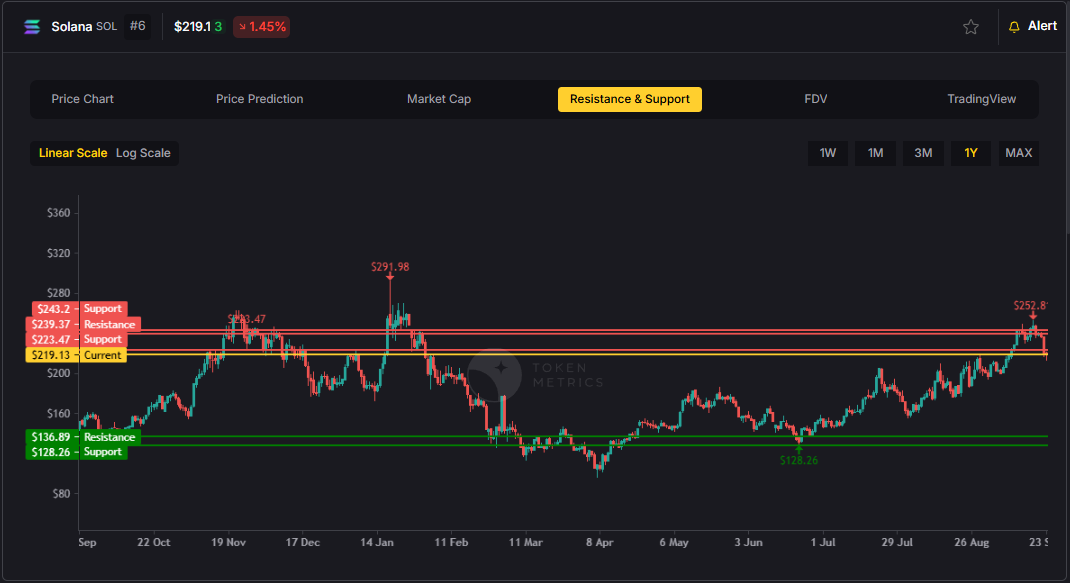
  • Bot Builder (Headless): Apply a Technology Grade threshold to define your tradable universe; then confirm timing with /v2/trading-signals and place risk with /v2/resistance-support.

  • Dashboard Builder (Product): Add a “Tech” tab on token pages with the headline grade, components, and a short narrative for users (“What’s driving this score?”).

  • Screener Maker (Lightweight Tools): Ship a Top-N by Technology Grade leaderboard; add badges for “Rising Tech” based on week-over-week deltas.

  • Listing/Research Teams: Gate listings or research coverage using Technology Grade plus Fundamental Grade for balanced quality screens.

  • Enterprise Due Diligence: Export grades nightly to internal systems; alert on downgrades crossing critical thresholds.

Next Steps

  • Get API Key — create a key and start free.

  • Run Hello-TM — confirm your first successful call.

  • Clone a Template — deploy a screener or token page today.

  • Watch the demo: VIDEO_URL_HERE

  • Compare plans: Scale usage and unlock higher limits with API plans.

FAQs

1) What does the Technology Grade API return?
A JSON payload with an overall score/grade plus component scores (e.g., scalability, innovation, code quality) and timestamps. Use the overall score for ranking and components for explanation.

2) Is this real-time, and what about latency/SLOs?
The endpoint is engineered for predictable latency suitable for dashboards and filters. For frequent refresh or alerts, combine short-TTL caching with queued jobs or webhooks to minimize round-trips.

3) How should I combine Technology Grade with other signals?
A common pattern: Technology Grade (engineering quality) + Fundamental Grade (business quality) + TM Grade (technicals/sentiment) + Trading Signals (timing) + Support/Resistance (risk placement).

4) How “accurate” is Technology Grade?
It’s an opinionated synthesis of engineering evidence, not financial advice. Use it as part of a diversified framework; validate with your own backtests and risk controls.

5) Do you provide SDKs or examples?
You can integrate via REST (JS/Python examples above). The docs include quickstarts, Postman collections, and templates—start by Run Hello-TM.

6) Polling vs webhooks for grade changes?
For UI pages, cached polling is fine. For alerts (upgrades/downgrades), prefer webhooks or scheduled jobs to avoid spiky traffic and rate-limit issues.

7) Pricing, limits, and enterprise SLAs?
Begin free and scale up as needed. See API plans for allowances; enterprise SLAs and support are available.

‍

Build Smarter Crypto Apps &
AI Agents in Minutes, Not Months
Real-time prices, trading signals, and on-chain insights all from one powerful API.
Grab a Free API Key
Token Metrics Team
Token Metrics Team

Recent Posts

Token Metrics API

Price Prediction API: Model Moon/Base/Bear Scenarios in Minutes

Sam Monac
5 min
MIN

Every trader wonders: how high could this token really go? The price prediction API from Token Metrics lets you explore Moon, Base, and Bear scenarios for any asset—grounded in market-cap assumptions like $2T, $8T, $16T and beyond. In this guide, you’ll call /v2/price-prediction, render scenario bands (with editable caps), and ship a planning feature your users will bookmark. Start by creating a key at Get API Key, then Run Hello-TM and Clone a Template to go live fast.

‍

What You’ll Build in 2 Minutes

  • A minimal script that fetches Price Predictions via /v2/price-prediction for any symbol (e.g., BTC, SUI).

  • A simple UI pattern showing Moon / Base / Bear ranges and underlying market-cap scenarios.

  • Optional one-liner curl to smoke-test your API key.

  • Endpoints to add next: /v2/tm-grade (quality context), /v2/trading-signals / /v2/hourly-trading-signals (timing), /v2/resistance-support (stop/target placement), /v2/quantmetrics (risk/return framing).

Why This Matters

Scenario planning beats guessing. Prices move, narratives change, but market-cap scenarios provide a common yardstick for upside/downside. With the price prediction API, you can give users transparent, parameterized ranges (Moon/Base/Bear) and the assumptions behind them—perfect for research, allocation, and position sizing.

Build investor trust. Pair scenario ranges with TM Grade (quality) and Quantmetrics (risk-adjusted performance) so users see both potential and risk. Add optional alerts when price approaches a scenario level to turn curiosity into action—without promising outcomes.

Where to Find 

Find the cURL request for Price Predictions in the top right corner of the API Reference. Use it to easily pull up predictions for your project.

👉 Keep momentum: Get API Key • Run Hello-TM • Clone a Template

Live Demo & Templates

  • Scenario Planner (Dashboard): Select a token, choose caps (e.g., $2T / $8T / $16T), and display Moon/Base/Bear ranges with tooltips.

  • Portfolio Allocator: Pair scenario bands with Quantmetrics and TM Grade to justify position sizes and rebalances.

  • Alert Bot (Discord/Telegram): Ping when price approaches a scenario level; link to the dashboard for context.

Fork a scenario planner or alerting template, plug in your key, and deploy. Confirm your environment by Running Hello-TM, and when you’re scaling users or need higher limits, review API plans.

How It Works (Under the Hood)

The Price Prediction endpoint maps market-cap scenarios to implied token prices, then categorizes them into Bear, Base, and Moon bands for readability. Your inputs can include a symbol and optional market caps; the response returns a scenario array you can plot or tabulate.

A common UX path is: Token selector → Scenario caps input → Prediction bands + context. For deeper insight, link to TM Grade (quality), Trading Signals (timing), and Support/Resistance (execution levels). This creates a complete plan–decide–act loop without overpromising outcomes.

Polling vs webhooks. Predictions don’t require sub-second updates; short-TTL caching and batched fetches work well for dashboards. If you build alerts (“price within 2% of Base scenario”), use a scheduled job and make notifications idempotent to avoid duplicates.

Production Checklist

  • Rate limits: Understand your tier caps; add client throttling and worker queues.

  • Retries & backoff: Exponential backoff with jitter for 429/5xx; capture request IDs.

  • Idempotency: De-dup alerts and downstream actions (e.g., avoid repeat pings).

  • Caching: Memory/Redis/KV with short TTLs; pre-warm popular symbols.

  • Batching: Fetch multiple symbols per cycle; parallelize within rate limits.

  • User controls: Expose caps (e.g., $2T/$8T/$16T) and save presets per user.

  • Display clarity: Label Bear/Base/Moon and show the implied market cap next to each price.

  • Compliance copy: Add a reminder that scenarios are not financial advice; historical outcomes don’t guarantee future results.

  • Observability: Track p95/p99 latency and error rate; log alert outcomes.

  • Security: Store API keys in secrets managers; rotate regularly.

Use Cases & Patterns

  • Bot Builder (Headless): Size positions relative to scenario distance (smaller size near Moon, larger near Bear) while confirming timing with /v2/trading-signals.

  • Dashboard Builder (Product): Add a Predictions tab on token pages; let users tweak caps and export a CSV of bands.

  • Screener Maker (Lightweight Tools): Rank tokens by upside to Base or distance to Bear; add alert toggles for approach thresholds.

  • PM/Allocator: Create policy rules like “increase weight when upside-to-Base > X% and TM Grade ≥ threshold.”

  • Education/Content: Blog widgets showing scenario bands for featured tokens; link to your app’s detailed page.

Next Steps

  • Get API Key — generate a key and start free.

  • Run Hello-TM — verify your first successful call.

  • Clone a Template — deploy a scenario planner or alerts bot today.

  • Watch the demo: VIDEO_URL_HERE

  • Compare plans: Scale confidently with API plans.

FAQs

1) What does the Price Prediction API return?
A JSON array of scenario objects for a symbol—each with a market cap and implied price, typically labeled Bear, Base, and Moon for clarity.

2) Can I set my own scenarios?
Yes, you can pass custom market caps (e.g., $2T, $8T, $16T) to reflect your thesis. Store presets per user or strategy for repeatability.

3) Is this financial advice? How accurate are these predictions?
No. These are scenario estimates based on your assumptions. They’re for planning and research, not guarantees. Always test, diversify, and manage risk.

4) How often should I refresh predictions?
Scenario bands typically don’t need real-time updates. Refresh on page load or at a reasonable cadence (e.g., hourly/daily), and cache results for speed.

5) Do you offer SDKs and examples?
REST is straightforward—see the JavaScript and Python snippets above. The docs include quickstarts, Postman collections, and templates—start with Run Hello-TM.

6) How do I integrate predictions with execution?
Pair predictions with TM Grade (quality), Trading Signals (timing), and Support/Resistance (SL/TP). Alert when price nears a scenario and route to your broker logic (paper-trade first).

7) Pricing, limits, and SLAs?
Start free and scale up as you grow. See API plans for rate limits and enterprise SLA options.

‍

Token Metrics API

Moonshots API: Discover Breakout Tokens Before the Crowd

Sam Monac
5 min
MIN

The biggest gains in crypto rarely come from the majors. They come from Moonshots—fast-moving tokens with breakout potential. The Moonshots API surfaces these candidates programmatically so you can rank, alert, and act inside your product. In this guide, you’ll call /v2/moonshots, display a high-signal list with TM Grade and Bullish tags, and wire it into bots, dashboards, or screeners in minutes. Start by grabbing your key at Get API Key, then Run Hello-TM and Clone a Template to ship fast.

‍

What You’ll Build in 2 Minutes

  • A minimal script that fetches Moonshots via /v2/moonshots (optionally filter by grade/signal/limit).

  • A UI pattern to render symbol, TM Grade, signal, reason/tags, and timestamp—plus a link to token details.

  • Optional one-liner curl to smoke-test your key.

  • Endpoints to add next: /v2/tm-grade (one-score ranking), /v2/trading-signals / /v2/hourly-trading-signals (timing), /v2/resistance-support (stops/targets), /v2/quantmetrics (risk sizing), /v2/price-prediction (scenario ranges).

Why This Matters

Discovery that converts. Users want more than price tickers—they want a curated, explainable list of high-potential tokens. The moonshots API encapsulates multiple signals into a short list designed for exploration, alerts, and watchlists you can monetize.

Built for builders. The endpoint returns a consistent schema with grade, signal, and context so you can immediately sort, badge, and trigger workflows. With predictable latency and clear filters, you can scale to dashboards, mobile apps, and headless bots without reinventing the discovery pipeline.

Where to Find 

The Moonshots API cURL request is right there in the top right of the API Reference. Grab it and start tapping into the potential!

‍

👉 Keep momentum: Get API Key • Run Hello-TM • Clone a Template

Live Demo & Templates

  • Moonshots Screener (Dashboard): A discover tab that ranks tokens by TM Grade and shows the latest Bullish tags and reasons.

  • Alert Bot (Discord/Telegram): DM when a new token enters the Moonshots list or when the signal flips; include S/R levels for SL/TP.

  • Watchlist Widget (Product): One-click “Follow” on Moonshots; show Quantmetrics for risk and a Price Prediction range for scenario planning.

Fork a screener or alerting template, plug your key, and deploy. Validate your environment with Hello-TM. When you scale users or need higher limits, compare API plans.

How It Works (Under the Hood)

The Moonshots endpoint aggregates a set of evidence—often combining TM Grade, signal state, and momentum/volume context—into a shortlist of breakout candidates. Each row includes a symbol, grade, signal, and timestamp, plus optional reason tags for transparency.

For UX, a common pattern is: headline list → token detail where you render TM Grade (quality), Trading Signals (timing), Support/Resistance (risk placement), Quantmetrics (risk-adjusted performance), and Price Prediction scenarios. This lets users understand why a token was flagged and how to act with risk controls.

Polling vs webhooks. Dashboards typically poll with short-TTL caching. Alerting flows use scheduled jobs or webhooks (where available) to smooth traffic and avoid duplicates. Always make notifications idempotent.

Production Checklist

  • Rate limits: Respect plan caps; batch and throttle in clients/workers.

  • Retries & backoff: Exponential backoff with jitter on 429/5xx; capture request IDs.

  • Idempotency: De-dup alerts and downstream actions (e.g., don’t re-DM on retries).

  • Caching: Memory/Redis/KV with short TTLs; pre-warm during peak hours.

  • Batching: Fetch in pages (e.g., limit + offset if supported); parallelize within limits.

  • Sorting & tags: Sort primarily by tm_grade or composite; surface reason tags to build trust.

  • Observability: Track p95/p99, error rates, and alert delivery success; log variant versions.

  • Security: Store keys in a secrets manager; rotate regularly.

Use Cases & Patterns

  • Bot Builder (Headless):


    • Universe filter: trade only tokens appearing in Moonshots with tm_grade ≥ X.

    • Timing: confirm entry with /v2/trading-signals; place stops/targets with /v2/resistance-support; size via Quantmetrics.

  • Dashboard Builder (Product):


    • Moonshots tab with Badges (Bullish, Grade 80+, Momentum).

    • Token detail page integrating TM Grade, Signals, S/R, and Predictions for a complete decision loop.

  • Screener Maker (Lightweight Tools):


    • Top-N list with Follow/alert toggles; export CSV.

    • “New this week” and “Graduated” sections for churn/entry dynamics.

  • Community/Content:


    • Weekly digest: new entrants, upgrades, and notable exits—link back to your product pages.

Next Steps

  • Get API Key — generate a key and start free.

  • Run Hello-TM — verify your first successful call.

  • Clone a Template — deploy a screener or alerts bot today.

  • Watch the demo: VIDEO_URL_HERE

  • Compare plans: Scale confidently with API plans.

FAQs

1) What does the Moonshots API return?
A list of breakout candidates with fields such as symbol, tm_grade, signal (often Bullish/Bearish), optional reason tags, and updated_at. Use it to drive discover tabs, alerts, and watchlists.

2) How fresh is the list? What about latency/SLOs?
The endpoint targets predictable latency and timely updates for dashboards and alerts. Use short-TTL caching and queued jobs/webhooks to avoid bursty polling.

3) How do I use Moonshots in a trading workflow?
Common stack: Moonshots for discovery, Trading Signals for timing, Support/Resistance for SL/TP, Quantmetrics for sizing, and Price Prediction for scenario context. Always backtest and paper-trade first.

4) I saw results like “+241%” and a “7.5% average return.” Are these guaranteed?
No. Any historical results are illustrative and not guarantees of future performance. Markets are risky; use risk management and testing.

5) Can I filter the Moonshots list?
Yes—pass parameters like min_grade, signal, and limit (as supported) to tailor to your audience and keep pages fast.

6) Do you provide SDKs or examples?
REST works with JavaScript and Python snippets above. Docs include quickstarts, Postman collections, and templates—start with Run Hello-TM.

7) Pricing, limits, and enterprise SLAs?
Begin free and scale up. See API plans for rate limits and enterprise options.

‍

Token Metrics API

Support and Resistance API: Auto-Calculate Smart Levels for Better Trades

Sam Monac
5 min
MIN

Most traders still draw lines by hand in TradingView. The support and resistance API from Token Metrics auto-calculates clean support and resistance levels from one request, so your dashboard, bot, or alerts can react instantly. In minutes, you’ll call /v2/resistance-support, render actionable levels for any token, and wire them into stops, targets, or notifications. Start by grabbing your key on Get API Key, then Run Hello-TM and Clone a Template to ship a production-ready feature fast.

‍

‍

What You’ll Build in 2 Minutes

  • A minimal script that fetches Support/Resistance via /v2/resistance-support for a symbol (e.g., BTC, SOL).

  • A one-liner curl to smoke-test your key.

  • A UI pattern to display nearest support, nearest resistance, level strength, and last updated time.

  • Endpoints to add next: /v2/trading-signals (entries/exits), /v2/hourly-trading-signals (intraday updates), /v2/tm-grade (single-score context), /v2/quantmetrics (risk/return framing).

Why This Matters

Precision beats guesswork. Hand-drawn lines are subjective and slow. The support and resistance API standardizes levels across assets and timeframes, enabling deterministic stops and take-profits your users (and bots) can trust.

Production-ready by design. A simple REST shape, predictable latency, and clear semantics let you add levels to token pages, automate SL/TP alerts, and build rule-based execution with minimal glue code.

Where to Find 

Need the Support and Resistance data? The cURL request for it is in the top right of the API Reference for quick access.

👉 Keep momentum: Get API Key • Run Hello-TM • Clone a Template

Live Demo & Templates

  • SL/TP Alerts Bot (Telegram/Discord): Ping when price approaches or touches a level; include buffer %, link back to your app.

  • Token Page Levels Panel (Dashboard): Show nearest support/resistance with strength badges; color the latest candle by zone.

  • TradingView Overlay Companion: Use levels to annotate charts and label potential entries/exits driven by Trading Signals.

Kick off with our quickstarts—fork a bot or dashboard template, plug your key, and deploy. Confirm your environment by Running Hello-TM. When you’re scaling or need webhooks/limits, review API plans.

How It Works (Under the Hood)

The Support/Resistance endpoint analyzes recent price structure to produce discrete levels above and below current price, along with strength indicators you can use for priority and styling. Query /v2/resistance-support?symbol=<ASSET>&timeframe=<HORIZON> to receive arrays of level objects and timestamps.

Polling vs webhooks. For dashboards, short-TTL caching and batched fetches keep pages snappy. For bots and alerts, use queued jobs or webhooks (where applicable) to avoid noisy, bursty polling—especially around market opens and major events.

Production Checklist

  • Rate limits: Respect plan caps; add client-side throttling.

  • Retries/backoff: Exponential backoff with jitter for 429/5xx; log failures.

  • Idempotency: Make alerting and order logic idempotent to prevent duplicates.

  • Caching: Memory/Redis/KV with short TTLs; pre-warm top symbols.

  • Batching: Fetch multiple assets per cycle; parallelize within rate limits.

  • Threshold logic: Add %-of-price buffers (e.g., alert at 0.3–0.5% from level).

  • Error catalog: Map common 4xx/5xx to actionable user guidance; keep request IDs.

  • Observability: Track p95/p99; measure alert precision (touch vs approach).

  • Security: Store API keys in a secrets manager; rotate regularly.

Use Cases & Patterns

  • Bot Builder (Headless):


    • Use nearest support for stop placement and nearest resistance for profit targets.

    • Combine with /v2/trading-signals for entries/exits and size via Quantmetrics (volatility, drawdown).

  • Dashboard Builder (Product):


    • Add a Levels widget to token pages; badge strength (e.g., High/Med/Low) and show last touch time.

    • Color the price region (below support, between levels, above resistance) for instant context.

  • Screener Maker (Lightweight Tools):


    • “Close to level” sort: highlight tokens within X% of a strong level.

    • Toggle alerts for approach vs breakout events.

  • Risk Management:


    • Create policy rules like “no new long if price is within 0.2% of strong resistance.”

    • Export daily level snapshots for audit/compliance.

Next Steps

  • Get API Key — generate a key and start free.

  • Run Hello-TM — verify your first successful call.

  • Clone a Template — deploy a levels panel or alerts bot today.

  • Watch the demo: VIDEO_URL_HERE

  • Compare plans: Scale confidently with API plans.

FAQs

1) What does the Support & Resistance API return?
A JSON payload with arrays of support and resistance levels for a symbol (and optional timeframe), each with a price and strength indicator, plus an update timestamp.

2) How timely are the levels? What are the latency/SLOs?
The endpoint targets predictable latency suitable for dashboards and alerts. Use short-TTL caching for UIs, and queued jobs or webhooks for alerting to smooth traffic.

3) How do I trigger alerts or trades from levels?
Common patterns: alert when price is within X% of a level, touches a level, or breaks beyond with confirmation. Always make downstream actions idempotent and respect rate limits.

4) Can I combine levels with other endpoints?
Yes—pair with /v2/trading-signals for timing, /v2/tm-grade for quality context, and /v2/quantmetrics for risk sizing. This yields a complete decide-plan-execute loop.

5) Which timeframe should I use?
Intraday bots prefer shorter horizons; swing/position dashboards use daily or higher-timeframe levels. Offer a timeframe toggle and cache results per setting.

6) Do you provide SDKs or examples?
Use the REST snippets above (JS/Python). The docs include quickstarts, Postman collections, and templates—start with Run Hello-TM.

7) Pricing, limits, and enterprise SLAs?
Begin free and scale as you grow. See API plans for rate limits and enterprise SLA options.

‍

Choose from Platinum, Gold, and Silver packages
Reach with 25–30% open rates and 0.5–1% CTR
Craft your own custom ad—from banners to tailored copy
Perfect for Crypto Exchanges, SaaS Tools, DeFi, and AI Products