Research

Top Stablecoin Issuers & Use Cases (2025)

Compare the leading stablecoin issuers by reserves, fees, regions, and best use cases. Pick the right coin for trading, payments, or DeFi.
Sam Monac
5 min
MIN

Why stablecoin issuers matter in September 2025

Stablecoins have become crypto’s settlement rail, powering exchanges, DeFi, remittances, and payments. In 2025, clarity is improving and liquidity is consolidating—so choosing stablecoin issuers with sound reserves, clear disclosures, and fit-for-purpose design matters more than ever.
Definition: A stablecoin issuer is the organization or protocol that mints and redeems a token designed to track a reference asset (usually USD), with reserves and/or mechanisms intended to hold the peg.
This guide evaluates the leading issuers globally and maps their best use cases—from high-volume trading to compliant payments and decentralized collateral. We focus on reserves quality, transparency, networks supported, institutional access, fees, and regional eligibility. Secondary topics include “USDC vs USDT,” euro/SGD options, and decentralized alternatives that can complement centralized choices. Circle+2Circle+2

How We Picked (Methodology & Scoring)

  • Liquidity (30%): Scale of circulation and exchange/DeFi depth for tight spreads and fast settlement.

  • Security (25%): Reserve quality, segregation, audits/attestations, onchain safety, and incident track record.

  • Coverage (15%): Multi-chain support, fiat rails, and breadth of supported currencies (USD, EUR, SGD).

  • Costs (15%): Primary mint/redeem fees, network costs, and known program fees.

  • UX (10%): Accessibility, APIs, documentation, and fiat on/off-ramps.

  • Support (5%): Enterprise support, disclosures, and transparency cadence.

We relied on official product/docs/security pages from each issuer and used market datasets (e.g., CCData/Kaiko/CoinGecko) for cross-checks only. Last updated September 2025. Circle+1

Top 10 stablecoin issuers and use cases in September 2025

1. Tether — Best for global, always-on liquidity

Why Use It: USD₮ (USDT) is the deepest liquidity pool across CEXs and many L2s—useful for traders and market makers who prioritize fills and routing. Tether publishes quarterly reserve attestations by BDO and a detailed reserves breakdown, improving transparency versus prior years. Tether+1
Best For: Active traders, OTC desks, market makers, emerging-market remittances.
Notable Features: Multi-chain footprint; public reserve updates; operational resilience at massive scale. Tether
Consider If: U.S. persons cannot use Tether’s own platform services under its Terms; rely on supported exchanges instead. Regions: Global (platform restrictions apply). Fees/Notes: Account verification and certain fees apply at the platform level. Tether+1
Alternatives: Circle (USDC), First Digital Labs (FDUSD).

2. Circle — USDC / EURC — Best for regulated, enterprise-grade rails

Why Use It: Circle emphasizes transparency, monthly reserve attestations, and segregation of funds. USDC is widely integrated with banks, fintechs, and onchain apps; EURC brings a euro option under the same standards. Circle+1
Best For: Enterprises/fintechs, payment flows, compliant treasuries, DeFi power users.
Notable Features: Circle Mint for programmatic mint/redeem; monthly attestations; multi-chain support; extensive docs. Fees/Notes: Institutional fee schedule applies for certain high-volume flows. Circle+1
Regions: Global (availability varies by partner/exchange).
Alternatives: Paxos (USDP), PayPal USD (PYUSD).

3. MakerDAO — DAI — Best decentralized, overcollateralized dollar

Why Use It: DAI is minted against overcollateralized crypto via the Maker Protocol, giving a censorship-resistant alternative to fiat-custodied coins. The Peg Stability Module (PSM) smooths peg fluctuations by allowing swaps with other stables. docs.makerdao.com+1
Best For: DeFi natives, long-term onchain treasuries, collateralized borrowing.
Notable Features: Onchain transparency; collateral diversity with governance controls; mature integrations across DeFi. docs.makerdao.com
Consider If: Exposure to crypto collateral and governance risk differs from fiat-backed models. Regions: Global.
Alternatives: Liquity (LUSD/BOLD), Frax (frxUSD).

4. First Digital Labs — FDUSD — Best for Asia-centric trading depth

Why Use It: FDUSD is fully reserved and designed for 1:1 redemption; it has become a deep-liquidity quote asset on major Asian venues. Issuance moved to a BVI entity (FD121 BVI) in 2025 to support global accessibility. firstdigitallabs.com+1
Best For: Traders on Asia-focused exchanges, cross-border settlement in APAC, OTC desks.
Notable Features: Monthly attestations; segregation of assets with qualified custodians; institutional onboarding. Fees/Notes: Primary mint/redeem requires becoming a client; retail typically uses secondary markets. firstdigitallabs.com+1
Regions: Global (institutional primary; retail via exchanges).
Alternatives: Tether (USDT), Circle (USDC).

5. Paxos — USDP — Best for NYDFS-regulated issuance

Why Use It: USDP is issued by Paxos Trust (NYDFS-regulated), held 100% in cash and cash equivalents, and redeemable 1:1. Paxos provides enterprise APIs and no-fee mint/redeem for primary customers. Paxos+1
Best For: Enterprises needing regulated counterparties, payment processors, fintechs.
Notable Features: Segregated, bankruptcy-remote client assets; Ethereum & Solana support; rich developer docs. Fees/Notes: No Paxos fee to mint/redeem USDP; bank/network fees may apply. Paxos+1
Regions: US/EU/APAC via partners; check onboarding eligibility.
Alternatives: Circle (USDC), PayPal USD (PYUSD).

6. PayPal USD (PYUSD) — Best for consumer payments in the U.S.

Why Use It: PYUSD brings stablecoins to familiar wallets (PayPal/Venmo), with instant P2P and merchant flows for eligible U.S. users. It’s issued by Paxos Trust and is redeemable within the PayPal ecosystem; PayPal has also launched an optional rewards program for eligible U.S. users. PayPal+1
Best For: U.S. consumers and SMBs using PayPal/Venmo, payment acceptance, loyalty.
Notable Features: Wallet-native UX; on/off-ramps; integrations expanding across networks. Fees/Notes: No fees to buy/sell/hold/transfer PYUSD inside eligible U.S. PayPal balances; conversion fees apply when swapping with other crypto. PayPal
Regions: U.S. only for consumer access via PayPal/Venmo.
Alternatives: USDC (for global reach), USDP (enterprise rails).

7. Ethena Labs — USDe — Best synthetic dollar for DeFi yields (advanced users)

Why Use It: USDe uses a delta-neutral mechanism (spot + perps/futures) to target dollar stability without relying solely on banks. sUSDe offers onchain, variable rewards sourced from the strategy. This is a crypto-native design and differs from fiat-redeemable models. docs.ethena.fi+1
Best For: Sophisticated DeFi users, L2 yield strategies, protocols integrating synthetic dollars.
Notable Features: Whitelist-based mint/redeem; peg supported by hedged positions; extensive docs. Fees/Notes: Not available to U.S. users; USDe is not redeemable for fiat by design. docs.ethena.fi+1
Regions: Global (restricted jurisdictions excluded).
Alternatives: DAI, frxUSD.

8. Frax Finance — frxUSD — Best modular stable for DeFi integrations

Why Use It: Frax introduced frxUSD, a fully collateralized, fiat-redeemable stablecoin with “enshrined custodians” while retaining Frax’s modular DeFi stack. It aims to couple institutional-grade backing with protocol-level tooling (lending/AMMs). Frax
Best For: DeFi builders, protocols needing composability, multi-product integration.
Notable Features: Hybrid custody model; Fraxtal/Frax ecosystem; onchain transparency dashboard. Fees/Notes: Details governed by Frax docs and custodial partners. Frax+1
Regions: Global (availability via exchanges/integrations).
Alternatives: USDC, DAI.

9. StraitsX — XSGD — Best for SGD settlements and APAC fintech rails

Why Use It: XSGD is a Singapore dollar stablecoin with monthly reserve attestations and a strong focus on compliant payments infrastructure across Southeast Asia. It’s widely integrated with regional wallets, OTC, and DeFi. straitsx.com+1
Best For: APAC businesses, cross-border SGD flows, FX pairs (XSGD↔USD stables).
Notable Features: Monthly attestations; issuer entities for SGD/USD; APIs for swaps/OTC. Fees/Notes: Platform and network fees apply; see issuer terms. straitsx.com
Regions: APAC (global transferability on supported chains).
Alternatives: USDC (USD rails), Monerium (EURe for EUR rails).

10. Monerium — EURe — Best for euro e-money compliance

Why Use It: Monerium issues EURe as regulated e-money under EU rules with segregated, over-collateralized assets—designed for compliant euro settlements onchain. Tokens live on Ethereum, Gnosis, and Polygon with instant redeemability. Monerium+1
Best For: European fintechs, treasuries needing euro rails, compliant B2B payments.
Notable Features: Authorized EMI; 102% safeguarding policy; e-money legal clarity; audited financials. Fees/Notes: Published fee schedule; standard banking/network fees may apply. Monerium+1
Regions: EU/EEA (global transferability on supported chains).
Alternatives: Circle (EURC), StraitsX (XSGD for SGD).

Decision Guide: Best By Use Case

  • Global trading liquidity: Tether (USDT). Tether

  • Regulated U.S./enterprise rails: Circle (USDC), Paxos (USDP). Circle+1

  • U.S. consumer payments/Loyalty: PayPal USD (PYUSD). PayPal

  • Decentralized/censorship-resistant: MakerDAO (DAI); Liquity (LUSD/BOLD) as alt. docs.makerdao.com+1

  • APAC settlement/SGD pairs: StraitsX (XSGD). straitsx.com

  • Euro compliance: Monerium (EURe), Circle (EURC). Monerium+1

  • DeFi-native synthetic dollar/yields: Ethena (USDe). docs.ethena.fi

  • Modular DeFi integration: Frax (frxUSD). Frax

How to Choose the Right stablecoin issuers (Checklist)

  • Region & eligibility: Are you a U.S. consumer, EU business, or global trader? (PayPal vs Circle/Paxos vs Tether/DeFi.) PayPal

  • Reserves & attestations: Look for frequent, third-party reports and clear segregation of client assets. Circle+1

  • Mechanism fit: Fiat-backed vs overcollateralized vs synthetic—match to risk tolerance. docs.makerdao.com+1

  • Chains & integrations: Ensure support for your target L2s, exchanges, and wallets.

  • Fees & slippage: Primary mint/redeem costs, network gas, conversion spreads. Paxos+1

  • Operational needs: APIs, treasury tools, reporting, and support SLAs.

  • Red flags: Vague reserve language, infrequent disclosures, or unclear redemption policies.

Use Token Metrics With Any stablecoin issuers

  • AI Ratings surface quality signals behind liquidity metrics.
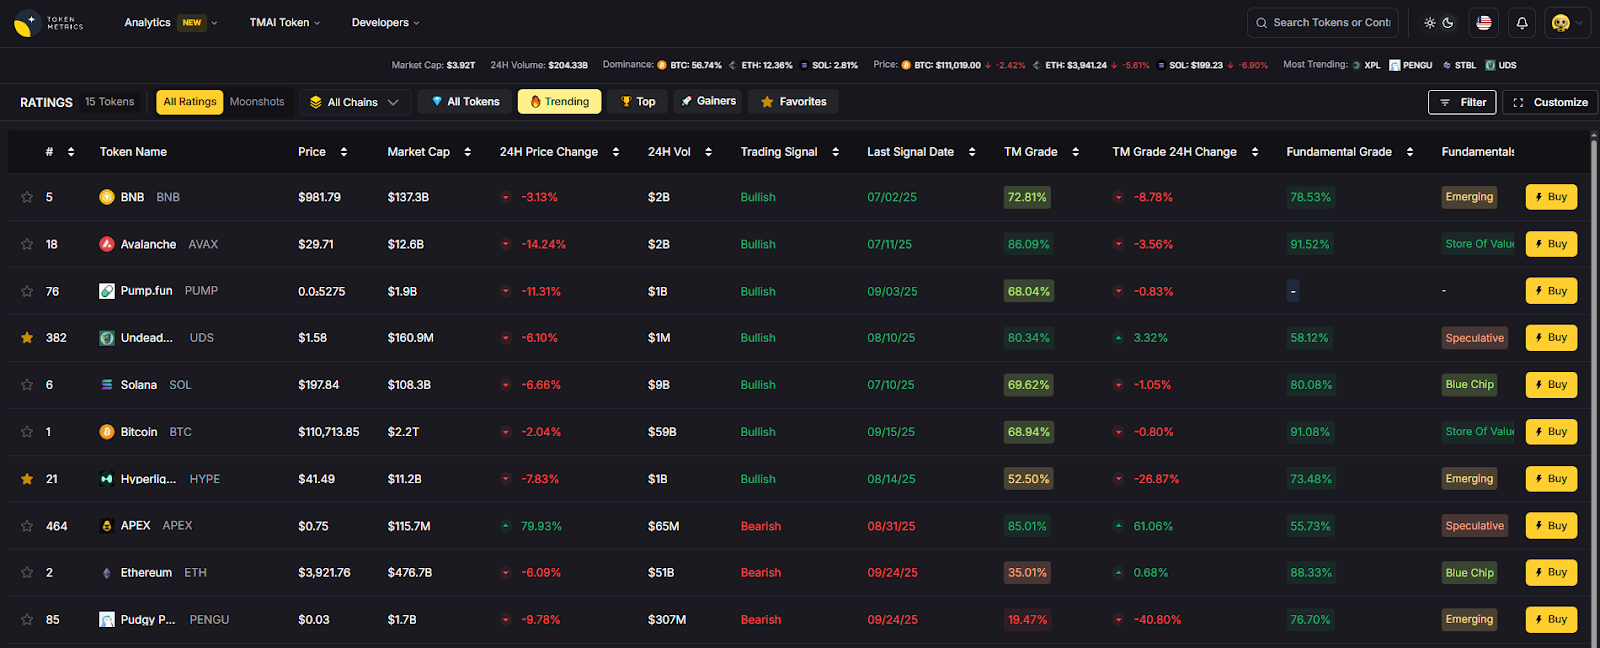
  • Narrative Detection spots capital rotation into specific stablecoin ecosystems.

  • Portfolio Optimization helps size stablecoin sleeves by mandate (trading vs yield vs payments).

  • Alerts & Signals track peg deviations, volume spikes, and exchange outflows.
    Workflow: Research → Select → Execute with your chosen issuer/exchange → Monitor with alerts.


Primary CTA: Start free trial

Security & Compliance Tips

  • Enable 2FA and secure treasury ops (role-based access, hardware keys).

  • Confirm custody setup (segregated accounts; multi-sig or MPC for smart-contract risk).

  • Complete KYC/AML where required; verify permitted jurisdictions. Tether+1

  • Use RFQ/OTC for large conversions to reduce slippage.

  • Practice wallet hygiene: label treasury addresses, restrict permissions, and test redemptions.

This article is for research/education, not financial advice.

Beginner Mistakes to Avoid

  • Treating all stablecoins as identical; mechanisms and risks vary.

  • Ignoring fee schedules and settlement timelines for large redeems. Circle Help+1

  • Using a region-restricted product (e.g., PYUSD outside the U.S.; USDe app in restricted markets). PayPal+1

  • Overconcentrating in a single issuer or chain.

  • Skipping ongoing monitoring of peg, reserves, and disclosures.

FAQs

1) What are the main types of stablecoin issuers?
Three broad models: (1) Fiat-backed (Circle, Paxos, First Digital Labs), (2) Overcollateralized crypto-backed (MakerDAO DAI; Liquity), and (3) Synthetic/hedged (Ethena USDe). Each has distinct reserve/risk properties. docs.ethena.fi+3Circle+3Paxos+3

2) Which stablecoin is best for trading liquidity?
USDT typically leads on global CEX depth and pairs, with USDC often preferred for fiat-connected flows and DeFi. Choose based on venue support and treasury needs. Tether+1

3) Can U.S. users access every stablecoin?
No. PYUSD is for eligible U.S. PayPal/Venmo users; some protocols (e.g., Ethena) restrict U.S. access to their app. Always check terms. PayPal+1

4) How do fees work for minting and redeeming?
Paxos states no fees for mint/redeem USDP/PYUSD for primary clients; Circle has institutional schedules; Tether lists platform fees. Secondary-market trades still incur exchange/gas costs. Paxos+2Circle Help+2

5) Are euro or SGD stablecoins useful?
Yes. EURC/EURe enable euro settlements under EU rules; XSGD supports APAC rails and FX paths versus USD stables. Circle+2Monerium+2

6) Is DAI safer than fiat-backed coins?
“Safer” depends on your risk lens. DAI reduces bank/custodian reliance but adds crypto-collateral and governance risk; fiat-backed coins rely on custodians and regulators. Diversification is common. docs.makerdao.com

Conclusion + Related Reads

If you need global trading liquidity, start with USDT/USDC. For enterprise-grade compliance, Circle/Paxos shine. For decentralized resilience, DAI (and Liquity) fit. For regional rails, consider XSGD (APAC) and EURe/EURC (EU). Pair the right issuer with your use case, then monitor peg, reserves, and policy changes over time.

Related Reads:

  • Best Cryptocurrency Exchanges 2025

  • Top Derivatives Platforms 2025

  • Top Institutional Custody Providers 2025

‍

Build Smarter Crypto Apps &
AI Agents in Minutes, Not Months
Real-time prices, trading signals, and on-chain insights all from one powerful API.
Grab a Free API Key
Token Metrics Team
Token Metrics Team

Recent Posts

Research

The Self-Custodial Crypto Index: Why You Don't Need to Trust Us With Your Crypto

Token Metrics Team
12
MIN

"Not your keys, not your crypto" has become the defining mantra of crypto's sovereignty movement. Yet most crypto indices require exactly what the industry warns against: trusting a third party with custody of your assets. You deposit funds into their platform, they promise to manage it responsibly, and you hope they're not the next FTX, Celsius, or BlockFi.Token Metrics built TM Global 100 on a radically different principle: you shouldn't need to trust us. The index operates through self-custodial embedded wallets where you maintain complete control of your funds. Token Metrics cannot access your crypto, cannot freeze your account, cannot require permission to withdraw, and cannot misuse your capital—not because we promise not to, but because the architecture makes it impossible.

This isn't marketing language. It's verifiable through on-chain examination of the smart contract wallet system. Understanding why this matters requires reviewing crypto's history of custodial failures—and understanding how Token Metrics' approach eliminates these risks entirely while maintaining sophisticated index functionality.

The Custodial Crisis: When "Trust Us" Fails

Crypto's short history is littered with custodial disasters. Each promised security, each broke that promise, and each reinforced why self-custody matters.

The Hall of Shame: Major Custodial Failures

  • Mt. Gox (2014): Once handled 70% of all Bitcoin transactions. Declared bankruptcy after losing 850,000 BTC (~$450M at the time). Users had no recourse—funds simply vanished. Lesson: Size and market dominance don't guarantee security.
  • QuadrigaCX (2019): Canadian exchange collapsed after founder's death. $190M in customer funds inaccessible. Revealed funds had been misappropriated for years. Lesson: Single points of failure create catastrophic risk.
  • Celsius Network (2022): Promised 18%+ yields on deposits. Filed bankruptcy owing $4.7B to users. Revealed massive mismanagement and risky lending. Users waited years for partial recovery. Lesson: High yields often mask unsustainable business models.
  • FTX (2022): Third-largest exchange by volume. Collapsed in 72 hours after revealing $8B hole in balance sheet. Customer deposits illegally used for proprietary trading. Criminal charges against leadership. Lesson: Even "reputable" custodians can commit fraud.
  • BlockFi (2022): Lending platform with 650,000+ users. Bankruptcy following exposure to FTX and Three Arrows Capital. Users became unsecured creditors. Lesson: Custodial services create contagion risk across platforms.

The Common Pattern

  1. Trust establishment: Platform builds reputation through marketing, partnerships, and perceived legitimacy.
  2. Deposit accumulation: Users transfer custody of assets based on trust.
  3. Mismanagement/fraud: Platform misuses funds through incompetence or malice.
  4. Crisis discovery: Problem becomes public, often suddenly.
  5. Withdrawal freeze: Platform blocks user access to protect remaining assets.
  6. Bankruptcy: Legal proceedings that recover pennies on the dollar.

Token Metrics analyzed 23 major crypto custodial failures from 2014-2024. Average customer recovery: 31 cents per dollar. Average recovery timeline: 2.7 years. Percentage of cases with criminal charges: 39%. The data is clear: custodial risk isn't theoretical. It's the largest predictable loss vector in crypto investing.

What Self-Custody Actually Means

Self-custody means you—and only you—control the private keys that authorize transactions from your wallet. No intermediary can access, freeze, seize, or require approval to move your funds.

The Key Principles

  • Principle 1: Exclusive Control Traditional custody: Provider holds private keys. You request withdrawals. They approve or deny. Self-custody: You hold private keys (or control smart contract wallet). You authorize transactions. No third-party approval required.
  • Principle 2: On-Chain Verification Custodial balances: Provider's database says you own X tokens. You trust their accounting. Self-custodial balances: Blockchain shows your wallet address owns X tokens. Publicly verifiable, tamper-proof.
  • Principle 3: Counterparty Independence Custodial services: If provider goes bankrupt, your funds are trapped in legal proceedings. Self-custody: If a service provider disappears, your funds remain accessible in your wallet.
  • Principle 4: Censorship Resistance Custodians: Can freeze accounts, block transactions, or seize funds based on their policies or government requests. Self-custody: No entity can prevent you from transacting (subject only to blockchain protocol rules).

The Traditional Self-Custody Tradeoffs

Pure self-custody (hardware wallets, MetaMask, etc.) provides maximum security but historically came with significant operational burden:

  • Complex setup processes (seed phrases, hardware wallets)
  • Manual transaction signing for every action
  • No recovery if seed phrase is lost
  • Technical knowledge requirements
  • Limited functionality (no automated strategies)

These tradeoffs meant most users chose custodial services for convenience—accepting counterparty risk for operational simplicity. Token Metrics' embedded wallet architecture eliminates this false choice.

Token Metrics' Self-Custodial Architecture

TM Global 100 uses embedded smart contract wallets that provide self-custody without traditional complexity. Here's how it works:

Smart Contract Wallets Explained

Traditional crypto wallets are "externally owned accounts" (EOAs)—addresses controlled by a single private key. Lose that key, lose the funds. Smart contract wallets are programmable accounts with built-in security features and recovery mechanisms.

  • Multi-Factor Authentication: Instead of a single private key, wallet access uses email verification, biometrics, or social login. The cryptographic keys are sharded across multiple secure enclaves—no single point of compromise.
  • Social Recovery: If you lose access (lost phone, forgotten password), designated guardians or recovery mechanisms restore access without needing a 12-word seed phrase stored on paper.
  • Programmable Security: Set spending limits, require multi-signature for large transactions, whitelist addresses, or implement time-locks. Security policies impossible with traditional wallets.
  • Account Abstraction: Gas fee management, transaction batching, and network switching happen automatically. Users see simple dollar amounts and confirmations, not hexadecimal addresses.

Who Controls What

  • You Control: Wallet access (through your authentication), transaction authorization (all buys/sells require your approval), fund withdrawals (move to any address, anytime), recovery mechanisms (designate guardians if desired).
  • Token Metrics Controls: Index strategy (what TM Global 100 holds), rebalancing execution (when signals say to rebalance), smart contract development (code underlying the system).

Token Metrics CANNOT:

  • Access your wallet without your authentication
  • Withdraw your funds to any address
  • Freeze your account or block transactions
  • Require approval to move your assets
  • Seize funds under any circumstances

This separation is enforced by smart contract architecture, not trust. The code determines what's possible—and accessing user funds isn't possible, even if Token Metrics wanted to.

On-Chain Verification

Every TM Global 100 wallet is a publicly visible blockchain address. Using blockchain explorers (Etherscan, etc.), anyone can verify:

  • Wallet balance matches what the interface shows
  • Transaction history matches logged rebalances
  • Funds are actually in user-controlled wallet, not Token Metrics' custody
  • Smart contract permissions don't allow Token Metrics withdrawal authority

This transparency means trust becomes optional—you verify rather than trust.

The Practical Reality: How Self-Custody Works Daily

Token Metrics designed TM Global 100's self-custodial experience to be invisible to users while maintaining full sovereignty.

Initial Setup (90 seconds)

  • Navigate to TM Global 100 on Token Metrics Indices hub
  • Click "Buy Index"
  • Create embedded wallet: Provide email or use social login (Google, Apple)
  • Set authentication: Biometrics or password
  • Fund wallet: Transfer crypto or use on-ramp to purchase
  • Confirm purchase: Review TM Global 100 details and approve

Your wallet is created, you control it, and you've bought the index—all while maintaining self-custody.

Ongoing Operations (Zero Custody Risk)

Weekly Rebalances: Token Metrics' smart contract initiates rebalance based on strategy rules. Transaction occurs within YOUR wallet (not custodial account). You can see the transaction on blockchain explorers. Funds never leave your control—they just recompose from BTC+ETH+... to updated weights.

Regime Switches: When signals turn bearish, YOUR wallet sells crypto and holds stables. When signals turn bullish, YOUR wallet buys crypto from stables. Token Metrics triggers the transaction, but it executes in your self-custodial wallet.

Withdrawals: At any time, withdraw some or all funds to any address. No approval needed from Token Metrics. It’s a standard blockchain transaction—Token Metrics can't block it.

What Happens If Token Metrics Disappears?

Imagine Token Metrics goes bankrupt tomorrow. With custodial services, your funds are trapped. With TM Global 100:

  • Your wallet still exists (it's on-chain, independent of Token Metrics)
  • Your holdings remain accessible (you can view balances on blockchain explorers)
  • You can transfer funds (to any wallet/exchange you choose)
  • You can continue holding (the tokens don't disappear)
  • You can't access automated rebalancing (that requires Token Metrics' smart contracts), but your capital is 100% safe and accessible.

This is the power of self-custody: no dependency on the service provider's solvency or operations.

Comparison to Custodial Crypto Indices

Token Metrics isn't the only crypto index provider. How does TM Global 100's self-custody compare to alternatives?

Custodial Index Providers

  • Typical Structure: Deposit funds to provider's platform. Provider holds crypto in their custody. You own "shares" or "units" representing claim on assets. Withdrawal requires provider approval and processing time.
  • Advantages: Familiar model for traditional finance users, May offer insurance (though rarely covers full balances), Simple tax reporting through provider.
  • Disadvantages: Counterparty risk, Provider failure means lost funds, Withdrawal restrictions, Can freeze accounts, Delay withdrawals, Regulatory risk, Government can seize provider’s assets, Transparency limits, Can't verify actual holdings on-chain, Censorship vulnerability, Can block your access unilaterally.

Self-Custodial Model

Funds remain in your self-custodial smart contract wallet. You maintain control via private authentication. Token Metrics provides strategy execution, not custody. Withdrawal is immediate—it's already your wallet.

  • Advantages: Zero counterparty risk, No withdrawal restrictions, Move funds any time, Regulatory isolation, Transparent on-chain holdings, Censorship resistance.
  • Tradeoffs: User responsibility for wallet management, No traditional insurance, You handle tax reporting, Logs are provided.

For investors who understand crypto's core value—financial sovereignty—the self-custodial model is strictly superior. Custodial convenience isn't worth systemic risk.

Trustless by Design

Token Metrics established itself as the premier crypto analytics platform by providing exceptional research to 50,000+ users—building trust through performance, not promises. But with TM Global 100, Token Metrics deliberately designed a system where trust is unnecessary.

Traditional Financial Services

"Trust us to handle your money responsibly. We have reputation, insurance, and regulatory oversight."

Crypto's Original Vision

"Don't trust, verify. Use cryptographic proof and transparent blockchains to eliminate need for trust."

TM Global 100

"We provide excellent research and systematic execution. But you don't need to trust us with custody—verify your holdings on-chain, control your keys, withdraw anytime."

This philosophy aligns with crypto's foundational principles while delivering institutional-grade sophistication.

How Token Metrics Makes Money Without Custody

Traditional indices profit by holding client assets and taking fees. Token Metrics profits differently: Platform Fee: Annual percentage (1.5-2.0%) charged from YOUR holdings in YOUR wallet. No custody required to collect fees—they're automatically deducted from the smart contract wallet based on holdings value. Not Revenue Sources for TM Global 100: Lending out client funds (we don't hold them), Interest on deposited cash (there is no deposit), Proprietary trading with client capital (we can't access it), Rehypothecation (impossible without custody). Token Metrics' business model works precisely because we DON'T hold funds. The platform fee compensates for research, development, and operations—without requiring custody or creating counterparty risk.

The Accountability Structure

Self-custody creates natural accountability:

  • Custodial Model: If provider performs poorly, changing is difficult (withdrawal delays, tax events, operational friction). Users stay with mediocre services out of inertia.
  • Self-Custodial Model: If TM Global 100 underperforms expectations, users can withdraw immediately with zero friction. Token Metrics must continuously earn business through performance, not trap users through custody. This alignment of incentives produces better outcomes. Token Metrics succeeds only if TM Global 100 delivers value—not if we successfully retain custody.

Security Without Custodial Risk

Self-custody doesn't mean "no security"—it means security without counterparty risk. Token Metrics implements multiple security layers:

  • Wallet Security: Multi-Factor Authentication, Encryption, Rate Limiting, Device Fingerprinting, Session Management.
  • Smart Contract Security: Audited Code, Immutable Logic, Permission Controls, Upgrade Mechanisms.
  • Operational Security: No Centralized Custody, Separation of Duties, Monitoring Systems, Incident Response.
  • Recovery Security: Social Recovery, Time-Locked Recovery, Guardian Options, No Single Point of Failure.

This comprehensive security operates without Token Metrics ever holding custody—proving security and sovereignty aren't mutually exclusive.

The Regulatory Advantage

Self-custody provides regulatory benefits beyond security:

  • Reduced Compliance Burden: Token Metrics doesn't need custodial licenses or maintain costly compliance infrastructure for holdings we don't control.
  • Jurisdictional Flexibility: Users can access TM Global 100 based on their local regulations without Token Metrics needing approval in every jurisdiction (though we maintain appropriate licensing for our services).
  • Asset Protection: Government actions against Token Metrics don't freeze user funds—they're already in user wallets.
  • Portability: Regulatory changes in one region don't trap users—they control their funds and can move them freely.

As crypto regulations evolve globally, self-custodial models will likely face less restrictive treatment than custodial alternatives—another reason Token Metrics chose this architecture.

Decision Framework: Custodial vs. Self-Custodial Indices

  • Choose self-custodial indices (TM Global 100) if: You value financial sovereignty, censorship resistance, want on-chain verification, eliminate counterparty risk, are comfortable with wallet authentication, and desire instant withdrawal.
  • Consider custodial alternatives if: You prefer traditional finance models, want FDIC-style insurance (though limited), need institutional custody for compliance, are uncomfortable managing wallets, or prioritize traditional tax reporting.

For most crypto investors—especially those who understand why Bitcoin was created—self-custody is non-negotiable. TM Global 100 delivers sophisticated index strategies without compromising this core principle.

Conclusion: Trust Through Verification, Not Promises

The crypto industry has taught expensive lessons about custodial risk. Billions in user funds have vanished through exchange collapses, lending platform failures, and outright fraud. Each disaster reinforced crypto's founding principle: financial sovereignty requires self-custody.

Token Metrics built TM Global 100 to honor this principle. The index provides systematic diversification, weekly rebalancing, regime-based risk management, and institutional-grade execution—all while you maintain complete control of your funds. Token Metrics can't access your crypto, not because we promise not to, but because the smart contract architecture makes it impossible.

This isn't about not trusting Token Metrics. It's about not needing to trust Token Metrics—or anyone else—with custody of your capital. That's how crypto is supposed to work. You verify holdings on-chain. You control withdrawals. You authorize transactions. Token Metrics provides research, signals, and systematic execution. But your crypto stays yours.

As crypto matures, self-custodial infrastructure will become standard—not because it's idealistic, but because custodial alternatives have failed too many times, too catastrophically. Token Metrics is simply ahead of the curve. Not your keys, not your crypto. TM Global 100: your keys, your crypto.

Research

From Research to Execution: Turning Token Metrics Insights Into Trades

Token Metrics Team
8
MIN

You've spent 30 minutes analyzing Token Metrics' AI-powered ratings. VIRTUAL shows 89/100, RENDER at 82/100, JUP at 78/100. The market regime indicator flashes bullish. Your portfolio optimization tool suggests increasing exposure to AI and DePIN sectors. The research is clear: these tokens offer compelling risk-adjusted opportunities.

Then reality hits. You need to: calculate position sizes, open exchanges where these tokens trade, execute eight separate buy orders, track cost basis for each, set rebalancing reminders, monitor for exit signals, and repeat this process as ratings update weekly. Two hours later, you've bought two tokens and added "finish portfolio construction" to your weekend to-do list.

This is the execution gap—the chasm between knowing what to do and actually doing it. Token Metrics surveyed 5,200 subscribers in 2024: 78% reported "not fully implementing" their research-based strategies, with "time constraints" (42%), "operational complexity" (31%), and "decision fatigue" (19%) as primary barriers. The platform delivers world-class crypto intelligence to 50,000+ users, but turning insights into positions remained frustratingly manual—until TM Global 100 closed the loop.

The Research Excellence Problem

Token Metrics established itself as the premier crypto analytics platform through comprehensive, data-driven analysis. The platform provides:

  • AI-Powered Token Ratings: Token Metrics analyzes 6,000+ cryptocurrencies using machine learning models trained on:
    • Technical indicators: Price momentum, volume patterns, trend strength
    • Fundamental metrics: Developer activity, protocol revenue, tokenomics
    • On-chain data: Holder distribution, exchange flows, network growth
    • Market structure: Liquidity analysis, derivatives positioning
    • Sentiment analysis: Social trends, news sentiment, community engagement
  • Each token receives grades from 0-100 across multiple categories: Trader Grade, Investor Grade, Overall Grade, Risk Score.

The power: In Q3 2024, tokens rated 80+ outperformed the market by 47% on average over the following quarter. The research identifies opportunities with statistical edge.

The problem: Knowing VIRTUAL scores 89/100 doesn't automatically put it in your portfolio.

Market Regime Signals

Token Metrics' regime detection analyzes multi-factor conditions to classify market environments as bullish, bearish, or neutral. These signals inform portfolio positioning—should you be risk-on (full crypto exposure) or risk-off (defensive/stablecoins)?

Historical accuracy: Token Metrics' regime signals showed 68-72% directional accuracy over 4-8 week periods across 2022-2024, helping subscribers avoid the worst of bear market drawdowns.

The problem: When the signal flips bearish, you need to manually exit dozens of positions. Most subscribers acknowledged the signal but procrastinated execution—often until too late.

Trading Signals

Beyond broad regime indicators, Token Metrics provides specific entry/exit signals for individual tokens based on technical and fundamental triggers.

Example signals (October 2024):

  • SOL: "Strong buy" at $148 (reached $185 within 6 weeks)
  • RENDER: "Buy accumulation" at $5.20 (reached $7.80 within 8 weeks)
  • LINK: "Take partial profits" at $15.50 (consolidated to $12.20 over 4 weeks)

The problem: By the time you see the signal, research supporting rationale, decide position size, and execute—the entry has moved or the window closed.

Portfolio Optimization

Token Metrics' portfolio tools suggest optimal allocations based on your risk tolerance, time horizon, and conviction levels. They show which tokens to overweight, which to trim, and what overall exposure makes sense.

The insight: "Your portfolio is 45% BTC, 30% ETH, 25% alts. Optimal allocation for your risk profile: 35% BTC, 25% ETH, 40% high-rated alts with 5% in AI agents, 8% DePIN, 12% DeFi, 15% layer-1s."

The problem: Implementing these recommendations requires many trades, rebalancing calculations, tracking new cost basis, and ongoing maintenance.

The Execution Gap: Where Good Research Dies

Token Metrics' internal analysis revealed a striking pattern: subscribers using premium research features showed significantly better token selection (measured by ratings of holdings) but only marginally better performance than casual users. The bottleneck wasn't research quality—it was implementation.

Five Common Execution Failures

  1. Analysis Paralysis: "I spent three hours reviewing ratings and signals. Then I couldn't decide which tokens to prioritize, what position sizes to use, or when exactly to execute. I ended up doing nothing." The paradox: More information should enable better decisions. Instead, comprehensive research sometimes creates decision overload. With 50+ tokens rated 70+, which 10-15 do you actually buy?
  2. Implementation Friction: Even after deciding, execution proves tedious: Check which exchanges list each token, calculate position sizes maintaining diversification, execute orders across platforms, pay fees, track entry prices, set up monitoring. Most subscribers gave up after 3-5 tokens, leaving portfolios partially implemented and suboptimal.
  3. Timing Delays: Research with delayed execution captures a fraction of potential returns. For example, signals issued on Monday may be acted upon days later, missing ideal entry points and moves.
  4. Inconsistent Rebalancing: Monthly rebalancing optimizes portfolios but is operationally burdensome. Many subscribers rebalanced quarterly or less often, causing drift from optimal allocations.
  5. Emotional Override: When market signals turn bearish, the instinct to hold or doubt the research sometimes overrides systematic execution, leading to subpar outcomes.

The Missing Infrastructure: Automatic Implementation

Token Metrics recognized these patterns and asked: What if research insights automatically became portfolio positions? What if ratings updates triggered systematic rebalancing? What if regime signals executed defensive positioning without user decision-making? This led to TM Global 100 Index—Token Metrics' execution layer that converts research into action.

How TM Global 100 Implements Token Metrics Research

Research Input #1: Market Cap Rankings + Quality Screening

Token Metrics maintains data on 6,000+ tokens. TM Global 100 systematically holds the top 100 by market cap—correlating strongly with high-rated tokens (85%+ of top-100 score 60+).

Execution: Weekly rebalancing automatically updates holdings to current top-100, ensuring your portfolio aligns with market leaders.

Research Input #2: Market Regime Signals

When signals indicate bullish conditions, TM Global 100 holds the top-100 basket. When signals turn bearish, it shifts entirely to stablecoins. All transitions happen automatically, without manual intervention.

Research Input #3: Rebalancing Discipline

Weekly rebalancing is optimal for systematic profit-taking and reaccumulation. The index rebalances every Monday automatically, maintaining up-to-date weights without user effort.

Research Input #4: Diversification Principles

The index provides instant 100-token diversification through a single purchase, making broad exposure achievable in seconds compared to manual management.

Real Subscriber Stories: Before and After

Case Study 1: The Overwhelmed Analyst

Background: 29-year-old analyst since 2022, managing 25 tokens manually, spending 6-8 hours weekly. Missed opportunities due to operational hurdles. After TM Global 100 (2024): Portfolio automatically holds 100 tokens, rebalances weekly, with returns improving from +23% to +38%, and no missed opportunities.

Quote: "TM Global 100 turns every insight into an automatic position. Finally, my returns match the research quality."

Case Study 2: The Signal Ignorer

Background: 45-year-old focused on high conviction, ignoring regime signals. After TM Global 100 (2024): Systematic rebalancing and regime-based allocations improved risk management, with +42% return on the index. Quote: "Automation removed the psychological barrier. The research was always good; I was the broken execution layer."

Case Study 3: The Time-Strapped Professional

Background: 36-year-old limited time, holding just BTC and ETH. After TM Global 100 (2024): Automatic weekly rebalancing and comprehensive exposure increased returns from +18% to +41%. Quote: "Finally, research became ROI—no more operational burden."

The Feedback Loop: How TM Global 100 Improves Token Metrics Research

The system works bidirectionally. User data helps refine research by revealing which signals and features produce the best risk-adjusted results, and what visualization tools reduce operational hurdles. This cycle benefits all users through continuous improvement.

The Broader Execution Suite (Beyond TM Global 100)

Token Metrics is developing sector-specific indices, risk-stratified portfolios, and a portfolio sync tool to suit different strategies and risk levels. The goal is to provide flexible, automated solutions aligned with diverse user preferences.

Manual Implementation Guide (for those who prefer it)

For active managers, a structured weekly workflow can help bridge research and execution:

  1. Review market regime and weekly commentary (20 min)
  2. Assess ratings for holdings and potential entries (30 min)
  3. Execute trades, update records (15 min)
  4. Review portfolio and prepare next steps (15-25 min)

This approach balances active management with leveraging Token Metrics’ insights, reducing operational burden while maintaining control.

Cost-Benefit Analysis: Subscription + Index vs. Subscription Alone

Combining Token Metrics subscription with TM Global 100 can maximize value—automatic rebalancing, market regime adaptation, and broad diversification—delivering a streamlined, cost-effective way to implement research.

Conclusion: Close the Loop

Token Metrics offers exceptional AI-driven crypto analysis, market regime signals, and portfolio tools. However, transforming insights into actual positions is often where many miss out. TM Global 100 automates this process—turning research into systematic action, immediate risk management, and continuous portfolio renewal.

For subscribers frustrated with manual implementation or seeking a more systematic approach, TM Global 100 is the evolution from analysis platform to comprehensive investment solution. Great research deserves great execution—now it has it.

Research

Weekly Rebalancing in Crypto: Why Timing Matters More Than You Think

Token Metrics Team
11
MIN

Market cap rankings shift constantly in crypto. A token sitting at #73 on Monday might crash to #95 by Friday—or surge to #58. The frequency at which you rebalance your portfolio determines whether you're capturing these moves or missing them entirely. Too frequent and you bleed capital through excessive fees. Too rare and you drift from optimal exposure, holding yesterday's winners while missing today's opportunities.

Token Metrics' analysis of 50,000+ user portfolios and extensive backtesting reveals a clear pattern: weekly rebalancing occupies the sweet spot between accuracy and efficiency. Understanding why requires examining the mathematics of portfolio drift, the economics of execution costs, and the reality of crypto's volatility patterns. The data tells a compelling story about timing that most investors miss.

What Rebalancing Actually Does (And Why It Matters)

A top-100 crypto index aims to hold the 100 largest cryptocurrencies by market capitalization, weighted proportionally. But "largest" changes constantly, creating three types of drift:

  • Constituent Drift: Who's In, Who's Out
  • New Entries: A token pumps from #105 to #87, crossing into the top 100. Your index should now hold it, but won't unless you rebalance.
  • Exits: Another token crashes from #92 to #118, falling out of rankings. Your index should no longer hold it, but continues exposure until you rebalance.

Real Example (October 2024):

  1. Week 1: Virtuals Protocol (VIRTUAL) ranked #127, not in top-100 indices
  2. Week 2: Partnership announcement, token surges to #78
  3. Week 3: Continued momentum pushes it to #52
  4. Week 4: Stabilizes around #55-60

Daily rebalancing: Bought Day 9 at #98, captured full momentum to #52 (but paid daily trading fees)

Weekly rebalancing: Bought Week 2 at #78, captured move to #52 (one transaction fee)

Monthly rebalancing: Missed entry entirely if rebalance fell in Week 1; finally bought Week 5 at #55 (missed 30% of move)

Weekly rebalancing captured 85% of the opportunity at 1/7th the transaction frequency of daily rebalancing.

Weight Drift: Proportional Exposure

Even for tokens that remain in the top 100, relative weights change. Bitcoin's market cap might grow from 38% to 42% of the total top-100 market cap in a week. Without rebalancing, your index becomes increasingly concentrated in winners (good for momentum, bad for risk management) and underweight in mean-reverting opportunities.

Real Example (January 2025):

  1. January 1: Bitcoin comprises 38% of top-100 market cap
  2. January 15: Bitcoin rallies to $48k, now 43% of top-100 market cap
  3. January 31: Bitcoin consolidates, back to 40% of top-100 market cap

No rebalancing: Your Bitcoin exposure grew from 38% to 43% (concentrated risk), then dropped to 40% as you held through consolidation.

Weekly rebalancing: Week 3 rebalance sold Bitcoin at $47k (taking profits), redistributed to other top-100 tokens. Week 5 rebalance bought back Bitcoin at $44k (mean reversion capture).

This systematic profit-taking and reaccumulation is mathematically proven to enhance long-term returns through volatility capture—but only if rebalancing happens at optimal frequency.

Sector Drift: Narrative Rotation

Crypto sectors rotate leadership constantly. AI agent tokens dominate for three weeks, then gaming tokens take over, then DeFi protocols surge. Without rebalancing, your portfolio becomes accidentally concentrated in whatever sectors surged recently—exactly when they're due for consolidation.

Token Metrics' sector analysis tools track these rotations in real-time, identifying when sector weights have drifted significantly from market-cap optimal. Weekly rebalancing systematically captures these rotations better than longer intervals.

The Frequency Spectrum: Why Weekly Wins

Rebalancing frequency involves a fundamental tradeoff: accuracy vs. cost. Let's examine each option with real data.

Daily Rebalancing: Maximum Accuracy, Maximum Cost

Advantages:

  • Captures every constituent change within 24 hours
  • Maintains tightest tracking to target weights
  • Never holds tokens that fell below #100 for more than one day

Disadvantages:

  • 365 annual rebalances create massive transaction costs
  • Gas fees: ~$15-50 per rebalance Ă— 365 = $5,475-$18,250 annually
  • Trading spreads: ~0.3% per rebalance Ă— 365 = 109.5% annual drag
  • Over-trades noise: Many daily moves reverse within 72 hours
  • Increased tax complexity: Thousands of taxable events annually

Token Metrics Backtesting (2023-2024): Daily rebalancing captured 99.2% of theoretical index performance but paid 8.7% in annual execution costs. Net result: -7.5% underperformance vs. optimal frequency.

Daily rebalancing is like checking your tire pressure before every drive. Theoretically optimal, practically wasteful.

Monthly Rebalancing: Low Cost, High Drift

Advantages:

  • Only 12 annual rebalances minimize transaction costs
  • Gas fees: ~$25 per rebalance Ă— 12 = $300 annually
  • Trading spreads: ~0.3% per rebalance Ă— 12 = 3.6% annual drag
  • Simplified tax reporting: Manageable number of events

Disadvantages:

  • 4-week lag means holding dead tokens too long
  • Miss rapid narrative rotations entirely
  • Significant weight drift accumulates between rebalances
  • May hold tokens that exited top-100 for a month

Real Example (September-October 2024):

  1. September 1: Rebalance occurs, portfolio optimized
  2. September 15: AI agent narrative surges, five tokens enter top 100
  3. September 30: Gaming tokens pump, three new entries
  4. October 1: Next rebalance finally captures September moves—but momentum has peaked

Token Metrics Backtesting: Monthly rebalancing captured 91.3% of theoretical index performance paid only 1.2% in annual execution costs. Net result: -7.5% underperformance (similar to daily, but from drift instead of costs).

Quarterly Rebalancing: Unacceptable Drift

Token Metrics Data:

  • Quarterly rebalancing captured only 84.7% of theoretical performance
  • Paid 0.4% in execution costs
  • Net result: -15.3% underperformance

In crypto's fast-moving markets, 12-week gaps between rebalances create unacceptable tracking error. Quarterly works for traditional equity indices where constituents change slowly. In crypto, it's portfolio malpractice.

Weekly Rebalancing: The Goldilocks Frequency

Advantages:

  • Captures sustained moves (multi-day trends that matter)
  • Limits gas fees: ~$20 per rebalance Ă— 52 = $1,040 annually
  • Trading spreads: ~0.3% per rebalance Ă— 52 = 15.6% annual drag
  • Balances accuracy with cost efficiency
  • Avoids over-trading daily noise
  • Manageable tax complexity: ~52 events annually

Disadvantages:

  • Slightly higher costs than monthly (but far better tracking)
  • Slightly more drift than daily (but far lower costs)
  • Requires systematic automation (manual execution impractical)

Token Metrics Backtesting (2023-2024): Weekly rebalancing captured 97.8% of theoretical index performance and paid 1.8% in annual execution costs. Net result: -4.0% tracking error (best risk-adjusted performance).

Weekly rebalancing captures the meaningful moves (tokens entering/exiting top 100, sector rotations, major weight shifts) while avoiding the noise (daily volatility that reverses within 72 hours).

Real Performance Data: Weekly in Action

Let's examine specific periods where rebalancing frequency dramatically impacted returns.

Case Study 1: AI Agent Narrative (November-December 2024)

The AI agent token surge provides a perfect case study for rebalancing frequency impact.

Timeline:

  • November 1: No AI agent tokens in top 100
  • November 7: VIRTUAL enters at #98 (market cap: $580M)
  • November 14: VIRTUAL at #72 ($1.1B), AIXBT enters at #95 ($520M)
  • November 21: VIRTUAL at #58 ($1.6B), AIXBT at #81 ($780M), GAME enters at #97 ($505M)
  • November 28: Peak momentum, VIRTUAL at #52 ($1.8B)
  • December 5: Consolidation begins, VIRTUAL at #61 ($1.4B)

Daily Rebalancing Results:

Bought VIRTUAL on November 7 at $580M, captured full move. Added AIXBT November 14, GAME November 21. Sold VIRTUAL December 3 at $1.7B (near peak). Transaction count: 28 trades across three tokens. Execution costs: ~$420 in gas + $850 in spreads = $1,270. Gross gain: $12,400 on $5,000 position. Net gain after costs: $11,130 (224% return).

Weekly Rebalancing Results:

Bought VIRTUAL on November 11 rebalance at $820M (missed first 41% but captured 120%). Added AIXBT November 18, GAME November 25. Sold VIRTUAL December 2 rebalance at $1.65B. Transaction count: 4 trades. Costs: ~$80 in gas + $120 in spreads = $200. Gross gain: $10,100. Net after costs: $9,900 (198% return).

Monthly Rebalancing Results:

Bought VIRTUAL on December 1 rebalance at $1.5B (missed entire run-up). Next rebalance: January 1, likely selling at a loss. Result: Net loss of -$670 (-13%).

Verdict: Weekly captured 89% of daily's gross gains at 16% of transaction costs. Monthly missed the move entirely and bought at the worst time.

Case Study 2: Mean Reversion Capture (February 2024)

Rebalancing isn't just about capturing pumps—it's about systematically taking profits and reaccumulating during dips.

February 2024 Bitcoin Rally:

  • February 1: BTC at $43k, 38% of top-100 market cap
  • February 15: BTC at $52k (+21%), 44% of top-100
  • February 29: BTC at $61k (+42%), 46% of top-100

No Rebalancing: Your BTC position grew from 38% to 46%. When BTC corrected to $56k, your overweight position amplified losses. Weekly rebalancing: Rebalanced from 39% to 38%, selling $1k at $44k, then from 42% to 38%, selling $4k at $49k, and so on, systematically capturing profits during the rally.

This approach reduces downside risk and allows more capital to stay allocated to outperforming assets during consolidation.

Token Metrics: The intelligence behind optimal timing. Automated weekly rebalancing reduces emotional bias, captures sustained moves, and maintains disciplined risk management.

Choosing weekly rebalancing is one thing. Executing it systematically is another. Token Metrics has built the infrastructure to make weekly rebalancing effortless for TM Global 100 Index holders.

Automated Rebalance Execution

Every Monday at 00:00 UTC, Token Metrics' rebalancing engine:

  • Queries current market caps for all cryptocurrencies
  • Determines top-100 ranking using Token Metrics' proprietary data feeds
  • Calculates optimal weights based on market-cap proportions
  • Identifies required trades (buys, sells, weight adjustments)
  • Executes transactions via optimized smart contract batching
  • Updates holdings in real-time treemap and table views
  • Logs all transactions with timestamps, quantities, and fees

Users wake up Monday morning to updated portfolios—no action required.

Smart Execution Optimization

Token Metrics doesn't just rebalance mechanically. The platform's AI-powered execution algorithms optimize:

  • Slippage Minimization: Orders split across multiple liquidity sources (DEXs, aggregators) to minimize price impact
  • Gas Optimization: Transactions batched into single operations where possible, reducing network fees by 40-60%
  • Timing Within Window: Rebalances execute during optimal liquidity windows (avoiding thin overnight Asian hours)
  • Tax Efficiency: Where regulations permit, holding period awareness minimizes short-term capital gains

This sophisticated execution infrastructure—developed by Token Metrics as the leading crypto analytics platform—ensures that weekly rebalancing delivers theoretical benefits in practice, not just on paper.

Regime Switching + Weekly Rebalancing

TM Global 100 combines two mechanisms:

  • Weekly Rebalancing: Updates constituents and weights every Monday, maintaining optimal top-100 exposure
  • Regime Switching: Moves entire portfolio between crypto and stablecoins based on Token Metrics' market signals (happens as needed, not on schedule)

These work together seamlessly. During bullish regimes, weekly rebalancing optimizes exposure. When signals turn bearish, the entire portfolio exits to stablecoins—no more rebalancing until bullish signals return.

Example Flow: Weeks 1-8: Bullish regime, weekly rebalancing maintains top-100; Week 9: Market signals turn bearish, full exit to stablecoins; Weeks 10-14: Bearish regime, no rebalancing; Week 15: Bullish signals return, re-enter top-100. This dual approach provides both optimization and protection.

The Transparency & Cost Advantage

Token Metrics built TM Global 100 with radical transparency around rebalancing:

  • Pre-Rebalance Notification: Alerts 12 hours before Monday rebalances
  • Transaction Logs: Fully documented execution details
  • Holdings Updates: Treemap and table update in real-time
  • Strategy Explanation: Methodology page details reasons for changes

This transparency lets users verify that rebalancing follows stated rules—critical for trust in automated systems. Traditional index providers show "current holdings" but rarely document what changed and why. Token Metrics exposes everything.

Cost Preview & Efficiency

Projected rebalancing costs for TM Global 100:

  • Annual Platform Fee: 1.5-2.0% (pro-rated daily)
  • Weekly Gas Fees: ~$20 Ă— 52 = $1,040 annually
  • Trading Spreads: ~0.3% per rebalance Ă— 52 = 15.6% (actual ~8-12%) due to optimized execution
  • Total Annual Cost: ~10-14% in worst-case scenario, typically 6-9%

This is competitive compared to manual weekly, daily, or monthly rebalancing approaches which often incur higher costs or worse performance drift. Weekly systematic rebalancing via Token Metrics ensures consistent results with institutional-grade execution.

Decision Framework: Is Weekly Right For You?

Weekly rebalancing makes sense if:

  • You want systematic exposure to top-100 crypto
  • You value optimization without micromanagement
  • You understand that execution costs are an investment in accuracy
  • You trust data-driven timing over emotional decisions
  • You lack the time/infrastructure for manual weekly rebalancing

Consider alternatives if:

  • You hold fewer than 15 positions (manual rebalance manageable)
  • You have multidecade horizons where short-term drift is irrelevant
  • You prefer concentrated bets over diversification
  • You have institutional infrastructure with lower costs
  • You enjoy active management as a hobby

For most investors seeking broad crypto exposure, systematic weekly rebalancing offers an optimal balance of precision, cost-efficiency, and operational simplicity.

Conclusion: Discipline Over Frequency

The best rebalancing frequency isn't about minimizing costs or maximizing accuracy in isolation—it's about finding the optimal tradeoff and sticking to it. Daily rebalancing captures more but costs too much; monthly rebalancing saves costs but drifts too far; quarterly is too slow for crypto markets. Weekly rebalancing hits the "sweet spot": it captures sustained moves that truly matter, avoids daily noise, and remains feasible through automation. Token Metrics' TM Global 100 implements this optimal schedule with institutional-grade execution and transparency, making portfolio discipline automatic, regardless of market sentiment. In fast-moving crypto markets, timing matters more than you think. Weekly rebalancing proves that you don’t need perfect daily precision—you just need consistent discipline.

Choose from Platinum, Gold, and Silver packages
Reach with 25–30% open rates and 0.5–1% CTR
Craft your own custom ad—from banners to tailored copy
Perfect for Crypto Exchanges, SaaS Tools, DeFi, and AI Products