Crypto Basics

Types of Stablecoins: A Complete Guide for 2025

Discover the types of stablecoins—fiat-backed, crypto-backed, algorithmic, and commodity-based. Learn how they work, their pros and cons, and which is best for your crypto strategy in 2025.
Token Metrics Team
8 min
MIN

The cryptocurrency market is famous for volatility—Bitcoin can swing by thousands of dollars in a day, and altcoins can rise or crash in hours. But what if you need price stability? That’s where stablecoins come in.

Stablecoins are digital currencies pegged to stable assets like the US dollar, gold, or even algorithmically maintained price levels. They bridge the gap between the speed and efficiency of blockchain technology and the reliability of traditional money.

As of 2025, stablecoins account for over $140 billion in circulating supply, making them essential for traders, investors, and decentralized finance (DeFi) users. But not all stablecoins are the same—different types use different mechanisms to maintain their stability, each with unique pros and cons.

In this guide, we’ll break down the types of stablecoins, how they work, their risks, and which might be best for your needs.

What Are Stablecoins?

A stablecoin is a cryptocurrency designed to maintain a stable value by pegging its price to a reference asset. Most stablecoins are pegged to fiat currencies like the U.S. dollar (e.g., 1 USDT ≈ $1), but some track commodities (like gold) or are algorithmically balanced to hold value.

They are widely used for:

  • Trading: Moving quickly in and out of volatile assets.
  • DeFi: Providing liquidity, borrowing, and earning yields.
  • Remittances: Sending low-cost, fast cross-border payments.
  • Hedging: Protecting against crypto market volatility.

Types of Stablecoins

There are four main types of stablecoins:

  1. Fiat‑Collateralized Stablecoins
  2. Crypto‑Collateralized Stablecoins
  3. Algorithmic (Non‑Collateralized) Stablecoins
  4. Commodity‑Backed Stablecoins

Each has a different method of maintaining its peg. Let’s break them down.

1. Fiat‑Collateralized Stablecoins

Definition:
These are backed 1:1 by traditional currencies like the U.S. dollar, euro, or yen. For every stablecoin issued, an equivalent amount of fiat is held in reserve by a trusted custodian.

How They Work:
If you buy 1 USDC, Circle (its issuer) holds $1 in a regulated bank account or short-term U.S. Treasury securities. When you redeem that stablecoin, the issuer sends you the equivalent amount in fiat and burns the coin.

Examples:

  • Tether (USDT) – Largest stablecoin by market cap; widely used on exchanges.
  • USD Coin (USDC) – Issued by Circle, fully regulated and audited.
  • TrueUSD (TUSD) – Offers real-time attestation of reserves.
  • PayPal USD (PYUSD) – Launched by PayPal for payments and DeFi.

Pros:

  • High stability – Pegged directly to fiat.
  • Transparent – Many provide audits and attestations.
  • Easy adoption – Ideal for traders, merchants, and payment platforms.

Cons:

  • Centralization – Custodians control reserves and can freeze accounts.
  • Regulatory risks – Subject to government oversight.
  • Less transparency for some issuers – (e.g., Tether faced scrutiny over its reserves).

2. Crypto‑Collateralized Stablecoins

Definition:
These are backed by cryptocurrencies like Ethereum or Bitcoin instead of fiat. Because crypto is volatile, these stablecoins are overcollateralized (e.g., $150 in ETH backs $100 in stablecoins).

How They Work:
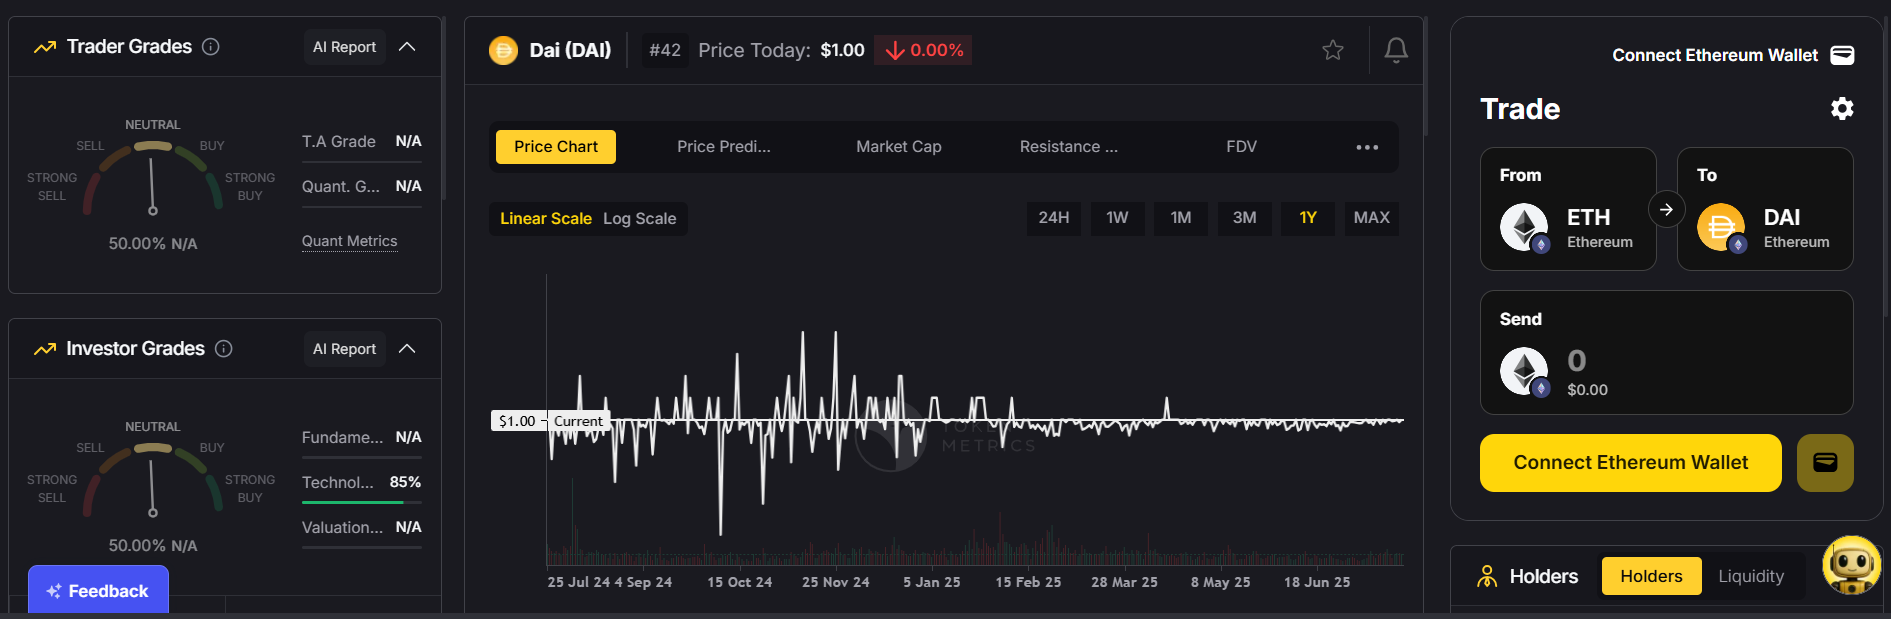
When you mint a crypto-backed stablecoin like DAI, you deposit collateral (e.g., ETH) into a smart contract. If the collateral value drops too much, the contract automatically liquidates some assets to maintain the peg.

Examples:

  • DAI – Issued by MakerDAO, backed by ETH, USDC, and other assets.


  • sUSD – A synthetic USD issued by Synthetix.
  • MIM (Magic Internet Money) – Collateralized by multiple crypto assets.

Pros:

  • Decentralized – No single company controls reserves.
  • Transparent – All collateral balances are viewable on-chain.
  • Resistant to censorship – Issuers can’t freeze accounts.

Cons:

  • Volatility risk – Collateral can lose value quickly, requiring liquidations.
  • Overcollateralization – Ties up more capital than fiat-backed options.
  • Complexity – Requires understanding of DeFi mechanics.

3. Algorithmic (Non‑Collateralized) Stablecoins

Definition:
These don’t use physical reserves. Instead, they maintain their peg via algorithmic supply adjustments—minting or burning tokens to balance price around $1.

How They Work:
If demand increases and the price rises above $1, the protocol mints more coins. If it falls below $1, the protocol burns coins or incentivizes users to buy them back.

Examples:

  • Ampleforth (AMPL) – Elastic supply adjusts daily.
  • UST (TerraUSD) – Infamously collapsed in 2022 after its peg broke.
  • Frax (FRAX) – Uses a hybrid model: partly collateralized, partly algorithmic.

Pros:

  • Highly capital-efficient – Doesn’t require large reserves.
  • Decentralized – Often governed by smart contracts and DAOs.

Cons:

  • Peg instability – Prone to “death spirals” when market confidence drops.
  • Complex mechanisms – Harder for average users to understand.
  • History of failures – UST/LUNA crash eroded trust in algorithmic coins.

4. Commodity‑Backed Stablecoins

Definition:
These stablecoins are pegged to commodities like gold, silver, or oil, giving them intrinsic value beyond fiat.

How They Work:
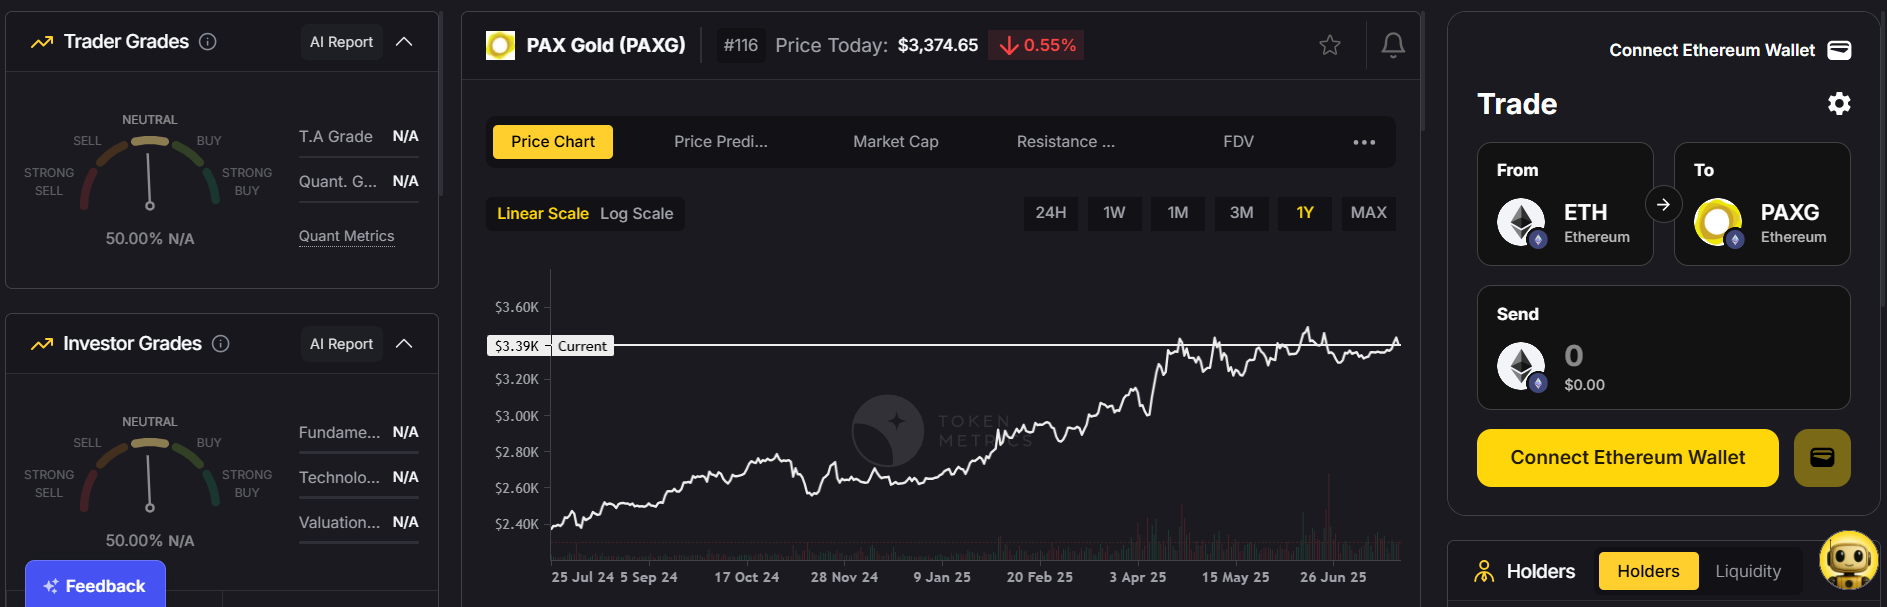
For every coin issued, an equivalent amount of the commodity is held in a secure vault. For example, owning 1 PAX Gold (PAXG) means you own 1 troy ounce of physical gold stored by the issuer.

Examples:

  • PAX Gold (PAXG) – Backed by physical gold.


  • Tether Gold (XAUT) – Gold-backed token from Tether.
  • Digix Gold (DGX) – Pegged to gold bars in Singapore vaults.

Pros:

  • Hedge against inflation – Commodities like gold retain value during economic uncertainty.
  • Diversification – Offers exposure to both crypto and commodities.

Cons:

  • Low liquidity – Less widely used than fiat-backed stablecoins.
  • Storage & audit challenges – Requires trust in the issuer to maintain reserves.

Why Do Stablecoins Matter?

Stablecoins are the backbone of DeFi and crypto trading.

  • Trading & arbitrage: They provide a quick way to exit volatile positions without converting back to fiat.
  • Cross-border payments: Cheaper and faster than SWIFT or remittance services.
  • DeFi participation: Essential for lending, borrowing, yield farming, and liquidity pools.
  • On-ramp/off-ramp: They simplify converting between traditional finance and blockchain.

Which Type of Stablecoin Should You Use?

If you want simplicity & security: Go with fiat-backed coins like USDC or PYUSD.

If you value decentralization: Choose crypto-collateralized options like DAI.

If you’re comfortable with high risk: Explore algorithmic models like FRAX (but beware of peg risks).

If you want inflation protection: Consider commodity-backed coins like PAXG.

Key Risks of Stablecoins

  • Regulation: Governments are increasing oversight of fiat-backed coins.
  • Centralization: Some issuers can freeze funds or blacklist wallets.
  • Smart contract risks: DeFi-based stablecoins can suffer from bugs or exploits.
  • Peg breaks: Algorithmic models are especially vulnerable to confidence loss.

The Future of Stablecoins

In 2025, stablecoins are evolving to meet regulatory and market demands:

  • Central Bank Digital Currencies (CBDCs): Governments are issuing digital dollars and euros, potentially competing with stablecoins.
  • Regulated issuers: Projects like USDC are working closely with regulators to ensure compliance.
  • Hybrid models: Combining fiat and algorithmic elements (e.g., Frax) to enhance stability.

As DeFi expands and global adoption grows, stablecoins will remain at the heart of crypto finance.

Final Thoughts

Stablecoins are more than just “digital dollars.” They’re a critical bridge between traditional finance and blockchain innovation.

  • Fiat-backed stablecoins bring stability and ease of use.
  • Crypto-collateralized ones offer transparency and decentralization.
  • Algorithmic models push innovation but carry higher risks.
  • Commodity-backed coins provide a hedge against inflation and diversify exposure.

Choosing the right type depends on your risk tolerance, use case, and trust level. Whether for trading, saving, or participating in DeFi, understanding the types of stablecoins can help you navigate the crypto ecosystem with confidence.

Build Smarter Crypto Apps &
AI Agents in Minutes, Not Months
Real-time prices, trading signals, and on-chain insights all from one powerful API.
Grab a Free API Key
Token Metrics Team
Token Metrics Team

Recent Posts

Research

Why Manual Crypto Portfolio Management Is Costing You Money (And Time)

Token Metrics Team
6
MIN

You're tracking 50+ tokens across three exchanges, updating your rebalancing spreadsheet every weekend, and second-guessing every exit decision at 2 AM. Sound familiar? Manual crypto portfolio management isn't just exhausting—it's expensive. Between missed rebalances, execution drag, and behavioral mistakes during volatility, DIY portfolio management quietly erodes returns before you see any market gains.

The data tells the story: investors who manually manage diversified crypto portfolios typically underperform comparable automated strategies by 12-18% annually, with 60% of that gap coming from operational inefficiency rather than market timing. If you're spending 10+ hours weekly maintaining positions, those hours have a cost—and it's higher than you think.

The Hidden Costs Destroying Your Returns

Time Drain: The 500-Hour Tax

Managing a diversified crypto portfolio demands constant vigilance. For investors holding 20+ positions, the weekly time investment breaks down to approximately:

  • Market monitoring: 5-8 hours tracking prices, news, and on-chain metrics
  • Rebalancing calculations: 2-3 hours determining optimal weights and required trades
  • Order execution: 3-5 hours placing trades across multiple platforms
  • Record keeping: 1-2 hours logging transactions for tax reporting
  • Research updates: 3-5 hours staying current on project developments

That's 14-23 hours weekly, or 728-1,196 hours annually. At a conservative $50/hour opportunity cost, you're spending $36,400-$59,800 in time value maintaining your portfolio. Even if you value your time at minimum wage, that's still $10,000+ in annual "sweat equity" that automated solutions eliminate.

Execution Drag: Death by a Thousand Trades

Small trades erode portfolios through accumulated friction. Every manual rebalance across a 50-token portfolio requires dozens of individual transactions, each incurring:

  • Trading fees: 0.1-0.5% per trade (average 0.25%)
  • Bid-ask spreads: 0.2-0.8% depending on liquidity
  • Slippage: 0.3-1.2% on smaller cap tokens
  • Gas fees: $2-50 per transaction depending on network congestion

For a $100,000 portfolio rebalanced monthly with 40 trades per rebalance, the costs add up:

  • Average cost per trade: ~$100
  • Monthly execution drag: $4,000
  • Annual execution drag: $48,000 (48% of portfolio value)

The smaller your individual trades, the worse the ratio becomes. A $500 rebalancing trade on a low-liquidity altcoin might pay $25 in fees—a 5% instant loss before any price movement.

Automated indices solve this. TM Global 100, Token Metrics' rules-based index, consolidates 100 individual positions into a single transaction at purchase, with weekly rebalances executed through optimized smart contract batching. Users typically save 3-7% annually in execution costs alone compared to manual approaches.

Behavioral Mistakes: Your Worst Enemy Is in the Mirror

Market psychology research shows that manual portfolio managers tend to make predictable, costly mistakes:

  • Panic selling during drawdowns: When Bitcoin drops 25% in a week, can you stick to your exit rules? Many override their plans during high volatility, often selling near local bottoms.
  • FOMO buying at peaks: Tokens up 300% in a week attract chase behavior, with managers entering after the movement is mostly over.
  • Rebalancing procrastination: Putting off rebalancing leads to drift, holding too much of past winners and missing new opportunities.

Token Metrics' systematic approach removes emotion from the equation. The TM Global 100 Index follows a transparent ruleset: hold the top 100 tokens by market cap during bullish phases, shift to stablecoins during bearish cycles, and rebalance weekly—eliminating emotional override and procrastination.

Missed Rebalances: Drifting Out of Position

Market cap rankings shift constantly. A token ranked #73 on Monday might hit #95 by Friday, or surge to #58. Without systematic rebalancing, your portfolio becomes a collection of recent winners or dumpers.

In Q3 2024, Solana ecosystem tokens surged while Ethereum DeFi tokens consolidated. Manual managers who missed weekly rebalances held too much ETH and insufficient SOL exposure. The result: 15-20% underperformance compared to systematically rebalanced portfolios. Data from Token Metrics shows that weekly rebalancing outperforms monthly or quarterly approaches by 8-12% annually.

Tax Reporting Nightmares

Every trade creates a taxable event. Manual managers executing over 200 trades yearly face:

  • Hours spent compiling transaction logs
  • Reconciliation across multiple exchanges
  • Cost-basis tracking for numerous lots
  • High professional accounting fees ($500-2,000+)

Automated solutions like Token Metrics provide transparent transaction logs for each rebalance, simplifying tax reporting and reducing accounting costs.

The Token Metrics Advantage: Research Meets Execution

Token Metrics has established itself as a leading crypto analytics platform, supporting over 50,000 users with AI-powered token ratings, market regime detection, portfolio optimization tools, and trading signals. But analysis alone isn't enough—implementation is crucial.

TM Global 100 Index bridges this gap. It turns research into actionable, tradeable products by automating rebalancing based on Token Metrics' signals and methodology. One click replaces hours of manual work, following a validated systematic approach.

Automation Without Compromise

The best automation is transparent. TM Global 100 offers:

  • Rules-Based Discipline: Bull markets—hold top 100 tokens; bear markets—move to stablecoins
  • Weekly rebalancing every Monday
  • Full methodology disclosure
  • One-Click execution via embedded self-custodial wallet
  • Real-time market insights and holdings visualization
  • Transaction logs with fees and timestamps

This streamlined process allows users to rapidly execute disciplined rebalancing, saving countless hours and increasing operational efficiency while maintaining asset control.

Decision Framework: When to Automate

Automation suits investors who:

  • Hold 15+ tokens and find rebalancing burdensome
  • Miss optimal rebalancing windows due to time constraints
  • Have experienced emotional trading decisions during volatility
  • Spend over 5 hours a week on portfolio management
  • Want broad exposure without manual tracking

Manual management may be suitable for those with fewer positions, active trading infrastructure, or tactical strategies. For most diversified portfolios, automation enhances efficiency and reduces operational errors.

The Compound Effect of Efficiency

Small inefficiencies compound over time. Over five years, a $50,000 portfolio managed manually with a 12% annual return minus 4-2-1% losses yields roughly a 5% net return, ending at about $63,814. A systematic approach with optimizer integration, zero behavioral errors, and regular rebalancing can attain a 13% net return, reaching approximately $92,246—an increase of over $28,000, not counting time saved.

Conclusion: Time Back, Returns Up

Manual crypto portfolio management made sense when portfolios were small and concentrated. Today’s diversified sets require operational discipline to prevent erosion of returns due to execution drag, missed rebalances, and emotional mistakes. Token Metrics built TM Global 100 to turn research into automated, transparent execution, reclaim your time, and boost portfolio discipline—without sacrificing control.

Research

Moonshots API: Discover Breakout Tokens Before the Crowd

Token Metrics Team
5
MIN

The biggest gains in crypto rarely come from the majors. They come from Moonshots—fast-moving tokens with breakout potential. The Moonshots API surfaces these candidates programmatically so you can rank, alert, and act inside your product. In this guide, you’ll call /v2/moonshots, display a high-signal list with TM Grade and Bullish tags, and wire it into bots, dashboards, or screeners in minutes. Start by grabbing your key at Get API Key, then Run Hello-TM and Clone a Template to ship fast.

What You’ll Build in 2 Minutes

  • A minimal script that fetches Moonshots via /v2/moonshots (optionally filter by grade/signal/limit).
  • A UI pattern to render symbol, TM Grade, signal, reason/tags, and timestamp—plus a link to token details.
  • Optional one-liner curl to smoke-test your key.
  • Endpoints to add next: /v2/tm-grade (one-score ranking), /v2/trading-signals, /v2/hourly-trading-signals (timing), /v2/resistance-support (stops/targets), /v2/quantmetrics (risk sizing), /v2/price-prediction (scenario ranges).

Why This Matters

Discovery that converts. Users want more than price tickers—they want a curated, explainable list of high-potential tokens. The Moonshots API encapsulates multiple signals into a short list designed for exploration, alerts, and watchlists you can monetize.

Built for builders. The endpoint returns a consistent schema with grade, signal, and context so you can immediately sort, badge, and trigger workflows. With predictable latency and clear filters, you can scale to dashboards, mobile apps, and headless bots without reinventing the discovery pipeline.

Where to Find The Moonshots API

The cURL request for the Moonshots endpoint is displayed in the top right of the API Reference. Grab it and start tapping into the potential!

  1. Get API Key — generate a key and start free.
  2. Run Hello-TM — verify your first successful call.
  3. Clone a Template — deploy a screener or alerts bot today.
  4. Compare plans: Scale confidently with API plans.

How It Works (Under the Hood)

The Moonshots endpoint aggregates a set of evidence—often combining TM Grade, signal state, and momentum/volume context—into a shortlist of breakout candidates. Each row includes a symbol, grade, signal, and timestamp, plus optional reason tags for transparency.

For UX, a common pattern is: headline list → token detail where you render TM Grade (quality), Trading Signals (timing), Support/Resistance (risk placement), Quantmetrics (risk-adjusted performance), and Price Prediction scenarios. This enables users to understand why a token was flagged and how to act with risk controls.

Polling vs webhooks. Dashboards typically poll with short-TTL caching. Alerting flows use scheduled jobs or webhooks to smooth traffic and avoid duplicates. Always make notifications idempotent.

Production Checklist

  • Respect plan caps; batch and throttle in clients/workers.
  • Use exponential backoff with jitter on 429/5xx; capture request IDs.
  • De-duplicate alerts and downstream actions.
  • Use memory/Redis with short TTLs; pre-warm during peak hours.
  • Fetch in pages if supported; parallelize within limits.
  • Sort primarily by tm_grade or composite; surface reason tags to build trust.
  • Track p95/p99, error rates, and alert delivery success; log variants.
  • Store keys securely; rotate regularly.

Use Cases & Patterns

  • Bot Builder (Headless): Filter for tokens appearing in Moonshots with tm_grade ≥ X. Confirm entry with /v2/trading-signals; place stops/targets with /v2/resistance-support; size via Quantmetrics.
  • Dashboard Builder (Product): Moonshots tab with badges (Bullish, Grade 80+, Momentum). Token detail page with TM Grade, Signals, S/R, and Predictions for a complete decision loop.
  • Screener Maker (Lightweight Tools): Top-N list with Follow/alert toggles; export CSV. Include “New this week” and “Graduated” sections for churn/entry dynamics.
  • Community/Content: Weekly digest highlighting new entrants, upgrades, and notable exits—link back to your product pages.

Next Steps

  1. Get API Key — generate a key and start free.
  2. Run Hello-TM — verify your first successful call.
  3. Clone a Template — deploy a screener or alerts bot today.
  4. Compare plans: Scale confidently with API plans.

FAQs

1) What does the Moonshots API return?

A list of breakout candidates with fields such as symbol, tm_grade, signal (often Bullish/Bearish), optional reason tags, and updated_at. Use it to drive discover tabs, alerts, and watchlists.

2) How fresh is the list? What about latency/SLOs?

The endpoint targets predictable latency and timely updates for dashboards and alerts. Use short-TTL caching and queued jobs/webhooks to avoid bursty polling.

3) How do I use Moonshots in a trading workflow?

Common stack: Moonshots for discovery, Trading Signals for timing, Support/Resistance for SL/TP, Quantmetrics for sizing, and Price Prediction for scenario context. Always backtest and paper-trade first.

4) I saw results like “+241%” and a “7.5% average return.” Are these guaranteed?

No. Any historical results are illustrative and not guarantees of future performance. Markets are risky; use risk management and testing.

5) Can I filter the Moonshots list?

Yes—pass parameters like min_grade, signal, and limit (as supported) to tailor to your audience and keep pages fast.

6) Do you provide SDKs or examples?

REST works with JavaScript and Python snippets above. Docs include quickstarts, Postman collections, and templates—start with Run Hello-TM.

7) Pricing, limits, and enterprise SLAs?

Begin free and scale up. See API plans for rate limits and enterprise options.

Research

Support and Resistance API: Auto-Calculate Smart Levels for Better Trades

Token Metrics Team
4
MIN

Most traders still draw lines by hand in TradingView. The support and resistance API from Token Metrics auto-calculates clean support and resistance levels from one request, so your dashboard, bot, or alerts can react instantly. In minutes, you’ll call /v2/resistance-support, render actionable levels for any token, and wire them into stops, targets, or notifications. Start by grabbing your key on Get API Key, then Run Hello-TM and Clone a Template to ship a production-ready feature fast.

What You’ll Build in 2 Minutes

A minimal script that fetches Support/Resistance via /v2/resistance-support for a symbol (e.g., BTC, SOL).

  • A one-liner curl to smoke-test your key.
  • A UI pattern to display nearest support, nearest resistance, level strength, and last updated time.

Next Endpoints to add

  • /v2/trading-signals (entries/exits)
  • /v2/hourly-trading-signals (intraday updates)
  • /v2/tm-grade (single-score context)
  • /v2/quantmetrics (risk/return framing)

Why This Matters

Precision beats guesswork. Hand-drawn lines are subjective and slow. The support and resistance API standardizes levels across assets and timeframes, enabling deterministic stops and take-profits your users (and bots) can trust.

Production-ready by design. A simple REST shape, predictable latency, and clear semantics let you add levels to token pages, automate SL/TP alerts, and build rule-based execution with minimal glue code.

Where to Find

Need the Support and Resistance data? The cURL request for it is in the top right of the API Reference for quick access.

👉 Keep momentum: Get API KeyRun Hello-TMClone a Template

How It Works (Under the Hood)

The Support/Resistance endpoint analyzes recent price structure to produce discrete levels above and below current price, along with strength indicators you can use for priority and styling. Query /v2/resistance-support?symbol=<ASSET>&timeframe=<HORIZON> to receive arrays of level objects and timestamps.

Polling vs webhooks. For dashboards, short-TTL caching and batched fetches keep pages snappy. For bots and alerts, use queued jobs or webhooks (where applicable) to avoid noisy, bursty polling—especially around market opens and major events.

Production Checklist

  • Rate limits: Respect plan caps; add client-side throttling.
  • Retries/backoff: Exponential backoff with jitter for 429/5xx; log failures.
  • Idempotency: Make alerting and order logic idempotent to prevent duplicates.
  • Caching: Memory/Redis/KV with short TTLs; pre-warm top symbols.
  • Batching: Fetch multiple assets per cycle; parallelize within rate limits.
  • Threshold logic: Add %-of-price buffers (e.g., alert at 0.3–0.5% from level).
  • Error catalog: Map common 4xx/5xx to actionable user guidance; keep request IDs.
  • Observability: Track p95/p99; measure alert precision (touch vs approach).
  • Security: Store API keys in a secrets manager; rotate regularly.

Use Cases & Patterns

  • Bot Builder (Headless): Use nearest support for stop placement and nearest resistance for profit targets. Combine with /v2/trading-signals for entries/exits and size via Quantmetrics (volatility, drawdown).
  • Dashboard Builder (Product): Add a Levels widget to token pages; badge strength (e.g., High/Med/Low) and show last touch time. Color the price region (below support, between levels, above resistance) for instant context.
  • Screener Maker (Lightweight Tools): “Close to level” sort: highlight tokens within X% of a strong level. Toggle alerts for approach vs breakout events.
  • Risk Management: Create policy rules like “no new long if price is within 0.2% of strong resistance.” Export daily level snapshots for audit/compliance.

Next Steps

  • Get API Key — generate a key and start free.
  • Run Hello-TM — verify your first successful call.
  • Clone a Template — deploy a levels panel or alerts bot today.
  • Watch the demo: Compare plans: Scale confidently with API plans.

FAQs

1) What does the Support & Resistance API return?

A JSON payload with arrays of support and resistance levels for a symbol (and optional timeframe), each with a price and strength indicator, plus an update timestamp.

2) How timely are the levels? What are the latency/SLOs?

The endpoint targets predictable latency suitable for dashboards and alerts. Use short-TTL caching for UIs, and queued jobs or webhooks for alerting to smooth traffic.

3) How do I trigger alerts or trades from levels?

Common patterns: alert when price is within X% of a level, touches a level, or breaks beyond with confirmation. Always make downstream actions idempotent and respect rate limits.

4) Can I combine levels with other endpoints?

Yes—pair with /v2/trading-signals for timing, /v2/tm-grade for quality context, and /v2/quantmetrics for risk sizing. This yields a complete decide-plan-execute loop.

5) Which timeframe should I use?

Intraday bots prefer shorter horizons; swing/position dashboards use daily or higher-timeframe levels. Offer a timeframe toggle and cache results per setting.

6) Do you provide SDKs or examples?

Use the REST snippets above (JS/Python). The docs include quickstarts, Postman collections, and templates—start with Run Hello-TM.

7) Pricing, limits, and enterprise SLAs?

Begin free and scale as you grow. See API plans for rate limits and enterprise SLA options.

Disclaimer

This content is for educational purposes only and does not constitute financial advice. Always conduct your own research before making any trading decisions.

Choose from Platinum, Gold, and Silver packages
Reach with 25–30% open rates and 0.5–1% CTR
Craft your own custom ad—from banners to tailored copy
Perfect for Crypto Exchanges, SaaS Tools, DeFi, and AI Products