Back to blog
Research

AAVE Price Prediction 2027: $70-$2,175 Forecast Analysis

Actionable Aave price prediction with scenario math, on-chain grades, and a clear TLDR for investors looking at 2027.
Token Metrics Team
9 min read
Want Smarter Crypto Picks—Free?
See unbiased Token Metrics Ratings for BTC, ETH, and top alts.
Thank you! Your submission has been received!
Oops! Something went wrong while submitting the form.
 No credit card | 1-click unsubscribe

AAVE Price Prediction 2027: Market Analysis and Scenario-Based Forecasts

Market Context for Aave Price Prediction: The Case for 2027

DeFi protocols are maturing beyond early ponzi dynamics toward sustainable revenue models. Aave operates in this evolving landscape where real yield and proven product-market fit increasingly drive valuations rather than speculation alone. Growing regulatory pressure on centralized platforms creates tailwinds for decentralized alternatives—factors that inform our comprehensive AAVE price prediction framework.

The scenario bands below reflect how AAVE price predictions might perform across different total crypto market cap environments. Each tier represents a distinct liquidity regime, from bear conditions with muted DeFi activity to moon scenarios where decentralized infrastructure captures significant value from traditional finance.


Disclosure

Educational purposes only, not financial advice. Crypto is volatile, do your own research and manage risk.

How to Read This AAVE Price Prediction

Each band blends cycle analogues and market-cap share math with TA guardrails. Base assumes steady adoption and neutral or positive macro. Moon layers in a liquidity boom. Bear assumes muted flows and tighter liquidity.

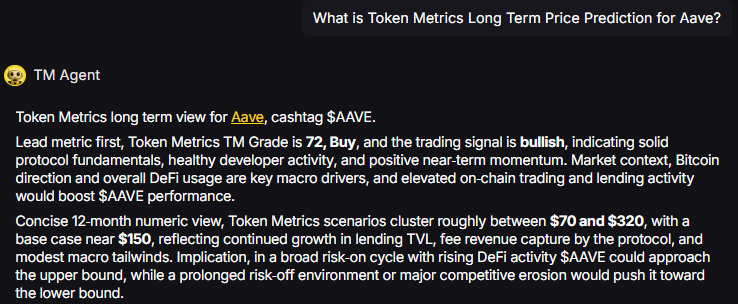
TM Agent baseline: Token Metrics TM Grade is 72, Buy, and the trading signal is bullish, indicating solid protocol fundamentals, healthy developer activity, and positive near-term momentum. Concise twelve-month numeric view, Token Metrics price prediction scenarios cluster roughly between $70 and $320, with a base case near $150, reflecting continued growth in lending TVL, fee revenue capture by the protocol, and modest macro tailwinds.

Live details: Aave Token Details

Affiliate Disclosure: We may earn a commission from qualifying purchases made via this link, at no extra cost to you.

Key Takeaways

  • Scenario driven, outcomes hinge on total crypto market cap, higher liquidity and adoption lift the bands.
  • Fundamentals: Fundamental Grade 75.51% (Community 77%, Tokenomics 100%, Exchange 100%, VC 49%, DeFi Scanner 70%).
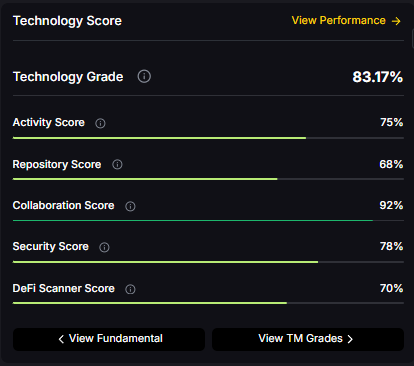
  • Technology: Technology Grade 83.17% (Activity 75%, Repository 68%, Collaboration 92%, Security 78%, DeFi Scanner 70%).
  • TM Agent gist: scenarios cluster between $70 and $320 with base near $150, assuming steady lending TVL growth and neutral macro conditions.
  • Education only, not financial advice.

AAVE Price Prediction Scenario Analysis

Our Token Metrics price prediction framework spans four market cap tiers, each representing different levels of crypto market maturity and liquidity:

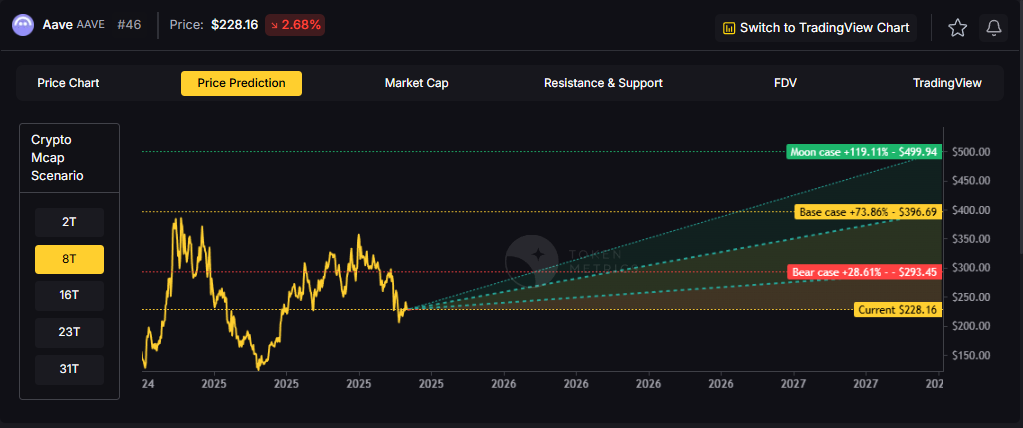
8T Market Cap - AAVE Price Prediction:

At an 8 trillion dollar total crypto market cap, AAVE projects to $293.45 in bear conditions, $396.69 in the base case, and $499.94 in bullish scenarios.

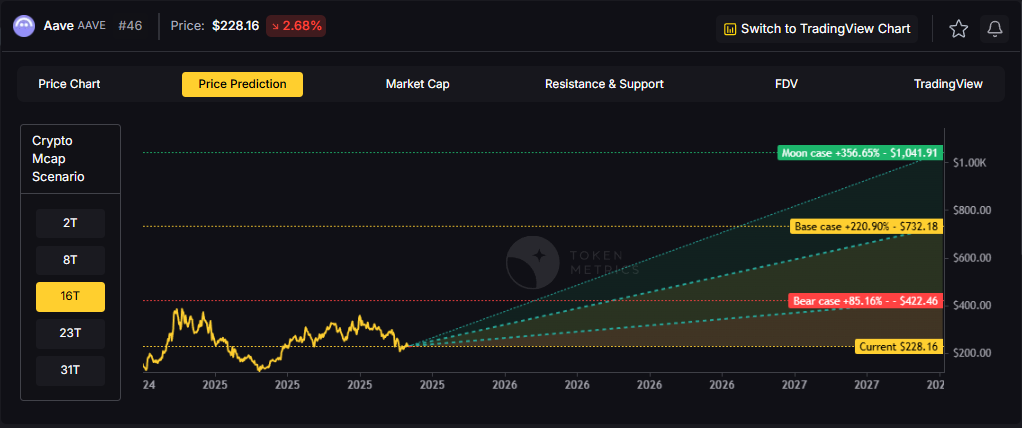
16T Market Cap - AAVE Price Prediction:

Doubling the market to 16 trillion expands the price prediction range to $427.46 (bear), $732.18 (base), and $1,041.91 (moon).

23T Market Cap - AAVE Price Prediction:

At 23 trillion, the price prediction scenarios show $551.46, $1,007.67, and $1,583.86 respectively.

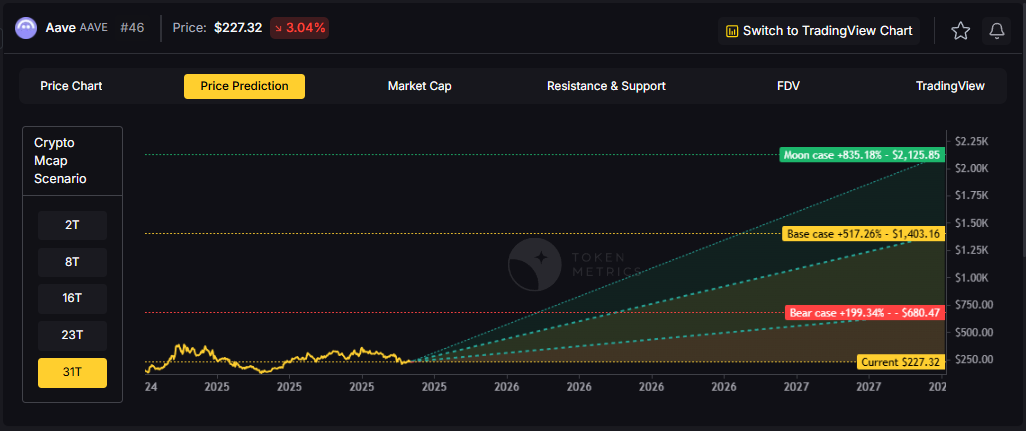
31T Market Cap - AAVE Price Prediction:

In the maximum liquidity scenario of 31 trillion, AAVE price predictions could reach $680.47 (bear), $1,403.16 (base), or $2,175.85 (moon).

Each tier assumes progressively stronger market conditions, with the base case price prediction reflecting steady growth and the moon case requiring sustained bull market dynamics.

Why Consider the Indices with Top-100 Exposure

Aave represents one opportunity among hundreds in crypto markets. Token Metrics Indices bundle AAVE with top one hundred assets for systematic exposure to the strongest projects. Single tokens face idiosyncratic risks that diversified baskets mitigate.

Historical index performance demonstrates the value of systematic diversification versus concentrated positions.

Join the early access list

What Is Aave?

Aave is a decentralized lending protocol that operates across multiple EVM-compatible chains including Ethereum, Polygon, Arbitrum, and Optimism. The network enables users to supply crypto assets as collateral and borrow against them in an over-collateralized manner, with interest rates dynamically adjusted based on utilization.

The AAVE token serves as both a governance asset and a backstop for the protocol through the Safety Module, where stakers earn rewards in exchange for assuming shortfall risk. Primary utilities include voting on protocol upgrades, fee switches, collateral parameters, and new market deployments.

Token Metrics AI Analysis

Token Metrics AI provides comprehensive context on Aave's positioning and challenges.

Vision: Aave aims to create an open, accessible, and non-custodial financial system where users have full control over their assets. Its vision centers on decentralizing credit markets and enabling seamless, trustless lending and borrowing across blockchain networks.

Problem: Traditional financial systems often exclude users due to geographic, economic, or institutional barriers. Even in crypto, accessing credit or earning yield on idle assets can be complex, slow, or require centralized intermediaries. Aave addresses the need for transparent, permissionless, and efficient lending and borrowing markets in the digital asset space.

Solution: Aave uses a decentralized protocol where users supply assets to liquidity pools and earn interest, while borrowers can draw from these pools by posting collateral. It supports features like variable and stable interest rates, flash loans, and cross-chain functionality through its Layer 2 and multi-chain deployments. The AAVE token is used for governance and as a safety mechanism via its staking program (Safety Module).

Market Analysis: Aave is a leading player in the DeFi lending sector, often compared with protocols like Compound and Maker. It benefits from strong brand recognition, a mature codebase, and ongoing innovation such as Aave Arc for institutional pools and cross-chain expansion. Adoption is driven by liquidity, developer activity, and integration with other DeFi platforms. Key risks include competition from newer lending protocols, regulatory scrutiny on DeFi, and smart contract risks. As a top DeFi project, Aave's performance reflects broader trends in decentralized finance, including yield demand, network security, and user trust. Its multi-chain strategy helps maintain relevance amid shifting ecosystem dynamics.

Fundamental and Technology Snapshot from Token Metrics

Fundamental Grade: 75.51% (Community 77%, Tokenomics 100%, Exchange 100%, VC 49%, DeFi Scanner 70%).


Technology Grade: 83.17% (Activity 75%, Repository 68%, Collaboration 92%, Security 78%, DeFi Scanner 70%).

Catalysts That Skew AAVE Price Predictions Bullish

  • Institutional and retail access expands with ETFs, listings, and integrations
  • Macro tailwinds from lower real rates and improving liquidity
  • Product or roadmap milestones such as upgrades, scaling, or partnerships

Risks That Skew AAVE Price Predictions Bearish

  • Macro risk-off from tightening or liquidity shocks
  • Regulatory actions or infrastructure outages
  • Concentration or competitive displacement in lending

AAVE Price Prediction FAQs

Can AAVE reach $1,000?

Yes. Based on our price prediction scenarios, AAVE could reach $1,007.67 in the 23T base case and $1,041.91 in the 16T moon case. Not financial advice.

Can AAVE 10x from current levels?

At current price of $228.16, a 10x would reach $2,281.60. This falls within the 31T moon case price prediction at $2,175.85 (only slightly below), and would require extreme liquidity expansion. Not financial advice.

What price could AAVE reach in the moon case?

Our moon case price predictions range from $499.94 at 8T to $2,175.85 at 31T. These scenarios assume maximum liquidity expansion and strong Aave adoption. Not financial advice.

What is the AAVE price prediction for 2027?

Our comprehensive 2027 price prediction framework suggests AAVE could trade between $293.45 and $2,175.85, depending on market conditions and total crypto market capitalization. The base case scenario clusters around $396.69 to $1,403.16 across different market cap environments. Not financial advice.

Is AAVE a good investment based on price predictions?

AAVE shows strong fundamentals (75.51% grade) and technology scores (83.17% grade), with bullish trading signals. However, all price predictions involve uncertainty and risk. Always conduct your own research and consult financial advisors before investing. Not financial advice.


Next Steps

Track live grades and signals: Token Details 

Join Indices Early Access

Want exposure? Buy AAVE on MEXC 

Disclosure

Educational purposes only, not financial advice. Crypto is volatile, do your own research and manage risk.

Why Use Token Metrics?

  • AI-driven crypto and DeFi grades for risk management and alpha discovery.
  • Quantitative, on-chain signals and robust scenario modeling for tokens like AAVE.
  • Access in-depth research reports, analyst perspectives, auto-grades, and portfolio tools from Token Metrics.
Build Smarter Crypto Apps &
AI Agents in Minutes, Not Months
Real-time prices, trading signals, and on-chain insights all from one powerful API.
Grab a Free API Key
About Token Metrics
Token Metrics: AI-powered crypto research and ratings platform. We help investors make smarter decisions with unbiased Token Metrics Ratings, on-chain analytics, and editor-curated “Top 10” guides. Our platform distills thousands of data points into clear scores, trends, and alerts you can act on.
30 Employees
analysts, data scientists, and crypto engineers
Daily Briefings
concise market insights and “Top Picks”
Transparent & Compliant
Sponsored ≠ Ratings; research remains independent
Want Smarter Crypto Picks—Free?
See unbiased Token Metrics Ratings for BTC, ETH, and top alts.
Thank you! Your submission has been received!
Oops! Something went wrong while submitting the form.
 No credit card | 1-click unsubscribe
Token Metrics Team
Token Metrics Team

Recent Posts

Research

Cronos Price Prediction 2027: $0.10-$1.46 Target Analysis

Token Metrics Team
9 min read

Cronos Price Prediction: Portfolio Context for CRO in the 2027 Landscape

Layer 1 tokens like Cronos represent bets on specific blockchain architectures winning developer and user mindshare. CRO carries both systematic crypto risk and unsystematic risk from Cronos's technical roadmap execution and ecosystem growth. Multi-chain thesis suggests diversifying across several L1s rather than concentrating in one, since predicting which chains will dominate remains difficult.

The price prediction projections below show how CRO might perform under different market cap scenarios. While Cronos may have strong fundamentals, prudent portfolio construction balances L1 exposure across Ethereum, competing smart contract platforms, and Bitcoin to capture the sector without overexposure to any single chain's fate.

Disclosure

Educational purposes only, not financial advice. Crypto is volatile, do your own research and manage risk.

How to read this price prediction:

Each band blends cycle analogues and market-cap share math with TA guardrails. Base assumes steady adoption and neutral or positive macro. Moon layers in a liquidity boom. Bear assumes muted flows and tighter liquidity.

TM Agent baseline:

Token Metrics price prediction scenarios center roughly between $0.03 and $0.28, with a base case price target near $0.10, assuming steady ecosystem growth, continued cross-chain demand, and no major security incidents.

Live details: Token Details 

The Case for Diversified Index Exposure

Portfolio theory teaches that diversification is the only free lunch in investing. CRO concentration violates this principle by tying your crypto returns to one protocol's fate. Token Metrics Indices blend Cronos with the top one hundred tokens, providing broad exposure to crypto's growth while smoothing volatility through cross-asset diversification. This approach captures market-wide tailwinds without overweighting any single point of failure.

Systematic rebalancing within index strategies creates an additional return source that concentrated positions lack. As some tokens outperform and others lag, regular rebalancing mechanically sells winners and buys laggards, exploiting mean reversion and volatility. Single-token holders miss this rebalancing alpha and often watch concentrated gains evaporate during corrections while index strategies preserve more gains through automated profit-taking.

Beyond returns, diversified indices improve the investor experience by reducing emotional decision-making. Concentrated CRO positions subject you to severe drawdowns that trigger panic selling at bottoms. Indices smooth the ride through natural diversification, making it easier to maintain exposure through full market cycles.

Get early access

What Is Cronos?

Cronos is an EVM-compatible blockchain built to support decentralized applications with high throughput and low transaction costs. The network is designed to bridge the gap between crypto and traditional finance, offering interoperability with Ethereum and Cosmos ecosystems. Its focus on scalability and developer-friendly infrastructure aims to attract DeFi, NFT, and gaming projects.

CRO serves as the native utility token of the Cronos ecosystem, used for transaction fees, staking, and governance. It enables users to participate in network security, pay for smart contract execution, and access services within the Cronos DeFi ecosystem. Common usage patterns include staking for rewards, providing liquidity in DeFi protocols, and facilitating cross-chain transfers.

Key Takeaways for CRO Price Prediction

  • Scenario driven: price prediction outcomes hinge on total crypto market cap; higher liquidity and adoption lift the price targets
  • Single-asset concentration amplifies both upside and downside versus diversified approaches
  • Fundamentals: Fundamental Grade 72.71% (Community 55%, Tokenomics 60%, Exchange 100%, VC N/A, DeFi Scanner 83%)
  • Technology: Technology Grade 81.41% (Activity 64%, Repository 74%, Collaboration 82%, Security N/A, DeFi Scanner 83%)
  • TM Agent gist: Base price prediction near $0.10 amid steady growth
  • Education only, not financial advice

Cronos Price Prediction: Scenario Analysis

8T Market Cap Price Prediction:

At an 8 trillion dollar total crypto market cap, CRO price prediction projects to $0.14 in bear conditions, $0.29 in the base case, and $0.34 in bullish scenarios.

16T Market Cap Price Prediction:

Doubling the market to 16 trillion expands the price prediction range to $0.43 (bear), $0.57 (base), and $0.71 (moon).

23T Market Cap Price Prediction:

At 23 trillion, the price forecast scenarios show $0.62, $0.85, and $1.09 respectively.

31T Market Cap Price Prediction:

In the maximum liquidity scenario of 31 trillion, CRO price prediction could reach $0.81 (bear), $1.13 (base), or $1.46 (moon).


These price prediction ranges illustrate potential outcomes for concentrated CRO positions, but investors should weigh whether single-asset exposure matches their risk tolerance or whether diversified strategies better suit their objectives.

Fundamental and Technology Snapshot from Token Metrics

Fundamental Grade: 72.71% (Community 55%, Tokenomics 60%, Exchange 100%, VC N/A, DeFi Scanner 83%).


Technology Grade: 81.41% (Activity 64%, Repository 74%, Collaboration 82%, Security N/A, DeFi Scanner 83%).


Catalysts That Skew Bullish for Price Prediction

  • Institutional and retail access expands with ETFs, listings, and integrations
  • Macro tailwinds from lower real rates and improving liquidity
  • Product or roadmap milestones such as upgrades, scaling, or partnerships
  • These factors could push CRO toward higher price prediction targets

Risks That Skew Bearish for Price Prediction

  • Macro risk-off from tightening or liquidity shocks
  • Regulatory actions or infrastructure outages
  • Concentration in validator economics and competitive displacement
  • Protocol-specific execution risk and competitive pressure from alternatives
  • These factors could push CRO toward lower price prediction scenarios

FAQs: Cronos Price Prediction

Can CRO reach $1 according to price predictions?

Based on the price prediction scenarios, CRO could reach $1 in the 23T moon case where it projects to $1.09, and in the 31T scenarios where the base case is $1.13 and the moon case is $1.46. These price prediction outcomes require both broad market cap expansion and Cronos maintaining competitive position. Not financial advice.

What's the risk/reward profile for CRO price prediction?

Risk/reward in our price prediction model spans from $0.14 in the lowest bear case to $1.46 in the highest moon case. Downside risks include regulatory or infrastructure shocks and competitive displacement, while upside drivers include liquidity expansion and roadmap execution. Concentrated positions amplify both tails, while diversified strategies smooth outcomes.

What gives CRO value and impacts price predictions?

CRO accrues value through transaction fees, staking, and governance utility across the Cronos ecosystem. Demand drivers include DeFi activity, cross-chain usage, and network services. While these fundamentals matter for price predictions, diversified portfolios capture value accrual across multiple tokens rather than betting on one protocol's success.

What is the 2027 Cronos price prediction?

Based on Token Metrics analysis, the 2027 price prediction for Cronos centers around $0.10 in the base case, with potential for higher targets ($0.57-$1.13) in bullish scenarios if the total crypto market expands significantly. Moon case price predictions range up to $1.46 at maximum liquidity.

Next Steps

Disclosure
Educational purposes only, not financial advice. Crypto is volatile, concentration amplifies risk, and diversification is a fundamental principle of prudent portfolio construction. Do your own research and manage risk appropriately.

Research

Shiba Inu Price Prediction 2027: SHIB Forecast & Risk Warning

Token Metrics Team
6 min read

Shiba Inu Price Prediction: Understanding SHIB's Speculative Nature

Shiba Inu operates as a community-driven meme token where price action stems primarily from social sentiment, attention cycles, and speculative trading rather than fundamental value drivers. SHIB exhibits extreme volatility with no defensive characteristics or revenue-generating mechanisms typical of utility tokens. Token Metrics price prediction scenarios below provide technical price forecasts across different market cap environments, though meme tokens correlate more strongly with viral trends and community engagement than systematic market cap models. Positions in SHIB should be sized as high-risk speculative bets with potential for total loss.


Disclosure

Educational purposes only, not financial advice. Crypto is volatile, do your own research and manage risk.

How to read this price prediction:

Each band blends cycle analogues and market-cap share math with TA guardrails. Base assumes steady adoption and neutral or positive macro. Moon layers in a liquidity boom. Bear assumes muted flows and tighter liquidity. For meme tokens, actual price prediction outcomes depend heavily on social trends and community momentum beyond what market cap models capture.

TM Agent baseline:

Token Metrics TM Grade is 24.1%, Sell, with a bearish trading signal. The concise 12‑month numeric price prediction view centers between $0.000005 and $0.000035, with a base case price target near $0.000012.

TM Agent numeric view: scenarios center roughly between $0.000005 and $0.000035, with a base case near $0.000012.

Live details: Token Details 

Key Takeaways for SHIB Price Prediction

  • Highly speculative asset driven by sentiment and attention rather than fundamentals
  • Scenario driven: price prediction outcomes hinge on total crypto market cap and viral momentum
  • Extreme volatility characteristic - SHIB can experience double-digit percentage moves daily
  • TM Agent gist: Bearish short term, price prediction range $0.000005–$0.000035
  • Entertainment risk only, not financial advice

Shiba Inu Price Prediction: Scenario Analysis

Token Metrics price prediction scenarios provide technical price bands across market cap tiers:

8T Market Cap Price Prediction:

At 8 trillion total crypto market cap, SHIB price prediction projects to $0.041998 (bear), $0.042366 (base), and $0.042734 (moon).

16T Market Cap Price Prediction:

At 16 trillion total crypto market cap, SHIB price forecast projects to $0.043973 (bear), $0.045077 (base), and $0.046182 (moon).

23T Market Cap Price Prediction:

At 23 trillion total crypto market cap, SHIB price prediction projects to $0.045948 (bear), $0.047789 (base), and $0.049629 (moon).

  31T Market Cap Price Prediction:

At 31 trillion total crypto market cap, SHIB price prediction projects to $0.047923 (bear), $0.051050 (base), and $0.051307 (moon).

 These technical price prediction ranges assume meme tokens maintain market cap share proportional to overall crypto growth. Actual outcomes for speculative tokens typically exhibit higher variance and stronger correlation to social trends than these price prediction models predict.

What Is Shiba Inu?

Shiba Inu is a meme-born crypto project that centers on community and speculative culture. Unlike utility tokens with specific use cases, SHIB operates primarily as a speculative asset and community symbol. The project focuses on community engagement and entertainment value.

SHIB has demonstrated viral moments and community loyalty within the broader meme token category. The token trades on community sentiment and attention cycles more than fundamentals. Market performance depends heavily on social media attention and broader meme coin cycles.

Risks That Skew Bearish for Price Prediction

  • Extreme volatility from pure sentiment-driven price action with no fundamental support
  • Attention cycles shift rapidly, leaving early viral tokens abandoned as new memes emerge
  • Liquidity can evaporate quickly during downturns, creating severe slippage and exit difficulty
  • Regulatory scrutiny may target meme tokens as securities or gambling instruments
  • Macro risk-off environments hit speculative assets hardest, with meme coins showing largest drawdowns
  • Community fragmentation or developer abandonment can eliminate remaining narrative support
  • These factors could push SHIB price predictions toward the lower bear scenarios

Make Your Next Move with Token Metrics

Token Metrics provides technical analysis, scenario math, price prediction models, and rigorous risk evaluation for hundreds of crypto tokens. Want to dig deeper? Explore our powerful AI-powered ratings and scenario tools here.

FAQs: Shiba Inu Price Prediction

Will SHIB 10x from here according to price predictions?

At current price of $0.041027, a 10x reaches $0.41027. This level does not appear in any of the listed bear, base, or moon price prediction scenarios across 8T, 16T, 23T, or 31T tiers. Meme tokens can 10x rapidly during viral moments but can also lose 90%+ just as quickly. Position sizing for potential total loss is critical. Not financial advice.

What are the biggest risks to SHIB price predictions?

Primary risks include attention shifting to newer memes, community fragmentation, developer abandonment, regulatory crackdowns, and liquidity collapse during downturns. Unlike utility tokens with defensive characteristics, SHIB has zero fundamental floor. Price can approach zero if community interest disappears. Total loss is a realistic outcome that price prediction models cannot fully account for. Not financial advice.

What is the 2027 Shiba Inu price prediction?

Based on Token Metrics analysis, the 2027 price prediction for SHIB centers around $0.000012 in the base case under current market conditions. However, meme token price predictions are highly unreliable due to extreme dependence on social trends, viral cycles, and community sentiment that can change rapidly. These technical price prediction ranges should be viewed with extreme caution.

Can SHIB reach $0.01 according to price predictions?

Based on the price prediction scenarios across all market cap tiers (8T-31T), SHIB projections range from $0.041998 to $0.051307. While these technical price predictions show SHIB trading above $0.04, the extreme volatility and sentiment-driven nature of meme tokens means actual outcomes can vary dramatically from model projections. Not financial advice.


Next Steps

Track live data: Token Details

• Consider fundamental crypto assets with utility and defensive characteristics rather than pure speculation.

Disclosure

Educational purposes only, not financial advice. SHIB is a highly speculative asset with extreme volatility and high risk of total loss. Meme tokens operate as entertainment and gambling instruments rather than investments. Only allocate capital you can afford to lose entirely. Do your own research and manage risk appropriately.

Research

WhiteBIT Coin Price Prediction 2028: $40-$272 Target Analysis

Token Metrics Team
7 min read

WhiteBIT Coin Price Prediction: Portfolio Context for WBT in the 2028 Landscape

Exchange tokens like WhiteBIT Coin offer leveraged exposure to overall market activity, creating concentration risk around a single platform's success. While WBT can deliver outsized returns during bull markets with high trading volumes, platform-specific risks like regulatory action, security breaches, or competitive displacement amplify downside exposure. Portfolio theory suggests balancing such concentrated bets with broader sector exposure.

The price prediction scenarios below show how WBT might perform across different crypto market cap environments. Rather than betting entirely on WhiteBIT Coin's exchange succeeding, diversified strategies blend exchange tokens with L1s, DeFi protocols, and infrastructure plays to capture crypto market growth while mitigating single-platform risk.

The Case for Diversified Index Exposure

Portfolio theory teaches that diversification is the only free lunch in investing. WBT concentration violates this principle by tying your crypto returns to one protocol's fate. Token Metrics Indices blend WhiteBIT Coin with the top one hundred tokens, providing broad exposure to crypto's growth while smoothing volatility through cross-asset diversification. This approach captures market-wide tailwinds without overweighting any single point of failure.

Systematic rebalancing within index strategies creates an additional return source that concentrated positions lack. As some tokens outperform and others lag, regular rebalancing mechanically sells winners and buys laggards, exploiting mean reversion and volatility. Single-token holders miss this rebalancing alpha and often watch concentrated gains evaporate during corrections while index strategies preserve more gains through automated profit-taking.

Beyond returns, diversified indices improve the investor experience by reducing emotional decision-making. Concentrated WBT positions subject you to severe drawdowns that trigger panic selling at bottoms. Indices smooth the ride through natural diversification, making it easier to maintain exposure through full market cycles.

Get Early Acces


Disclosure

Educational purposes only, not financial advice. Crypto is volatile, do your own research and manage risk.

How to read this price prediction:

Each band blends cycle analogues and market-cap share math with TA guardrails. Base assumes steady adoption and neutral or positive macro. Moon layers in a liquidity boom. Bear assumes muted flows and tighter liquidity.

TM Agent baseline:

Token Metrics long term price prediction view for WhiteBIT Coin, cashtag $WBT. Lead metric first, Token Metrics TM Grade is 52.5%, Hold, and the trading signal is bearish, indicating short-term downward momentum. Concise 12-month numeric price prediction view: Token Metrics scenarios center roughly between $10 and $85, with a base case price target near $40.

Live details: Token Details

Key Takeaways for WBT Price Prediction

  • Scenario driven: price prediction outcomes hinge on total crypto market cap; higher liquidity and adoption lift the price bands
  • Single-asset concentration amplifies both upside and downside versus diversified approaches
  • Fundamentals: Fundamental Grade 52.35% (Community 82%, Tokenomics 60%, Exchange 50%, VC —, DeFi Scanner N/A)
  • TM Agent gist: Bearish momentum, 12-month price prediction range $10 to $85
  • Education only, not financial advice

WhiteBIT Coin Price Prediction: Scenario Analysis

Token Metrics price prediction scenarios span four market cap tiers, each representing different levels of crypto market maturity and liquidity:

8T Market Cap Price Prediction:

At an 8 trillion dollar total crypto market cap, WBT price prediction projects to $54.50 in bear conditions, $64.88 in the base case, and $75.26 in bullish scenarios.

16T Market Cap Price Prediction:

Doubling the market to 16 trillion expands the price prediction range to $78.61 (bear), $109.75 (base), and $140.89 (moon).

23T Market Cap Price Prediction:

At 23 trillion, the price forecast scenarios show $102.71, $154.61, and $206.51 respectively.

31T Market Cap Price Prediction:

In the maximum liquidity scenario of 31 trillion, WBT price prediction could reach $126.81 (bear), $199.47 (base), or $272.13 (moon).


These price prediction ranges illustrate potential outcomes for concentrated WBT positions, but investors should weigh whether single-asset exposure matches their risk tolerance or whether diversified strategies better suit their objectives.

What Is WhiteBIT Coin?

WhiteBIT Coin is the native exchange token associated with the WhiteBIT ecosystem. It is designed to support utility on the platform and related services.

WBT typically provides fee discounts and ecosystem benefits where supported. Usage depends on exchange activity and partner integrations.

Token Metrics AI Analysis for Price Prediction

Token Metrics AI provides comprehensive context on WhiteBIT Coin's positioning and challenges that inform our price prediction models.

Vision: The stated vision for WhiteBIT Coin centers on enhancing user experience within the WhiteBIT exchange ecosystem by providing tangible benefits such as reduced trading fees, access to exclusive features, and participation in platform governance or rewards programs. It aims to strengthen user loyalty and engagement by aligning token holders' interests with the exchange's long-term success. While not positioned as a decentralized protocol token, its vision reflects a broader trend of exchanges leveraging tokens to build sustainable, incentivized communities.

Problem: Centralized exchanges often face challenges in retaining active users and differentiating themselves in a competitive market. Users may be deterred by high trading fees, limited reward mechanisms, or lack of influence over platform developments. WhiteBIT Coin aims to address these frictions by introducing a native incentive layer that rewards participation, encourages platform loyalty, and offers cost-saving benefits. This model seeks to improve user engagement and create a more dynamic trading environment on the WhiteBIT platform.

Solution: WhiteBIT Coin serves as a utility token within the WhiteBIT exchange, offering users reduced trading fees, staking opportunities, and access to special events such as token sales or airdrops. It functions as an economic lever to incentivize platform activity and user retention. While specific governance features are not widely documented, such tokens often enable voting on platform upgrades or listing decisions. The solution relies on integrating the token deeply into the exchange's operational model to ensure consistent demand and utility for holders.

Market Analysis: Exchange tokens like WhiteBIT Coin operate in a competitive landscape led by established players such as Binance Coin (BNB) and KuCoin Token (KCS). While BNB benefits from a vast ecosystem including a launchpad, decentralized exchange, and payment network, WBT focuses on utility within its native exchange. Adoption drivers include the exchange's trading volume, security track record, and the attractiveness of fee discounts and staking yields. Key risks involve regulatory pressure on centralized exchanges and competition from other exchange tokens that offer similar benefits.

Fundamental Snapshot from Token Metrics

Fundamental Grade: 52.35% (Community 82%, Tokenomics 60%, Exchange 50%, VC —, DeFi Scanner N/A).


Catalysts That Skew Bullish for Price Prediction

  • Institutional and retail access expands with ETFs, listings, and integrations
  • Macro tailwinds from lower real rates and improving liquidity
  • Product or roadmap milestones such as upgrades, scaling, or partnerships
  • These factors could push WBT toward higher price prediction targets

Risks That Skew Bearish for Price Prediction

  • Macro risk-off from tightening or liquidity shocks
  • Regulatory actions or infrastructure outages
  • Concentration in validator economics and competitive displacement
  • Protocol-specific execution risk and competitive pressure from alternatives
  • These factors could push WBT toward lower price prediction scenarios

FAQs: WhiteBIT Coin Price Prediction

Can WBT reach $100 according to price predictions?

Based on the price prediction scenarios, WBT could reach $100 in the 16T base case. The 16T tier projects $109.75 in the base case price forecast. Achieving this price prediction requires both broad market cap expansion and WhiteBIT Coin maintaining competitive position. Not financial advice.

What's the risk/reward profile for WBT price prediction?

Risk and reward in our price prediction model span from $54.50 in the lowest bear case to $272.13 in the highest moon case. Downside risks include regulatory actions and competitive displacement, while upside drivers include expanding access and favorable macro liquidity. Concentrated positions amplify both tails, while diversified strategies smooth outcomes.

What gives WBT value and impacts price predictions?

WBT accrues value through fee discounts, staking rewards, access to special events, and potential participation in platform programs. Demand drivers include exchange activity, user growth, and security reputation. While these fundamentals matter for price predictions, diversified portfolios capture value accrual across multiple tokens rather than betting on one protocol's success.

What is the 2028 WhiteBIT Coin price prediction?

Based on Token Metrics analysis, the 2028 price prediction for WhiteBIT Coin centers around $40 in the base case under current market conditions, with a range between $10 and $85 depending on market scenarios. Bullish price predictions range from $64.88 to $272.13 across different total crypto market cap environments.

Can WBT reach $200 by 2028?

According to our price prediction models, WBT could reach $200 in the 23T moon case ($206.51) and in the 31T scenarios where the base case is $199.47 and the moon case is $272.13. These price prediction outcomes require significant crypto market expansion and WhiteBIT maintaining strong competitive positioning. Not financial advice.


Next Steps

Disclosure

Educational purposes only, not financial advice. Crypto is volatile, concentration amplifies risk, and diversification is a fundamental principle of prudent portfolio construction. Do your own research and manage risk appropriately.

Choose from Platinum, Gold, and Silver packages
Reach with 25–30% open rates and 0.5–1% CTR
Craft your own custom ad—from banners to tailored copy
Perfect for Crypto Exchanges, SaaS Tools, DeFi, and AI Products