Back to blog
Research

AI Crypto Coins: Unlocking the Future of Blockchain and Artificial Intelligence in 2025

Discover how AI crypto coins are transforming blockchain in 2025. Learn what they are, top projects to watch, and how to invest using data-driven strategies.
Token Metrics Team
6 min
Want Smarter Crypto Picks—Free?
See unbiased Token Metrics Ratings for BTC, ETH, and top alts.
Thank you! Your submission has been received!
Oops! Something went wrong while submitting the form.
 No credit card | 1-click unsubscribe

Introduction to AI Crypto Coins

Artificial intelligence (AI) has become one of the most transformative technologies of our time, reshaping industries from healthcare to finance. In the cryptocurrency space, AI crypto coins are merging blockchain with artificial intelligence, creating powerful ecosystems for data analytics, automated decision-making, decentralized AI marketplaces, and predictive trading.

In 2025, AI-powered tokens are one of the most promising sectors in crypto, attracting retail investors, institutional players, and developers seeking the next wave of technological breakthroughs. This article explores what AI crypto coins are, how they work, their benefits, key risks, and the role of Token Metrics in analyzing and investing in them.

What Are AI Crypto Coins?

AI crypto coins are digital tokens that fuel blockchain platforms integrated with artificial intelligence technologies. These coins serve multiple purposes, including:

  • Powering AI-Driven Platforms: Providing access to AI tools and algorithms.
  • Facilitating Machine Learning: Enabling decentralized model training and data processing.
  • Enabling Predictive Analytics: Supporting platforms that use AI to forecast market trends.
  • Fueling Autonomous Agents: Powering AI agents for decentralized applications (dApps).

By combining the transparency of blockchain with the intelligence of AI, these projects are creating self-sustaining ecosystems where users can buy, sell, and deploy AI services securely.

Top AI Crypto Coins in 2025

The AI crypto sector is diverse, with projects addressing various use cases. Here are some of the leading tokens:

1. Token Metrics AI (TMAI):

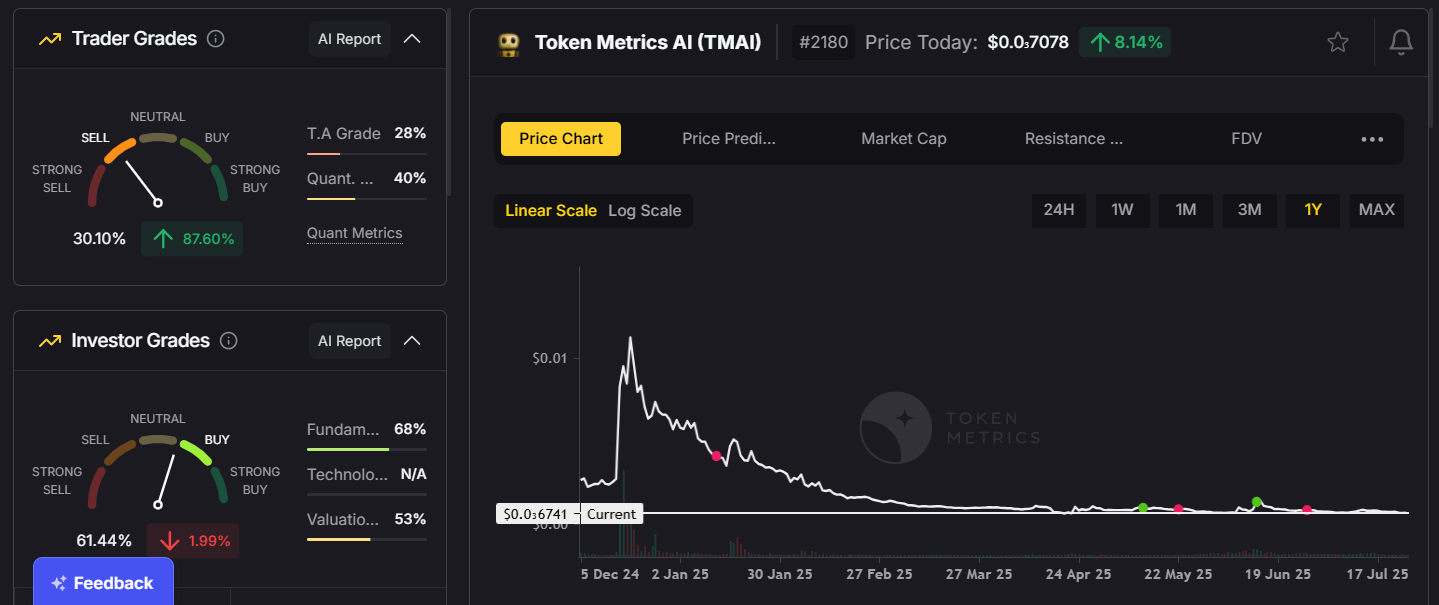
One of the most innovative AI-driven analytics platforms in crypto. TMAI leverages over 80 data points per token, offering AI-generated ratings, trend analysis, and portfolio insights to help traders and investors make data-driven decisions.

2. $KAITO Token Utility:

  1. Platform access and insights
  2. Governance voting
  3. Community curation rewards

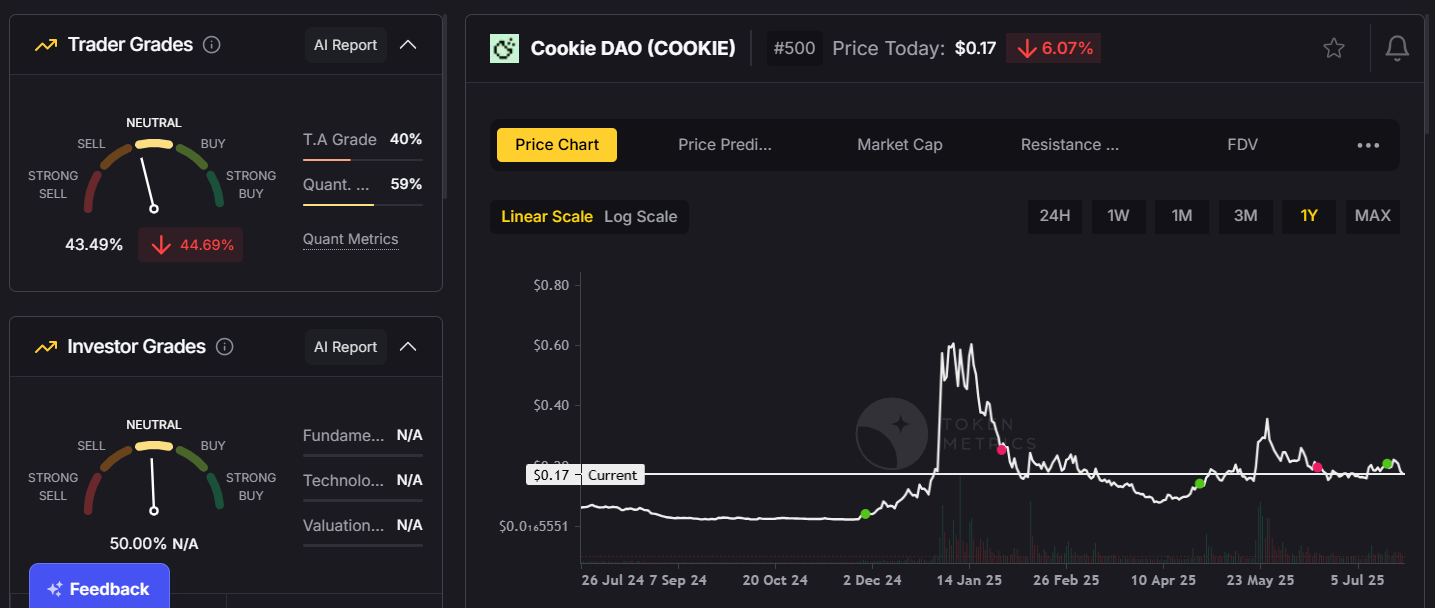
3. Cookie.fun ($COOKIE): Gamified Trading Meets A

Cookie.fun is a Gen-Z-targeted platform that fuses AI-powered trading insights with gamified investing experiences.

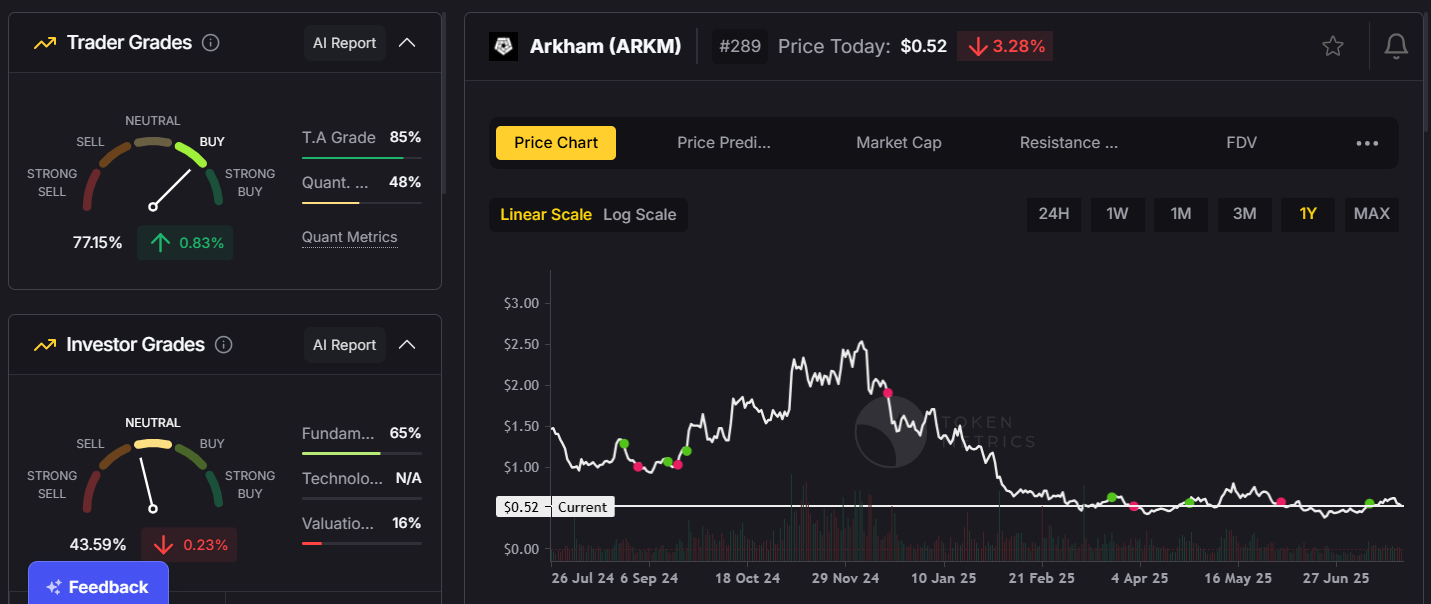
4. Arkham Intelligence (ARKM):
An AI-powered blockchain intelligence platform that analyzes on-chain data for compliance, forensics, and research.

These tokens are part of a fast-growing ecosystem of AI-focused projects poised to disrupt industries ranging from financial trading to decentralized computing.

How Do AI Crypto Coins Work?

AI crypto coins work by integrating machine learning and blockchain to create scalable, secure, and transparent AI ecosystems. Key mechanisms include:

  • Decentralized Data Sharing: AI models can be trained on distributed datasets without compromising user privacy.
  • Smart Contracts: Automated contracts execute AI-powered services securely and transparently.
  • Token Incentives: Users earn rewards for contributing data, computing power, or participating in AI ecosystems.
  • AI-Enhanced Trading: AI-driven trading algorithms generate signals and strategies, which platforms like Token Metrics deliver directly to investors.

This synergy between AI and blockchain creates systems that learn, adapt, and evolve over time, making them highly valuable in the crypto economy.

Benefits of Investing in AI Crypto Coins

1. Exposure to Two Revolutionary Technologies:
Investing in AI tokens means gaining exposure to both the blockchain and AI sectors, which are projected to experience massive growth over the next decade.

2. High Growth Potential:
AI crypto coins often see rapid adoption due to their real-world applications and strong narratives.

3. Diversification:
AI tokens provide a unique asset class within the crypto market, helping diversify a portfolio beyond standard altcoins.

4. Early Access to Innovation:
Investors can be part of groundbreaking projects building the infrastructure for decentralized AI networks.

Risks of AI Crypto Investments

Like all crypto assets, AI coins carry risks:

  • High Volatility: Price swings can be dramatic, especially for small-cap AI projects.
  • Regulatory Uncertainty: Governments are still figuring out how to regulate AI and blockchain integrations.
  • Unproven Technology: Many AI platforms are in early development stages, with uncertain timelines for adoption.
  • Security Concerns: The combination of AI and blockchain increases the attack surface for malicious actors.

Using data-driven platforms like Token Metrics can help mitigate these risks by offering detailed project analysis and ratings.

Investment Strategies for AI Crypto Coins

1. Long-Term Holding (HODL):
Invest in leading AI tokens like TMAI, FET, and AGIX for long-term exposure to this emerging sector.

2. Narrative Investing:
Capitalize on market narratives by entering early when AI projects gain traction or announce major updates.

3. Portfolio Diversification:
Balance AI tokens with large-cap cryptocurrencies like Bitcoin and Ethereum to manage overall portfolio risk.

4. Active Monitoring with Token Metrics:
Use Token Metrics to receive real-time AI-generated ratings, alerts, and trend analyses for AI tokens, helping you optimize entry and exit points.

How Token Metrics Enhances AI Coin Investing

Token Metrics is uniquely positioned at the intersection of AI and crypto. It provides:

  • AI-Generated Coin Ratings: Evaluating tokens across fundamentals, technicals, and market sentiment.
  • Predictive Analytics: Forecasting token movements using advanced AI models.
  • Portfolio Management Tools: Helping investors track and optimize their AI coin allocations.
  • Narrative Detection: Identifying early trends in the AI crypto space before they go mainstream.

For investors seeking to navigate the fast-changing AI crypto sector, Token Metrics delivers data-driven confidence in decision-making.

Practical Tips for Investing in AI Crypto Coins

  1. Do Your Research:
    Focus on projects with clear use cases, strong teams, and growing ecosystems.

  2. Watch for Partnerships:
    AI tokens that collaborate with major blockchain platforms or enterprises often gain faster adoption.

  3. Start Small:
    Begin with a modest allocation to manage risk, especially with early-stage AI projects.

  4. Use Token Metrics Analytics:
    Leverage AI-driven insights to find undervalued tokens and avoid overhyped projects.

The Future of AI Crypto Coins

AI crypto coins are expected to play a transformative role in 2025 and beyond, powering innovations in:

  • Decentralized AI Marketplaces for global algorithm sharing.
  • Autonomous Agents capable of performing complex tasks without human input.
  • AI-Driven DeFi Strategies that optimize yield farming and liquidity provision.

As AI becomes more integrated with blockchain, these coins will likely lead the next technological and financial revolution.

Conclusion

AI crypto coins represent one of the most exciting frontiers in cryptocurrency. By merging the power of blockchain with the intelligence of AI, these tokens are reshaping how we interact with data, trade, and build decentralized systems.

For investors, platforms like Token Metrics provide the insights needed to navigate this dynamic sector—identifying promising projects, managing risk, and seizing opportunities before the market catches up.

In 2025, adding AI tokens to your portfolio isn’t just an investment—it’s a way to participate in the future of intelligent, decentralized finance.

Build Smarter Crypto Apps &
AI Agents in Minutes, Not Months
Real-time prices, trading signals, and on-chain insights all from one powerful API.
Grab a Free API Key
About Token Metrics
Token Metrics: AI-powered crypto research and ratings platform. We help investors make smarter decisions with unbiased Token Metrics Ratings, on-chain analytics, and editor-curated “Top 10” guides. Our platform distills thousands of data points into clear scores, trends, and alerts you can act on.
30 Employees
analysts, data scientists, and crypto engineers
Daily Briefings
concise market insights and “Top Picks”
Transparent & Compliant
Sponsored ≠ Ratings; research remains independent
Want Smarter Crypto Picks—Free?
See unbiased Token Metrics Ratings for BTC, ETH, and top alts.
Thank you! Your submission has been received!
Oops! Something went wrong while submitting the form.
 No credit card | 1-click unsubscribe
Token Metrics Team
Token Metrics Team

Recent Posts

Research

Moonshots API: Discover Breakout Tokens Before the Crowd

Token Metrics Team
5

The biggest gains in crypto rarely come from the majors. They come from Moonshots—fast-moving tokens with breakout potential. The Moonshots API surfaces these candidates programmatically so you can rank, alert, and act inside your product. In this guide, you’ll call /v2/moonshots, display a high-signal list with TM Grade and Bullish tags, and wire it into bots, dashboards, or screeners in minutes. Start by grabbing your key at Get API Key, then Run Hello-TM and Clone a Template to ship fast.

What You’ll Build in 2 Minutes

Why This Matters

Discovery that converts. Users want more than price tickers, they want a curated, explainable list of high-potential tokens. The Moonshots API encapsulates multiple signals into a short list designed for exploration, alerts, and watchlists you can monetize.

Built for builders. The endpoint returns a consistent schema with grade, signal, and context so you can immediately sort, badge, and trigger workflows. With predictable latency and clear filters, you can scale to dashboards, mobile apps, and headless bots without reinventing the discovery pipeline.

Where to Find The Moonshots API

The cURL request for the Moonshots endpoint is displayed in the top right of the API Reference. Grab it and start tapping into the potential!

How It Works (Under the Hood)

The Moonshots endpoint aggregates a set of evidence—often combining TM Grade, signal state, and momentum/volume context—into a shortlist of breakout candidates. Each row includes a symbol, grade, signal, and timestamp, plus optional reason tags for transparency.

For UX, a common pattern is: headline list → token detail where you render TM Grade (quality), Trading Signals (timing), Support/Resistance (risk placement), Quantmetrics (risk-adjusted performance), and Price Prediction scenarios. This enables users to understand why a token was flagged and how to act with risk controls.

Polling vs webhooks. Dashboards typically poll with short-TTL caching. Alerting flows use scheduled jobs or webhooks to smooth traffic and avoid duplicates. Always make notifications idempotent.

Production Checklist

Use Cases & Patterns

Next Steps

FAQs

1) What does the Moonshots API return?

A list of breakout candidates with fields such as symbol, tm_grade, signal (often Bullish/Bearish), optional reason tags, and updated_at. Use it to drive discover tabs, alerts, and watchlists.

2) How fresh is the list? What about latency/SLOs?

The endpoint targets predictable latency and timely updates for dashboards and alerts. Use short-TTL caching and queued jobs/webhooks to avoid bursty polling.

3) How do I use Moonshots in a trading workflow?

Common stack: Moonshots for discovery, Trading Signals for timing, Support/Resistance for SL/TP, Quantmetrics for sizing, and Price Prediction for scenario context. Always backtest and paper-trade first.

4) I saw results like “+241%” and a “7.5% average return.” Are these guaranteed?

No. Any historical results are illustrative and not guarantees of future performance. Markets are risky; use risk management and testing.

5) Can I filter the Moonshots list?

Yes—pass parameters like min_grade, signal, and limit (as supported) to tailor to your audience and keep pages fast.

6) Do you provide SDKs or examples?

REST works with JavaScript and Python snippets above. Docs include quickstarts, Postman collections, and templates—start with Run Hello-TM.

7) Pricing, limits, and enterprise SLAs?

Begin free and scale up. See API plans for rate limits and enterprise options.

Research

Support and Resistance API: Auto-Calculate Smart Levels for Better Trades

Token Metrics Team
4

Most traders still draw lines by hand in TradingView. The support and resistance API from Token Metrics auto-calculates clean support and resistance levels from one request, so your dashboard, bot, or alerts can react instantly. In minutes, you’ll call /v2/resistance-support, render actionable levels for any token, and wire them into stops, targets, or notifications. Start by grabbing your key on Get API Key, then Run Hello-TM and Clone a Template to ship a production-ready feature fast.

What You’ll Build in 2 Minutes

A minimal script that fetches Support/Resistance via /v2/resistance-support for a symbol (e.g., BTC, SOL).

  • A one-liner curl to smoke-test your key.
  • A UI pattern to display nearest support, nearest resistance, level strength, and last updated time.

Next Endpoints to add

  • /v2/trading-signals (entries/exits)
  • /v2/hourly-trading-signals (intraday updates)
  • /v2/tm-grade (single-score context)
  • /v2/quantmetrics (risk/return framing)

Why This Matters

Precision beats guesswork. Hand-drawn lines are subjective and slow. The support and resistance API standardizes levels across assets and timeframes, enabling deterministic stops and take-profits your users (and bots) can trust.

Production-ready by design. A simple REST shape, predictable latency, and clear semantics let you add levels to token pages, automate SL/TP alerts, and build rule-based execution with minimal glue code.

Where to Find

Need the Support and Resistance data? The cURL request for it is in the top right of the API Reference for quick access.

👉 Keep momentum: Get API KeyRun Hello-TMClone a Template

How It Works (Under the Hood)

The Support/Resistance endpoint analyzes recent price structure to produce discrete levels above and below current price, along with strength indicators you can use for priority and styling. Query /v2/resistance-support?symbol=<ASSET>&timeframe=<HORIZON> to receive arrays of level objects and timestamps.

Polling vs webhooks. For dashboards, short-TTL caching and batched fetches keep pages snappy. For bots and alerts, use queued jobs or webhooks (where applicable) to avoid noisy, bursty polling—especially around market opens and major events.

Production Checklist

  • Rate limits: Respect plan caps; add client-side throttling.
  • Retries/backoff: Exponential backoff with jitter for 429/5xx; log failures.
  • Idempotency: Make alerting and order logic idempotent to prevent duplicates.
  • Caching: Memory/Redis/KV with short TTLs; pre-warm top symbols.
  • Batching: Fetch multiple assets per cycle; parallelize within rate limits.
  • Threshold logic: Add %-of-price buffers (e.g., alert at 0.3–0.5% from level).
  • Error catalog: Map common 4xx/5xx to actionable user guidance; keep request IDs.
  • Observability: Track p95/p99; measure alert precision (touch vs approach).
  • Security: Store API keys in a secrets manager; rotate regularly.

Use Cases & Patterns

  • Bot Builder (Headless): Use nearest support for stop placement and nearest resistance for profit targets. Combine with /v2/trading-signals for entries/exits and size via Quantmetrics (volatility, drawdown).
  • Dashboard Builder (Product): Add a Levels widget to token pages; badge strength (e.g., High/Med/Low) and show last touch time. Color the price region (below support, between levels, above resistance) for instant context.
  • Screener Maker (Lightweight Tools): “Close to level” sort: highlight tokens within X% of a strong level. Toggle alerts for approach vs breakout events.
  • Risk Management: Create policy rules like “no new long if price is within 0.2% of strong resistance.” Export daily level snapshots for audit/compliance.

Next Steps

  • Get API Key — generate a key and start free.
  • Run Hello-TM — verify your first successful call.
  • Clone a Template — deploy a levels panel or alerts bot today.
  • Watch the demo: Compare plans: Scale confidently with API plans.

FAQs

1) What does the Support & Resistance API return?

A JSON payload with arrays of support and resistance levels for a symbol (and optional timeframe), each with a price and strength indicator, plus an update timestamp.

2) How timely are the levels? What are the latency/SLOs?

The endpoint targets predictable latency suitable for dashboards and alerts. Use short-TTL caching for UIs, and queued jobs or webhooks for alerting to smooth traffic.

3) How do I trigger alerts or trades from levels?

Common patterns: alert when price is within X% of a level, touches a level, or breaks beyond with confirmation. Always make downstream actions idempotent and respect rate limits.

4) Can I combine levels with other endpoints?

Yes—pair with /v2/trading-signals for timing, /v2/tm-grade for quality context, and /v2/quantmetrics for risk sizing. This yields a complete decide-plan-execute loop.

5) Which timeframe should I use?

Intraday bots prefer shorter horizons; swing/position dashboards use daily or higher-timeframe levels. Offer a timeframe toggle and cache results per setting.

6) Do you provide SDKs or examples?

Use the REST snippets above (JS/Python). The docs include quickstarts, Postman collections, and templates—start with Run Hello-TM.

7) Pricing, limits, and enterprise SLAs?

Begin free and scale as you grow. See API plans for rate limits and enterprise SLA options.

Disclaimer

This content is for educational purposes only and does not constitute financial advice. Always conduct your own research before making any trading decisions.

Research

Quantmetrics API: Measure Risk & Reward in One Call

Token Metrics Team
5

Most traders see price—quants see probabilities. The Quantmetrics API turns raw performance into risk-adjusted stats like Sharpe, Sortino, volatility, drawdown, and CAGR so you can compare tokens objectively and build smarter bots and dashboards. In minutes, you’ll query /v2/quantmetrics, render a clear performance snapshot, and ship a feature that customers trust. Start by grabbing your key at Get API Key, Run Hello-TM to verify your first call, then Clone a Template to go live fast.

What You’ll Build in 2 Minutes

  • A minimal script that fetches Quantmetrics for a token via /v2/quantmetrics (e.g., BTC, ETH, SOL).
  • A smoke-test curl you can paste into your terminal.
  • A UI pattern that displays Sharpe, Sortino, volatility, max drawdown, CAGR, and lookback window.

Next Endpoints to Add

  • /v2/tm-grade (one-score signal)
  • /v2/trading-signals
  • /v2/hourly-trading-signals (timing)
  • /v2/resistance-support (risk placement)
  • /v2/price-prediction (scenario planning)

Why This Matters

Risk-adjusted truth beats hype. Price alone hides tail risk and whipsaws. Quantmetrics compresses edge, risk, and consistency into metrics that travel across assets and timeframes—so you can rank universes, size positions, and communicate performance like a professional.

Built for dev speed

A clean REST schema, predictable latency, and easy auth mean you can plug Sharpe/Sortino into bots, dashboards, and screeners without maintaining your own analytics pipeline. Pair with caching and batching to serve fast pages at scale.

Where to Find

The Quant Metrics cURL request is located in the top right of the API Reference, allowing you to easily integrate it with your application.

Build Smarter Crypto Apps & AI Agents with Token Metrics

Token Metrics provides real-time prices, trading signals, and on-chain insights all from one powerful API. Grab a Free API Key

How It Works (Under the Hood)

Quantmetrics computes risk-adjusted performance over a chosen lookback (e.g., 30d, 90d, 1y). You’ll receive a JSON snapshot with core statistics:

  • Sharpe ratio: excess return per unit of total volatility.
  • Sortino ratio: penalizes downside volatility more than upside.
  • Volatility: standard deviation of returns over the window.
  • Max drawdown: worst peak-to-trough decline.
  • CAGR / performance snapshot: geometric growth rate and best/worst periods.

Call /v2/quantmetrics?symbol=<ASSET>&window=<LOOKBACK> to fetch the current snapshot. For dashboards spanning many tokens, batch symbols and apply short-TTL caching. If you generate alerts (e.g., “Sharpe crossed 1.5”), run a scheduled job and queue notifications to avoid bursty polling.

Production Checklist

  • Rate limits: Understand your tier caps; add client-side throttling and queues.
  • Retries & backoff: Exponential backoff with jitter; treat 429/5xx as transient.
  • Idempotency: Prevent duplicate downstream actions on retried jobs.
  • Caching: Memory/Redis/KV with short TTLs; pre-warm popular symbols and windows.
  • Batching: Fetch multiple symbols per cycle; parallelize carefully within limits.
  • Error catalog: Map 4xx/5xx to clear remediation; log request IDs for tracing.
  • Observability: Track p95/p99 latency and error rates; alert on drift.
  • Security: Store API keys in secrets managers; rotate regularly.

Use Cases & Patterns

  • Bot Builder (Headless): Gate entries by Sharpe ≥ threshold and drawdown ≤ limit, then trigger with /v2/trading-signals; size by inverse volatility.
  • Dashboard Builder (Product): Add a Quantmetrics panel to token pages; allow switching lookbacks (30d/90d/1y) and export CSV.
  • Screener Maker (Lightweight Tools): Top-N by Sortino with filters for volatility and sector; add alert toggles when thresholds cross.
  • Allocator/PM Tools: Blend CAGR, Sharpe, drawdown into a composite score to rank reallocations; show methodology for trust.
  • Research/Reporting: Weekly digest of tokens with Sharpe ↑, drawdown ↓, and volatility ↓.

Next Steps

  • Get API Key — start free and generate a key in seconds.
  • Run Hello-TM — verify your first successful call.
  • Clone a Template — deploy a screener or dashboard today.
  • Watch the demo: VIDEO_URL_HERE
  • Compare plans: Scale with API plans.

FAQs

1) What does the Quantmetrics API return?

A JSON snapshot of risk-adjusted metrics (e.g., Sharpe, Sortino, volatility, max drawdown, CAGR) for a symbol and lookback window—ideal for ranking, sizing, and dashboards.

2) How fresh are the stats? What about latency/SLOs?

Responses are engineered for predictable latency. For heavy UI usage, add short-TTL caching and batch requests; for alerts, use scheduled jobs or webhooks where available.

3) Can I use Quantmetrics to size positions in a live bot?

Yes—many quants size inversely to volatility or require Sharpe ≥ X to trade. Always backtest and paper-trade before going live; past results are illustrative, not guarantees.

4) Which lookback window should I choose?

Short windows (30–90d) adapt faster but are noisier; longer windows (6–12m) are steadier but slower to react. Offer users a toggle and cache each window.

5) Do you provide SDKs or examples?

REST is straightforward (JS/Python above). Docs include quickstarts, Postman collections, and templates—start with Run Hello-TM.

6) Polling vs webhooks for quant alerts?

Dashboards usually use cached polling. For threshold alerts (e.g., Sharpe crosses 1.0), run scheduled jobs and queue notifications to keep usage smooth and idempotent.

7) Pricing, limits, and enterprise SLAs?

Begin free and scale up. See API plans for rate limits and enterprise SLA options.

Disclaimer

All information provided in this blog is for educational purposes only. It is not intended as financial advice. Users should perform their own research and consult with licensed professionals before making any investment or trading decisions.

Choose from Platinum, Gold, and Silver packages
Reach with 25–30% open rates and 0.5–1% CTR
Craft your own custom ad—from banners to tailored copy
Perfect for Crypto Exchanges, SaaS Tools, DeFi, and AI Products