Back to blog
Crypto Basics

AI Crypto Trading in 2025: How Token Metrics Is Changing the Game

Discover top tools for AI crypto trading that can enhance your strategy and boost your results. Read the article to level up your trading today!
Token Metrics Team
8 min
Want Smarter Crypto Picks—Free?
See unbiased Token Metrics Ratings for BTC, ETH, and top alts.
Thank you! Your submission has been received!
Oops! Something went wrong while submitting the form.
 No credit card | 1-click unsubscribe

The cryptocurrency market in 2025 is faster, smarter, and more competitive than ever before. Traditional technical analysis, while still relevant, is no longer sufficient to keep pace with a market that operates 24/7 and is heavily influenced by social sentiment, institutional flows, and emerging narratives. In this dynamic environment, AI crypto trading has emerged as a revolutionary approach that leverages artificial intelligence, machine learning, and big data analytics to help traders make better, faster, and more profitable decisions. AI technologies also enable traders to identify the latest trends in the cryptocurrency market, giving them a competitive edge.

Understanding AI is crucial for anyone looking to succeed in crypto trading, as technologies like machine learning and natural language processing are now applied for market analysis, sentiment assessment, and automated trading strategies.

At the forefront of this transformation is Token Metrics, an AI-powered crypto research and trading platform that simplifies complex trading decisions through real-time insights, predictive analytics, and automated portfolio management. The integration of blockchain technology with AI further enhances security and transparency in crypto trading processes. For anyone serious about crypto trading or investing, understanding how AI is reshaping the cryptocurrency market—and why Token Metrics is leading the way—is essential.

What Is AI Crypto Trading?

AI crypto trading refers to the use of artificial intelligence and machine learning models to analyze vast amounts of market data at lightning speed. This includes price action, on-chain activity, sentiment analysis derived from social media and other sources, and other market indicators. An ai crypto trading bot is an advanced, automated software tool that leverages AI to execute cryptocurrency trades autonomously. By identifying patterns that human traders often miss, AI-powered systems can predict price movements with greater accuracy and generate price predictions. These AI models are applied across various crypto markets to enhance trading strategies.

Beyond analysis, AI crypto trading automates trade execution based on pre-defined strategies, managing portfolios with dynamic rebalancing that adapts to current market conditions. Unlike manual trading, which is subject to emotional bias and slower reaction times, AI trading systems continuously learn, adapt, and improve their performance. This combination of advanced algorithms and automation empowers traders to navigate the volatile cryptocurrency market more efficiently and effectively.

Why AI Is a Game-Changer for Crypto Traders

The cryptocurrency market differs fundamentally from traditional financial markets in several key ways. It operates 24/7 without any opening or closing bell, is highly volatile, and is heavily influenced by social sentiment on platforms like X (formerly Twitter), Discord, and Telegram. These factors create both opportunities and challenges for traders.

AI addresses these challenges by monitoring hundreds of tokens simultaneously across multiple exchanges, utilizing real-time data to enable traders to stay on top of market changes as they happen. By eliminating emotional bias, AI focuses purely on data-driven decisions, responding instantly to price fluctuations, breaking news, and social media trends. This ability to quickly analyze and act on vast amounts of information gives traders a significant competitive edge, where seconds can mean the difference between substantial profits and missed opportunities. Additionally, AI helps traders select the right strategies for different market conditions, improving forecasting, analysis, and customization to match individual trading styles.

Understanding Crypto Trading Bots

Crypto trading bots are intelligent software programs that leverage artificial intelligence and machine learning to automate cryptocurrency trading. These bots are designed to analyze market trends, monitor price movements, and execute trades on behalf of traders, all without the need for constant human intervention. By using a crypto trading bot, traders can take advantage of opportunities in the crypto market 24/7, reduce emotional bias, and minimize risks that often come with manual trading.

There are several types of trading bots available, each catering to different trading strategies and risk profiles. Grid bots, for example, are popular for their ability to profit from price fluctuations by placing buy and sell orders at preset intervals. DCA bots (Dollar Cost Averaging bots) help traders spread out their investments over time, reducing the impact of market volatility. Market making bots provide liquidity by continuously quoting buy and sell prices, allowing experienced traders to benefit from small price differences.

Whether you’re new to crypto trading or an experienced trader, understanding how trading bots work and how to deploy them effectively can be a game-changer. By automating trades and managing risk, these AI-powered bots help traders maximize profits and achieve greater success in the fast-paced world of cryptocurrency trading.

AI Trading Strategies

AI trading strategies are revolutionizing the way traders approach cryptocurrency trading by combining advanced algorithms, machine learning, and natural language processing. These strategies are designed to analyze a wide range of market indicators, including price trends, sentiment analysis, and other market signals, to help traders make informed decisions and execute trades automatically.

Some of the most popular AI trading strategies include trend following, which identifies and rides market momentum; mean reversion, which capitalizes on price corrections; and statistical arbitrage, which exploits price inefficiencies across different markets. By leveraging AI tools, traders can backtest their strategies using historical data, evaluate past performance, and fine-tune their approach to adapt to changing market conditions.

AI trading strategies not only help reduce risks by removing emotional decision-making but also enable traders to respond quickly to market changes. Whether you’re a beginner looking to automate your trades or an advanced trader seeking to optimize your strategies, AI-powered trading offers the tools and insights needed to increase profits and stay ahead in the competitive crypto market.

Why Token Metrics Is the #1 AI Trading Platform in 2025

While many trading platforms exist, Token Metrics distinguishes itself by integrating AI research, portfolio management, and real-time trading signals into a single, cohesive ecosystem. Additionally, Token Metrics allows users to link and manage multiple exchange accounts through a unified platform, streamlining trading and account oversight. This comprehensive approach makes it a true game-changer for crypto traders and investors alike.

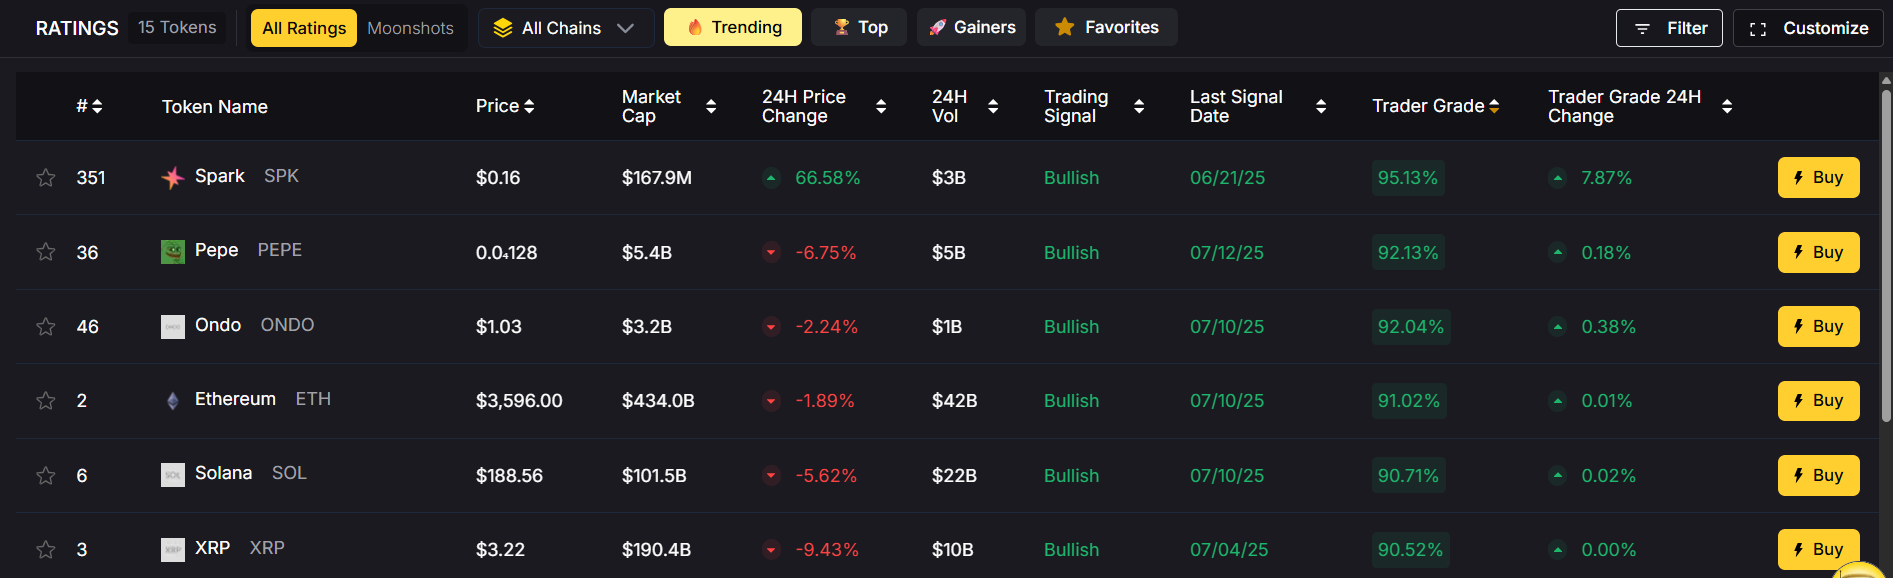
1. AI-Powered Trading Signals

Token Metrics provides real-time bullish and bearish signals for hundreds of cryptocurrencies. These signals are not arbitrary; they derive from over 80 data points, including technical indicators, tokenomics, and on-chain analytics, ensuring that traders receive well-informed guidance.

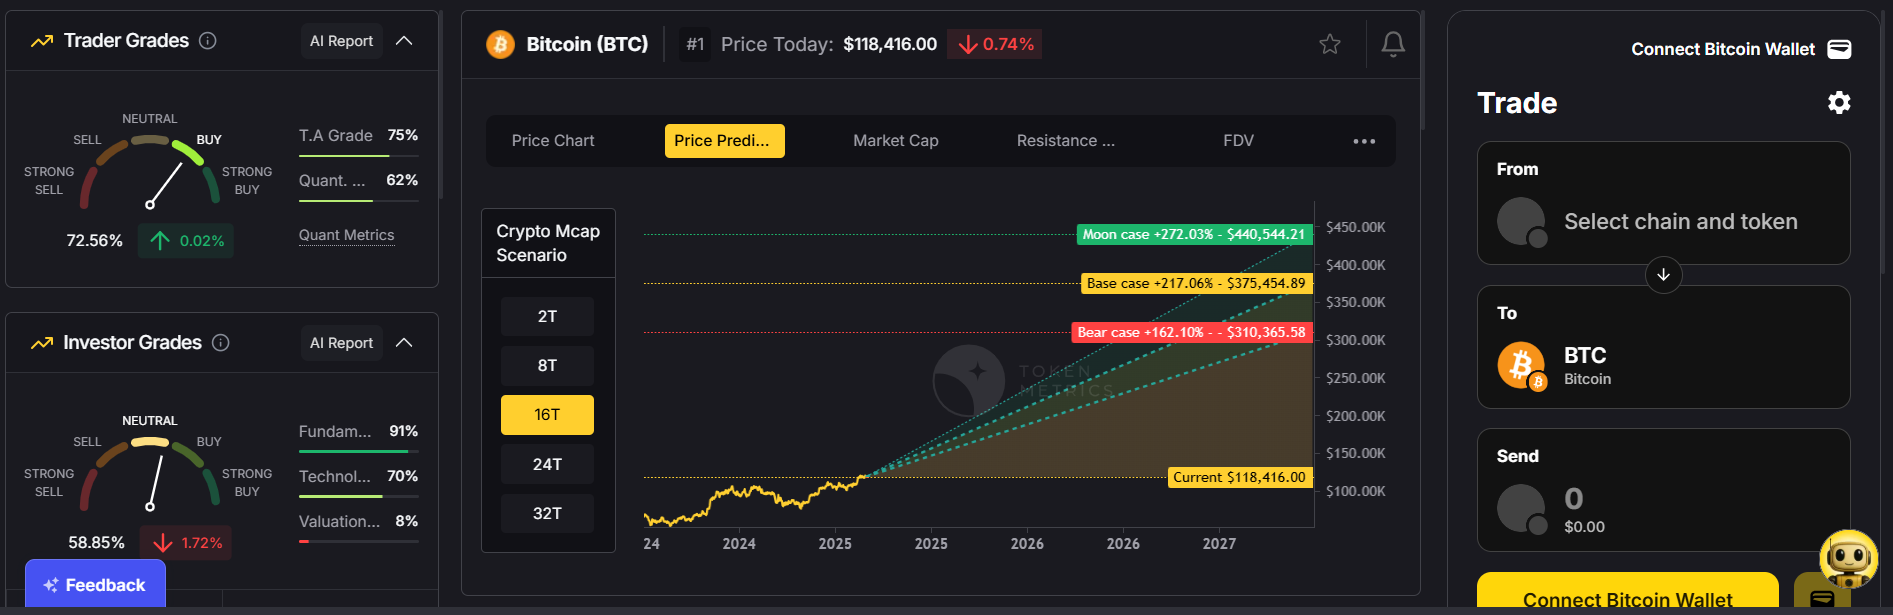
2. Trader & Investor Grades

Each token is assigned two AI-generated scores: the Trader Grade, which assesses short-term performance potential, and the Investor Grade, which evaluates long-term viability. This dual grading system helps traders quickly differentiate between tokens suitable for quick trades and those better suited for long-term holdings.

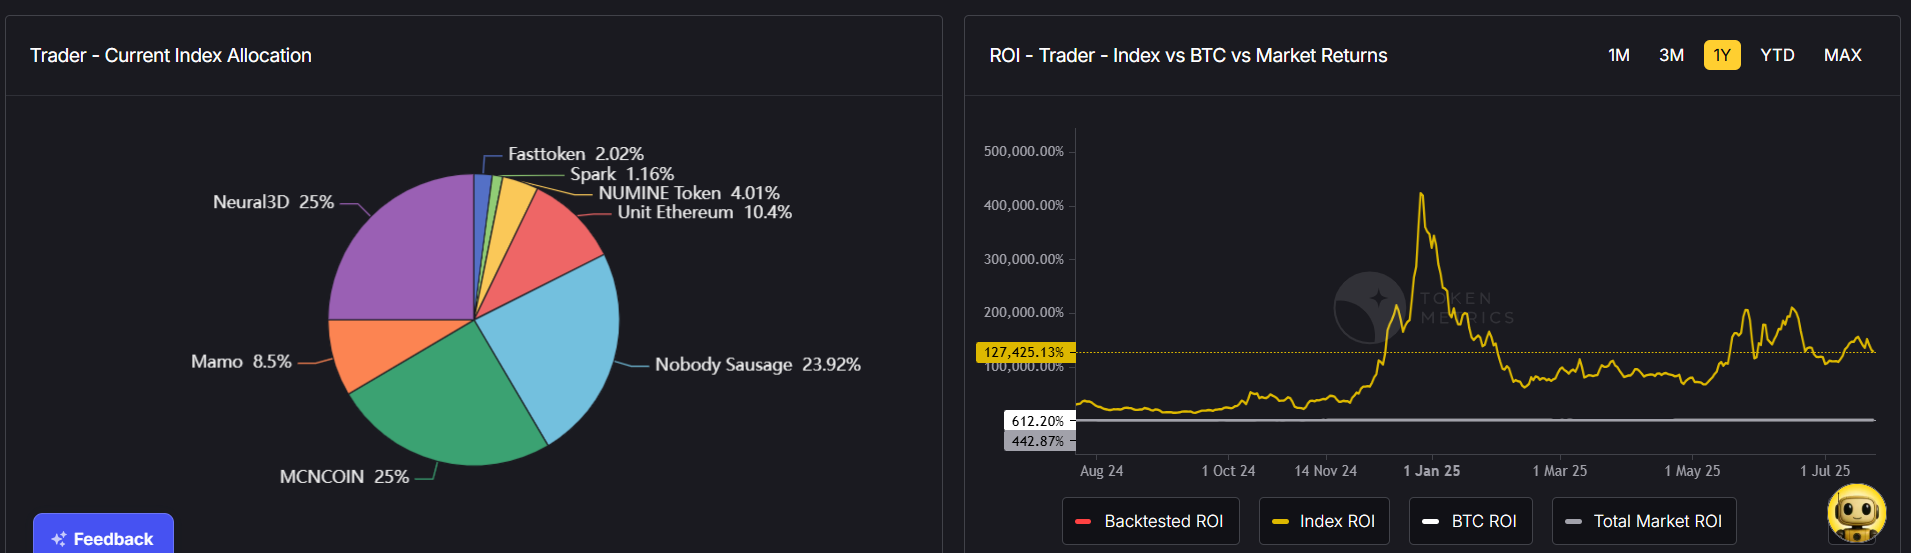
3. AI-Managed Crypto Indices

For hands-off investors, Token Metrics offers auto-managed portfolios, or indices, that dynamically rebalance based on AI insights. Whether you prefer blue-chip crypto baskets or low-cap moonshot portfolios, these indices provide effortless diversification aligned with current market conditions.
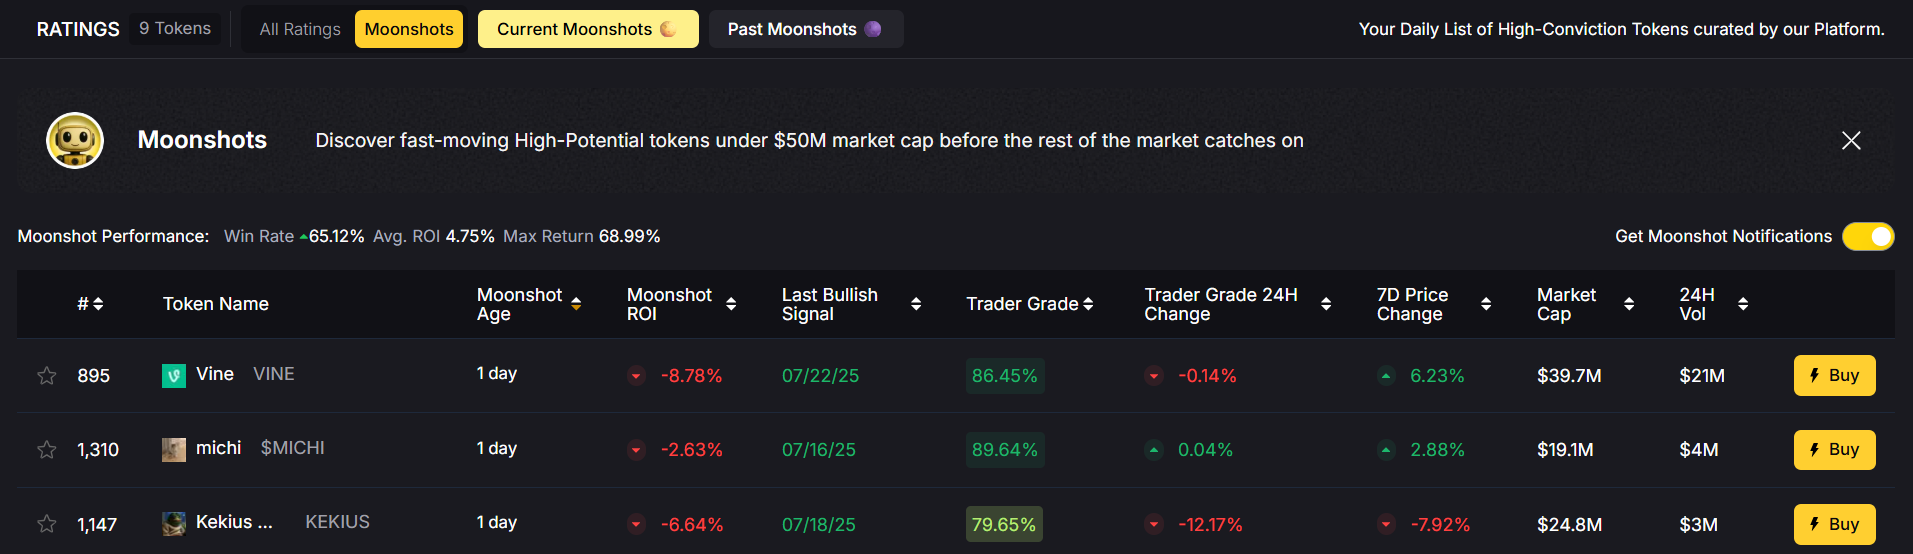
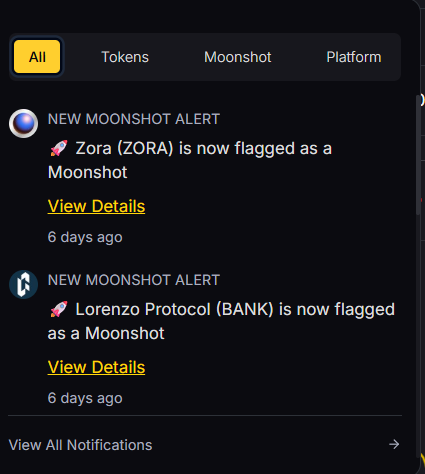
4. Moonshot Finder

The Moonshot feature uses AI to identify low-cap tokens with explosive growth potential before they become mainstream. This tool is invaluable for traders seeking the next 100x altcoin.

5. Customizable Alerts

Traders can set alerts for price targets, investor grades, or trading signals and receive notifications via email, Telegram, SMS, or Slack. This ensures you never miss critical market movements.

6. Research Automation

Token Metrics automates the research process by combining on-chain data, fundamental analysis, and sentiment tracking into easy-to-understand reports. This saves traders hours of manual work while providing expert insights.

Advanced Trading Options with Token Metrics

Token Metrics empowers traders with a suite of advanced trading options designed to give you a competitive edge in the crypto market. The platform harnesses predictive analytics, sentiment analysis, and natural language processing to help you analyze market trends and predict future price movements with greater accuracy.

With Token Metrics, you can create and test custom strategies tailored to your trading style, backtest their performance using historical data, and execute trades automatically based on real-time insights. The platform’s advanced tools allow you to monitor market conditions, adjust your strategies as needed, and make informed decisions that maximize your trading profits.

Whether you’re trading Bitcoin, Ethereum, or exploring new altcoins, Token Metrics provides the resources and analytics you need to optimize your trading activities. By leveraging these powerful features, traders can stay ahead of market trends, anticipate price fluctuations, and achieve greater success in the ever-evolving world of cryptocurrency trading.

Managing Risks and Challenges in AI Crypto Trading

Successfully navigating AI crypto trading requires a strong focus on risk management and an awareness of the unique challenges that come with automated trading. Market volatility is a constant in the crypto market, and sudden price swings can lead to significant losses if not properly managed. To mitigate these risks, traders can utilize risk management tools such as stop-loss orders and position sizing, which help limit exposure to adverse market movements.

Another challenge is ensuring that trading bots remain effective as market conditions change. AI trading bots, while powerful, can sometimes make errors or fail to adapt to new trends. Regular backtesting, walk-forward optimization, and continuous monitoring of bot performance are essential practices to ensure your strategies remain robust.

Traders should also be vigilant about hidden fees, security risks, and potential regulatory changes that could impact their trading activities. By staying informed and using the right tools, traders can reduce risks, protect their assets, and increase their chances of long-term success in AI crypto trading.

AI Crypto Trading vs. Traditional Trading

Comparing AI-driven trading with traditional manual trading highlights the advantages of integrating artificial intelligence into cryptocurrency trading:

‍

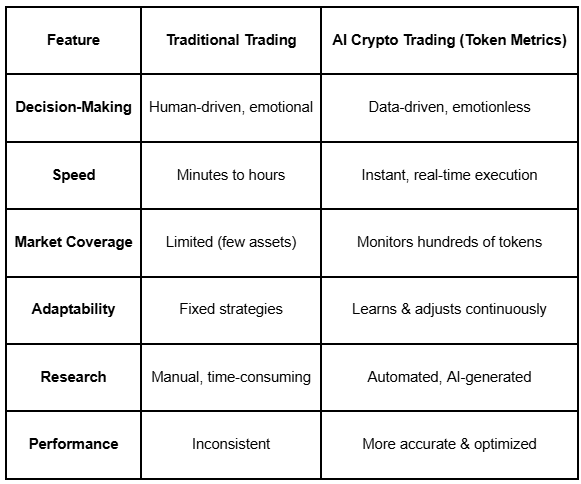
The key takeaway is clear: AI crypto trading is not just faster—it is smarter, providing traders with the tools to make informed decisions that optimize profits while reducing risks. AI-driven platforms make it easier and more efficient to trade crypto compared to traditional methods, streamlining the entire process for both beginners and experienced traders.

How Token Metrics AI Works Behind the Scenes

Token Metrics employs sophisticated machine learning models trained on diverse data sets to deliver its predictive analytics. These include historical price data to detect recurring patterns, on-chain analytics such as wallet activity and token supply, and social sentiment gathered from platforms like X, Telegram, and Reddit. Additionally, fundamental data such as team strength, project roadmaps, and tokenomics are factored into the analysis.

This multi-layered approach enables Token Metrics to accurately predict both short-term and long-term market movements, helping traders anticipate market changes and fine-tune their strategies accordingly. To ensure the reliability and safety of its platform, Token Metrics implements robust security measures, including proactive practices and strong encryption, to protect user data and funds against evolving threats and market volatility.

Affiliate and Revenue Opportunities with Token Metrics

Token Metrics not only offers powerful tools for trading but also provides a variety of affiliate and revenue opportunities for traders and investors. Through the platform’s affiliate program, users can earn commissions by referring friends, family, or their network to Token Metrics, creating a steady stream of passive income.

For those looking to expand their trading business, Token Metrics allows traders to create and sell their own trading bots and strategies directly on the platform. This opens up new revenue streams and enables experienced traders to share their expertise with the broader crypto community.

Additionally, Token Metrics supports its users with a wealth of educational resources, including webinars, tutorials, and personalized support, helping traders at all levels achieve greater success. By leveraging these opportunities, you can build your own trading business, generate additional income, and unlock your full potential in the crypto market. Whether you’re just starting out or are an advanced trader, Token Metrics is your gateway to financial success in the world of cryptocurrency trading.

How to Get Started with Token Metrics in 2025

Getting started with Token Metrics is straightforward:

  1. Sign up at Token Metrics. No credit card required to start your trial or explore the platform.
  2. Choose your subscription plan—Basic, Advanced, or Premium—based on your trading needs.
  3. Create your watchlist by selecting preferred tokens to monitor.
  4. Use AI-generated signals and grades to guide your trading decisions.
  5. Leverage AI-managed indices for automatic portfolio diversification and risk management.
  6. Set up customizable alerts to stay informed about price targets and market indicators in real time.

For beginners, starting with AI-managed indices is a smart way to gain exposure to multiple sectors with minimal risk, while advanced traders can benefit from custom strategies and automated trading bots.

FAQs: AI Crypto Trading & Token Metrics

1. Is AI crypto trading profitable?
Yes, when used correctly, AI crypto trading can significantly enhance profitability by eliminating emotional bias, processing vast amounts of data, and reacting faster than human traders.

2. Is Token Metrics worth it in 2025?
Absolutely. Token Metrics offers a comprehensive suite of AI-driven signals, indices, and research tools that cater to both beginners and experienced traders.

3. Can I use Token Metrics as a beginner?
Yes, the platform supports beginners through AI-managed portfolios and provides more advanced features for experienced traders.

4. Does Token Metrics offer real-time trading alerts?
Yes. Alerts are available via email, SMS, Telegram, and Slack, ensuring you stay updated on important market movements.

Final Thoughts: The Future of AI in Crypto Trading

Artificial intelligence is no longer a futuristic concept; it is the present reality transforming crypto trading. Token Metrics is leading this revolution by offering a one-stop platform that combines AI-driven research, real-time trading signals, and automated portfolio management.

Whether you are scalping short-term trades or building a long-term crypto portfolio, Token Metrics equips you with the powerful tools and expert insights needed to stay ahead of the rapidly changing cryptocurrency market. If you want to trade smarter and maximize profits in 2025, starting with Token Metrics is the right strategy.

Build Smarter Crypto Apps &
AI Agents in Minutes, Not Months
Real-time prices, trading signals, and on-chain insights all from one powerful API.
Grab a Free API Key
About Token Metrics
Token Metrics: AI-powered crypto research and ratings platform. We help investors make smarter decisions with unbiased Token Metrics Ratings, on-chain analytics, and editor-curated “Top 10” guides. Our platform distills thousands of data points into clear scores, trends, and alerts you can act on.
30 Employees
analysts, data scientists, and crypto engineers
Daily Briefings
concise market insights and “Top Picks”
Transparent & Compliant
Sponsored ≠ Ratings; research remains independent
Want Smarter Crypto Picks—Free?
See unbiased Token Metrics Ratings for BTC, ETH, and top alts.
Thank you! Your submission has been received!
Oops! Something went wrong while submitting the form.
 No credit card | 1-click unsubscribe
Token Metrics Team
Token Metrics Team

Recent Posts

Research

Chainlink Price Prediction 2027: Oracle Infrastructure Analysis

Token Metrics Team
8 min read

Understanding LINK Price Prediction: 2027 Potential

Infrastructure protocols become more valuable as the crypto ecosystem scales and relies on robust middleware. Chainlink provides critical oracle infrastructure where proven utility and deep integrations drive long-term value over retail speculation. Increasing institutional adoption raises demand for professional-grade data delivery and security.

Token Metrics price prediction projections for LINK below span multiple total market cap scenarios from conservative to aggressive. Each tier assumes different levels of infrastructure demand as crypto evolves from speculative markets to institutional-grade systems. These bands frame LINK's price prediction potential outcomes into 2027.

Disclosure

Educational purposes only, not financial advice. Crypto is volatile, do your own research and manage risk.

How to Read This LINK Price Prediction

Each band blends cycle analogues and market-cap share math with TA guardrails. Base assumes steady adoption and neutral or positive macro. Moon layers in a liquidity boom. Bear assumes muted flows and tighter liquidity.

TM Agent baseline: Token Metrics lead metric for Chainlink, cashtag $LINK, is a TM Grade of 23.31%, which translates to a Sell, and the trading signal is bearish, indicating short-term downward momentum. This means Token Metrics currently does not endorse $LINK as a long-term buy at current conditions in our price prediction models, despite strong technology fundamentals.

Live details: Chainlink Token Details

Access: Buy LINK on MEXC

Affiliate Disclosure: We may earn a commission from qualifying purchases made via this link, at no extra cost to you.

Key Takeaways: Chainlink Price Prediction Summary

  • Scenario driven: Price prediction outcomes hinge on total crypto market cap; higher liquidity and adoption lift the bands
  • Fundamentals: Fundamental Grade 74.58% (Community 81%, Tokenomics 100%, Exchange 100%, VC —, DeFi Scanner 17%)
  • Technology: Technology Grade 88.50% (Activity 81%, Repository 72%, Collaboration 100%, Security 86%, DeFi Scanner 17%)
  • TM Agent gist: Bearish signal with limited upside in price prediction models unless fundamentals or market regime change
  • Current rating: Sell (23.31%) with strong tech but weak valuation
  • Education only, not financial advice

Chainlink Price Prediction Scenario Analysis

Token Metrics price prediction scenarios span four market cap tiers, each representing different levels of crypto market maturity and liquidity:

8T Market Cap - LINK Price Prediction:

At an 8 trillion dollar total crypto market cap, LINK price prediction projects to $26.10 in bear conditions, $30.65 in the base case, and $35.20 in bullish scenarios.

 16T Market Cap - LINK Price Prediction:

Doubling the market to 16 trillion expands the price prediction range to $42.64 (bear), $56.29 (base), and $69.95 (moon).

 23T Market Cap - LINK Price Prediction:

At 23 trillion, the price prediction scenarios show $59.18, $81.94, and $104.70 respectively.

 31T Market Cap - LINK Price Prediction:

In the maximum liquidity scenario of 31 trillion, LINK price predictions could reach $75.71 (bear), $107.58 (base), or $139.44 (moon).

‍

  These price prediction ranges reflect potential infrastructure value capture as crypto markets mature, though current valuation concerns contribute to the Sell rating despite strong technology fundamentals.

Why Consider the Indices with Top-100 Exposure

Chainlink represents one opportunity among hundreds in crypto markets. Token Metrics Indices bundle LINK with top one hundred assets for systematic exposure to the strongest projects. Single tokens face idiosyncratic risks that diversified baskets mitigate.

Historical index performance demonstrates the value of systematic diversification versus concentrated positions.

Join the early access list

What Is Chainlink?

Chainlink is a decentralized oracle network that connects smart contracts to real-world data and systems. It enables secure retrieval and verification of off-chain information, supports computation, and integrates across multiple blockchains. As adoption grows, Chainlink serves as critical infrastructure for reliable data feeds and automation.

The LINK token is used to pay node operators and secure the network's services. Common use cases include DeFi price feeds, insurance, and enterprise integrations, with CCIP extending cross-chain messaging and token transfers—all factors that influence long-term LINK price predictions.

Token Metrics AI Analysis

Token Metrics AI provides comprehensive context informing our LINK price prediction models:

Vision: Chainlink aims to create a decentralized, secure, and reliable network for connecting smart contracts with real-world data and systems. Its vision is to become the standard for how blockchains interact with external environments, enabling trust-minimized automation across industries.

Problem: Smart contracts cannot natively access data outside their blockchain, limiting their functionality. Relying on centralized oracles introduces single points of failure and undermines the security and decentralization of blockchain applications. This creates a critical need for a trustless, tamper-proof way to bring real-world information onto blockchains.

Solution: Chainlink solves this by operating a decentralized network of node operators that fetch, aggregate, and deliver data from off-chain sources to smart contracts. It uses cryptographic proofs, reputation systems, and economic incentives to ensure data integrity. The network supports various data types and computation tasks, allowing developers to build complex, data-driven decentralized applications.

Market Analysis: Chainlink is a market leader in the oracle space and a key infrastructure component in the broader blockchain ecosystem, particularly within Ethereum and other smart contract platforms. It faces competition from emerging oracle networks like Band Protocol and API3, but maintains a strong first-mover advantage and widespread integration across DeFi, NFTs, and enterprise blockchain solutions. Adoption is driven by developer activity, partnerships with major blockchain projects, and demand for secure data feeds. Key risks include technological shifts, regulatory scrutiny on data providers, and execution challenges in scaling decentralized oracle networks. As smart contract usage grows, so does the potential for oracle services, positioning Chainlink at the center of a critical niche, though its success depends on maintaining security and decentralization over time—all critical factors in our price prediction analysis.

Fundamental and Technology Snapshot from Token Metrics

Fundamental Grade: 74.58% (Community 81%, Tokenomics 100%, Exchange 100%, VC —, DeFi Scanner 17%).


Technology Grade: 88.50% (Activity 81%, Repository 72%, Collaboration 100%, Security 86%, DeFi Scanner 17%).

  Catalysts That Skew LINK Price Predictions Bullish

  • Institutional and retail access expands with ETFs, listings, and integrations
  • Macro tailwinds from lower real rates and improving liquidity
  • Product or roadmap milestones such as CCIP upgrades, scaling, or partnerships
  • Increased adoption of Chainlink oracle services across DeFi protocols
  • Enterprise blockchain integrations requiring secure data feeds
  • Cross-chain expansion through CCIP (Cross-Chain Interoperability Protocol)

Risks That Skew LINK Price Predictions Bearish

  • Macro risk-off from tightening or liquidity shocks
  • Regulatory actions targeting oracle networks or infrastructure outages
  • Concentration in node operator economics and competitive displacement
  • Current low TM Grade (23.31%) indicating valuation concerns
  • Competition from alternative oracle solutions (Band Protocol, API3)
  • Token economics challenges despite 100% tokenomics score

How Token Metrics Can Help

Token Metrics empowers you to analyze Chainlink and hundreds of digital assets with AI-driven ratings, on-chain and fundamental data, and index solutions to manage portfolio risk smartly in a rapidly evolving crypto market. Our price prediction frameworks provide transparent scenario-based analysis even for tokens with Sell ratings.

Chainlink Price Prediction FAQs

Can LINK reach $100?

Yes. Based on our price prediction scenarios, LINK could reach $100+ in the 23T moon case, projecting $104.70. However, this requires significant market cap expansion and improved market conditions beyond the current Sell rating (23.31%). Not financial advice.

What price could LINK reach in the moon case?

Moon case price predictions range from $35.20 at 8T to $139.44 at 31T total crypto market cap. These scenarios assume maximum liquidity expansion and strong Chainlink adoption, though current bearish signals suggest caution. Not financial advice.

Should I buy LINK now or wait?

Timing depends on risk tolerance and macro outlook. Current price of $18.09 sits below the 8T bear case in our price prediction scenarios, suggesting potential value. However, the Sell rating (23.31%) and bearish trading signal indicate Token Metrics does not currently endorse LINK at these levels. Dollar-cost averaging may reduce timing risk if you believe in long-term infrastructure value. Not financial advice.

What is the Chainlink price prediction for 2025-2027?

Our comprehensive LINK price prediction framework suggests Chainlink could trade between $26.10 and $139.44 depending on market conditions and total crypto market capitalization. The base case price prediction scenario clusters around $30.65 to $107.58 across different market cap environments. Despite strong technology (88.50%) and fundamentals (74.58%), the current Sell rating (23.31%) reflects valuation concerns. Not financial advice.

Can Chainlink reach $50?

Yes. Based on our price prediction scenarios, LINK could reach $56.29 in the 16T base case and higher in 23T/31T scenarios. The $50 target becomes achievable in moderate market cap environments (16T tier), though current bearish momentum suggests this may take time. Not financial advice.

Why does LINK have a Sell rating despite strong technology?

LINK shows excellent technology fundamentals (88.50% grade) with strong development activity, collaboration, and security. However, the overall TM Grade of 23.31% (Sell) reflects current valuation concerns, market positioning, and bearish trading signals. Our price prediction models show potential upside in favorable market conditions, but current metrics suggest waiting for improved entry points. Not financial advice.

Is Chainlink a good investment based on price predictions?

LINK presents a complex investment case: exceptional technology grade (88.50%), solid fundamentals (74.58%), but a Sell rating (23.31%) with bearish momentum. While our price prediction models show significant upside potential in bull market scenarios, current valuation concerns and bearish signals suggest caution. The oracle infrastructure thesis remains compelling long-term, but timing and entry points matter. Consider diversified exposure through indices. Not financial advice.

How does LINK compare to other oracle price predictions?

Chainlink dominates the oracle space with first-mover advantage and widespread integration. Our price prediction framework suggests LINK could reach $30-$139 across scenarios. Competitors like Band Protocol and API3 offer alternatives, but Chainlink's established network effects and enterprise partnerships position it as the infrastructure leader. However, the current Sell rating suggests valuation concerns versus alternatives.

What are the biggest risks to LINK price predictions?

Key risks that could impact Chainlink price predictions include: current Sell rating (23.31%) indicating valuation concerns, competition from emerging oracle networks, regulatory scrutiny on data providers, node operator centralization risks, macro liquidity shocks, and challenges scaling decentralized oracle infrastructure. Despite strong technology (88.50%), these factors contribute to bearish near-term outlook.

Will LINK benefit from DeFi growth?

Chainlink is critical infrastructure for DeFi, providing price feeds for lending protocols, derivatives, and stablecoins. Our price prediction scenarios assume LINK captures value from continued DeFi adoption. However, the current Sell rating suggests this thesis isn't reflected in valuation metrics yet. Long-term infrastructure value may require patience and improved market conditions.


Should I buy LINK now or wait?

Timing depends on risk tolerance and macro outlook. Current price of $18.09 sits below the 8T bear case in the scenarios. Dollar-cost averaging may reduce timing risk. Not financial advice.

Next Steps

Track live grades and signals: Token Details

Join Indices Early Access 

Want exposure? Buy LINK on MEXC 

Disclosure

Educational purposes only, not financial advice. Crypto is volatile, do your own research and manage risk.

Why Token Metrics Ratings Matter

Discover the full potential of your crypto research and portfolio management with Token Metrics. Our ratings combine AI-driven analytics, on-chain data, and decades of investing expertise—giving you the edge to navigate fast-changing markets. Try our platform to access scenario-based price prediction targets, token grades, indices, and more for institutional and individual investors. Token Metrics is your research partner through every crypto market cycle.

Why Use Token Metrics for LINK Price Predictions?

  • Transparent analysis: Honest Sell ratings (23.31%) even when technology fundamentals are strong (88.50%)
  • Scenario-based modeling: Multiple market cap tiers for comprehensive price prediction analysis
  • Infrastructure focus: Specialized oracle network analysis and competitive landscape assessment
  • Risk-adjusted approach: Balanced view of technology strength versus valuation concerns
  • Real-time signals: Trading signals and TM Grades updated regularly
  • Diversification tools: Index solutions to spread oracle infrastructure risk
  • Comparative analysis: Analyze LINK against Band Protocol, API3, and 6,000+ tokens
Research

Hyperliquid Price Prediction 2026: DEX Perpetuals Trading Analysis

Token Metrics Team
7 min read

Why 2026 Looks Bullish for HYPE Price Prediction: Market Context

The crypto market is tilting bullish into 2026 as liquidity, infrastructure, and participation improve across the board. Clearer rules and standards are reshaping the classic four-year cycle, flows can arrive earlier, and strength can persist longer than in prior expansions.

Institutional access is widening through ETFs and custody, while L2 scaling and real-world integrations help sustain on-chain activity. This healthier backdrop frames our price prediction scenario work for HYPE. The ranges below reflect different total crypto market sizes and the share Hyperliquid could capture under each regime, providing investors with comprehensive price prediction analysis for strategic planning.


Disclosure

Educational purposes only, not financial advice. Crypto is volatile, do your own research and manage risk.

How to Read This HYPE Price Prediction

Each band blends cycle analogues and market-cap share math with TA guardrails. Base assumes steady adoption and neutral or positive macro. Moon layers in a liquidity boom. Bear assumes muted flows and tighter liquidity.

TM Agent baseline: Token Metrics TM Grade is 73.9%, a Buy, and the trading signal is bearish, indicating short-term downward momentum. This means Token Metrics judges HYPE as fundamentally attractive over the long term in our price prediction models, while near-term momentum is negative and may limit rallies.

Live details: Hyperliquid Token Details

Buy HYPE

Affiliate Disclosure: We may earn a commission from qualifying purchases made via this link, at no extra cost to you.

Key Takeaways: Hyperliquid Price Prediction Summary

  • Scenario driven: Price prediction outcomes hinge on total crypto market cap; higher liquidity and adoption lift the bands
  • Fundamentals: Fundamental Grade 76.73% (Community 68%, Tokenomics 60%, Exchange 100%, VC —, DeFi Scanner 92%)
  • Technology: Technology Grade N/A (Activity —, Repository —, Collaboration —, Security —, DeFi Scanner 92%)
  • TM Agent gist: Long-term attractive on fundamentals in price prediction models; near-term momentum is negative and may limit rallies
  • Current rating: Buy (73.9%) with bullish 2026 macro backdrop
  • Education only, not financial advice

Hyperliquid Price Prediction Scenario Analysis

Token Metrics price prediction scenarios span four market cap tiers, each representing different levels of crypto market maturity and liquidity:

8T Market Cap - HYPE Price Prediction:

At an 8 trillion dollar total crypto market cap, HYPE price prediction projects to $48.81 in bear conditions, $49.92 in the base case, and $51.03 in bullish scenarios.

16T Market Cap - HYPE Price Prediction:

Doubling the market to 16 trillion expands the price prediction range to $50.72 (bear), $54.05 (base), and $57.38 (moon).

23T Market Cap - HYPE Price Prediction:

At 23 trillion, the price prediction scenarios show $52.62, $58.17, and $63.72 respectively.

31T Market Cap - HYPE Price Prediction:

In the maximum liquidity scenario of 31 trillion, HYPE price predictions could reach $54.52 (bear), $62.29 (base), or $70.07 (moon).

Each tier in our price prediction framework assumes progressively stronger market conditions, with the base case reflecting steady growth and the moon case requiring sustained bull market dynamics driven by the improving 2026 macro environment.

Why Consider the Indices with Top-100 Exposure

Diversification matters. HYPE is compelling, yet concentrated bets can be volatile, especially when evaluating long-term price predictions. Token Metrics Indices hold HYPE alongside the top one hundred tokens for broad exposure to leaders and emerging winners.

Our backtests indicate that owning the full market with diversified indices has historically outperformed both the total market and Bitcoin in many regimes due to diversification and rotation benefits.

Get early access

What Is Hyperliquid?

Hyperliquid is a decentralized exchange focused on perpetual futures with a high-performance order book architecture. The project emphasizes low-latency trading, risk controls, and capital efficiency aimed at professional and retail derivatives traders. Its token, HYPE, is used for ecosystem incentives and governance-related utilities—all factors that directly influence HYPE price prediction trajectories.

Catalysts That Skew HYPE Price Predictions Bullish

  • Institutional and retail access expands with ETFs, listings, and integrations
  • Macro tailwinds from lower real rates and improving liquidity entering 2026
  • Product or roadmap milestones such as upgrades, scaling, or partnerships
  • Growing perpetual futures DEX market share
  • Increased professional trader adoption of decentralized derivatives
  • Integration with major DeFi protocols and liquidity aggregators
  • Favorable regulatory clarity for decentralized exchanges

Risks That Skew HYPE Price Predictions Bearish

  • Macro risk-off from tightening or liquidity shocks
  • Regulatory actions targeting decentralized derivatives platforms or infrastructure outages
  • Concentration risk in validator economics and competitive displacement
  • Competition from established centralized exchanges and other DEX perpetuals platforms
  • Technology grade unavailable (N/A), limiting technical assessment
  • Security vulnerabilities in order book or smart contract architecture

Hyperliquid Price Prediction FAQs

Can HYPE reach $60?

Yes. The 23T and 31T tiers in our price prediction models imply ranges above $60 in the Base and Moon bands, with the 23T moon case projecting $63.72 and the 31T base case projecting $62.29. These outcomes depend on liquidity and adoption improvements expected in the bullish 2026 environment. Not financial advice.

Is HYPE a good long-term investment?

HYPE shows a strong Buy rating (73.9%) with solid fundamentals (76.73%), suggesting long-term attractiveness. However, the outcome depends on adoption, liquidity regime, competition in the perpetual DEX space, and supply dynamics. The bearish near-term trading signal suggests potential volatility. Diversify and size positions responsibly. Not financial advice.

What is the Hyperliquid price prediction for 2026?

Our comprehensive HYPE price prediction framework for 2026 suggests Hyperliquid could trade between $48.81 and $70.07 depending on market conditions and total crypto market capitalization. The base case price prediction scenario clusters around $49.92 to $62.29 across different market cap environments. The Buy rating (73.9%) reflects confidence in the bullish 2026 macro backdrop. Not financial advice.

Can HYPE reach $100?

HYPE reaching $100 would exceed our current price prediction models' highest scenario of $70.07 (31T moon case). This would require extraordinary market conditions beyond the 31T total crypto market cap tier, exceptional perpetual DEX adoption, and Hyperliquid dominating the decentralized derivatives space. While the 2026 bullish thesis supports growth, $100 appears beyond our modeled scenarios. Not financial advice.

Should I buy HYPE now or wait?

HYPE has a Buy rating (73.9%) indicating long-term attractiveness in our price prediction models. However, the bearish trading signal suggests near-term downward momentum. Current price positioning and the expected bullish 2026 environment create a complex timing decision. Dollar-cost averaging may reduce timing risk while capturing upside exposure. Consider diversified DEX exposure through indices. Not financial advice.

How does HYPE compare to other DEX price predictions?

Hyperliquid focuses specifically on perpetual futures with order book architecture, differentiating it from AMM-based DEXs like Uniswap or dYdX. Our price prediction framework suggests HYPE could reach $49-$70 across scenarios in 2026. The Buy rating (73.9%) and strong fundamentals (76.73%) position HYPE competitively, though the lack of technology grade data (N/A) limits comparative technical assessment.

What makes 2026 bullish for HYPE price predictions?

Multiple factors support bullish HYPE price predictions for 2026: widening institutional access through ETFs and custody solutions, L2 scaling improvements, clearer regulatory frameworks, improving macro liquidity conditions, and the maturation of decentralized derivatives markets. These tailwinds create favorable conditions for perpetual DEX platforms like Hyperliquid to capture market share. Not financial advice.

Why is HYPE rated Buy despite bearish trading signals?

HYPE receives a Buy rating (73.9%) based on strong fundamental grade (76.73%) and favorable long-term positioning in the growing perpetual DEX space. However, the bearish trading signal reflects short-term downward momentum. This creates a classic "buy the dip" scenario where fundamentals suggest long-term value but near-term price action may provide better entry points. Our price prediction models reflect this nuance. Not financial advice.

What are the biggest risks to HYPE price predictions?

Key risks that could impact Hyperliquid price predictions include: unavailable technology grade (N/A) limiting technical assessment, competition from established centralized exchanges (Binance, OKX) and other perpetual DEXs (dYdX, GMX), regulatory targeting of decentralized derivatives, order book architecture vulnerabilities, liquidity fragmentation across perpetual platforms, and macro liquidity shocks. Despite the Buy rating, these risks warrant careful position sizing.

Can HYPE benefit from the 2026 bull market?

Yes. Our price prediction scenarios are specifically framed around the bullish 2026 thesis, where improving liquidity, institutional participation, and regulatory clarity create favorable conditions. HYPE's Buy rating (73.9%) reflects this positive macro backdrop. The base case scenarios ($49.92 to $62.29) assume steady participation in bull market dynamics, while moon cases require sustained momentum. Not financial advice.


Next Steps

Disclosure

Educational purposes only, not financial advice. Crypto is volatile, do your own research and manage risk.

Your Edge: Powered by Token Metrics

Token Metrics delivers AI-based crypto ratings, scenario-based price prediction projections, and portfolio tools so you can make smarter decisions. Discover real-time analytics on Token Metrics.

Why Use Token Metrics for HYPE Price Predictions?

  • Bullish 2026 thesis: Specialized analysis of improving macro conditions and institutional access
  • Scenario-based modeling: Four market cap tiers for comprehensive price prediction analysis
  • Buy rating transparency: Strong fundamentals (76.73%) balanced with bearish near-term signals
  • DEX specialization: Focused analysis of perpetual futures DEX competitive landscape
  • Risk management: Indices for diversified exposure beyond single DEX concentration
  • Real-time signals: Trading signals and TM Grades (Buy 73.9%) updated regularly
  • Comparative analysis: Analyze HYPE against dYdX, GMX, and 6,000+ tokens
Research

Cardano Price Prediction 2027: Layer-1 Research-Driven Analysis

Token Metrics Team
7 min read

Market Context for Cardano Price Prediction: The Case for 2027

The Layer 1 competitive landscape is consolidating as markets recognize that specialization matters more than being a generic "Ethereum killer." Cardano positions itself in this multi-chain world with specific technical and ecosystem advantages. Infrastructure maturity around custody, bridges, and developer tools makes alternative L1s more accessible heading into 2026.

The Cardano price prediction scenario projections below map different market share outcomes for ADA across varying total crypto market sizes. Base cases assume Cardano maintains current ecosystem momentum, while moon scenarios factor in accelerated adoption and bear cases reflect increased competitive pressure. Our comprehensive price prediction framework provides investors with data-driven forecasts for strategic planning.


Disclosure

Educational purposes only, not financial advice. Crypto is volatile, do your own research and manage risk.

How to Read This ADA Price Prediction

Each band blends cycle analogues and market-cap share math with TA guardrails. Base assumes steady adoption and neutral or positive macro. Moon layers in a liquidity boom. Bear assumes muted flows and tighter liquidity.

TM Agent baseline: Token Metrics lead metric for Cardano, cashtag $ADA, is a TM Grade of 29.72%, which translates to a Sell, and the trading signal is bearish, indicating short-term downward momentum. This combination means Token Metrics does not currently endorse $ADA as a long-term buy at current levels in our price prediction models. A brief market context: Bitcoin's direction remains the dominant macro driver for smart contract platforms, so sustained upside for $ADA would require a broader crypto risk-on regime and improving fundamentals or developer activity for Cardano.

Live details: Cardano Token Details

Buy ADA on Gemini

Affiliate Disclosure: We may earn a commission from qualifying purchases made via this link, at no extra cost to you.

Key Takeaways: Cardano Price Prediction Summary

  • Scenario driven: Price prediction outcomes hinge on total crypto market cap; higher liquidity and adoption lift the bands
  • Fundamentals: Fundamental Grade 77.21% (Community 80%, Tokenomics 100%, Exchange 100%, VC 36%, DeFi Scanner 83%)
  • Technology: Technology Grade 81.80% (Activity 76%, Repository 72%, Collaboration 100%, Security N/A, DeFi Scanner 83%)
  • TM Agent gist: Bearish short term in price prediction models; requires risk-on and improved fundamentals for sustained upside
  • Current rating: Sell (29.72%) despite strong fundamentals and technology scores
  • Education only, not financial advice

Cardano Price Prediction Scenario Analysis

Token Metrics price prediction scenarios span four market cap tiers, each representing different levels of crypto market maturity and liquidity:

8T Market Cap - ADA Price Prediction:

At an eight trillion dollar total crypto market cap, ADA price prediction projects to $0.94 in bear conditions, $1.05 in the base case, and $1.16 in bullish scenarios.

16T Market Cap - ADA Price Prediction:

Doubling the market to sixteen trillion expands the price prediction range to $1.53 (bear), $1.86 (base), and $2.20 (moon).

23T Market Cap - ADA Price Prediction:

At twenty-three trillion, the price prediction scenarios show $2.11, $2.67, and $3.23 respectively.

31T Market Cap - ADA Price Prediction:

In the maximum liquidity scenario of thirty one trillion, ADA price predictions could reach $2.70 (bear), $3.48 (base), or $4.27 (moon).

Each tier in our price prediction framework assumes progressively stronger market conditions, with the base case reflecting steady growth and the moon case requiring sustained bull market dynamics.

Why Consider the Indices with Top-100 Exposure

Cardano represents one opportunity among hundreds in crypto markets. Token Metrics Indices bundle ADA with top one hundred assets for systematic exposure to the strongest projects. Single tokens face idiosyncratic risks that diversified baskets mitigate.

Historical index performance demonstrates the value of systematic diversification versus concentrated positions.

Join the early access list

What Is Cardano?

Cardano is a blockchain platform designed to support secure, scalable, and sustainable decentralized applications and smart contracts. It is known for its research-driven development approach, emphasizing peer-reviewed academic research and formal verification methods to ensure reliability and security. As a proof-of-stake Layer 1 blockchain, Cardano aims to offer energy efficiency and long-term scalability, positioning itself as a competitor to platforms like Ethereum. Its native token, ADA, is used for transactions, staking, and governance. Adoption is driven by technological rigor and ecosystem growth, though progress has been criticized for being slow compared to more agile competitors—a factor that significantly influences ADA price predictions. Risks include execution delays, competition, and market volatility.

Cardano's vision is to create a decentralized platform that enables sustainable and inclusive economic systems through advanced cryptography and scientific methodology. It aims to bridge gaps between traditional financial systems and blockchain technology, promoting accessibility and security for users globally.

Token Metrics AI Analysis

Token Metrics AI provides comprehensive context on Cardano's positioning and challenges, informing our ADA price prediction models:

Vision: Cardano's vision is to create a decentralized platform that enables sustainable and inclusive economic systems through advanced cryptography and scientific methodology. It aims to bridge gaps between traditional financial systems and blockchain technology, promoting accessibility and security for users globally.

Problem: Many early blockchains face trade-offs between scalability, security, and energy efficiency. Cardano addresses the need for a more sustainable and formally verified blockchain infrastructure that can support complex applications without compromising decentralization or environmental impact. It targets inefficiencies in existing networks, particularly high energy use and lack of academic rigor in protocol design.

Solution: Cardano uses a proof-of-stake consensus algorithm called Ouroboros, which is mathematically verified for security and energy efficiency. The platform is built in layers, the settlement layer for ADA transactions and a separate computational layer for smart contracts, allowing for modular upgrades and improved scalability. It supports staking, governance, and decentralized applications, with an emphasis on formal methods to reduce vulnerabilities and ensure long-term viability.

Market Analysis: Cardano operates in the Layer 1 blockchain category, competing with Ethereum, Solana, and Avalanche. While not the market leader, it maintains a significant presence due to its academic foundation and global outreach, particularly in emerging economies. Adoption is influenced by developer activity, regulatory developments, and progress in ecosystem expansion. Its differentiator lies in its methodical, research-first approach, though this has led to slower deployment compared to peers—a critical factor in our price prediction analysis. Market risks include technological delays, competition, and shifting investor sentiment. Broader adoption depends on sustained development, real-world use cases, and interoperability advancements.

Fundamental and Technology Snapshot from Token Metrics

  • Fundamental Grade: 77.21% (Community 80%, Tokenomics 100%, Exchange 100%, VC 36%, DeFi Scanner 83%).
  • Technology Grade: 81.80% (Activity 76%, Repository 72%, Collaboration 100%, Security N/A, DeFi Scanner 83%).

Catalysts That Skew ADA Price Predictions Bullish

  • Institutional and retail access expands with ETFs, listings, and integrations
  • Macro tailwinds from lower real rates and improving liquidity
  • Product or roadmap milestones such as Hydra scaling upgrades or major partnerships
  • Accelerated smart contract deployment and DApp ecosystem growth
  • Successful real-world adoption in emerging markets (particularly Africa)
  • Improved developer onboarding and tooling reducing time-to-market
  • Strategic DeFi protocol launches on Cardano

Risks That Skew ADA Price Predictions Bearish

  • Macro risk-off from tightening or liquidity shocks
  • Regulatory actions targeting proof-of-stake networks or infrastructure outages
  • Concentration in staking pool economics and competitive displacement from faster L1s
  • Current Sell rating (29.72%) reflecting valuation and execution concerns
  • Continued slow development pace versus agile competitors (Solana, Avalanche)
  • Limited DeFi TVL and developer activity compared to Ethereum ecosystem
  • Low VC grade (36%) indicating reduced institutional backing

How Token Metrics Can Help

Token Metrics empowers you to analyze Cardano and hundreds of digital assets with AI-driven ratings, on-chain and fundamental data, and index solutions to manage portfolio risk smartly in a rapidly evolving crypto market. Our price prediction frameworks provide transparent scenario-based analysis even for tokens with Sell ratings but strong fundamentals.

Cardano Price Prediction FAQs

Can ADA reach $4?

Yes. Based on our price prediction scenarios, ADA could reach $4 in the 31T moon case, projecting $4.27. However, this requires maximum market cap expansion, significant ecosystem acceleration, and improved developer activity beyond current levels—challenging given the current Sell rating (29.72%). Not financial advice.

Can ADA 10x from current levels?

At current price of $0.65, a 10x would reach $6.50. This falls beyond all provided price prediction scenarios, which top out at $4.27 in the 31T moon case. Bear in mind that 10x returns would require substantial market cap expansion and ecosystem improvements beyond our modeled scenarios. Not financial advice.

What price could ADA reach in the moon case?

Moon case price predictions range from $1.16 at 8T to $4.27 at 31T total crypto market cap. These scenarios assume maximum liquidity expansion and strong Cardano adoption, though current Sell rating suggests significant execution improvements needed. Not financial advice.

What is the Cardano price prediction for 2027?

Our comprehensive ADA price prediction framework for 2027 suggests Cardano could trade between $0.94 and $4.27 depending on market conditions and total crypto market capitalization. The base case price prediction scenario clusters around $1.05 to $3.48 across different market cap environments. Despite strong fundamentals (77.21%) and technology (81.80%), the Sell rating (29.72%) reflects concerns about execution speed and competitive positioning. Not financial advice.

Can Cardano reach $2?

Yes. Based on our price prediction scenarios, ADA could reach $1.86 in the 16T base case and $2.20 in the 16T moon case. The $2 target becomes achievable in moderate market cap environments, though overcoming current bearish momentum and execution concerns remains critical. Not financial advice.

Should I buy ADA now or wait?

ADA has a Sell rating (29.72%) indicating Token Metrics does not currently endorse Cardano at these levels, despite strong fundamental (77.21%) and technology (81.80%) grades. Current price of $0.65 sits below even the 8T bear case ($0.94), suggesting potential value—but the Sell rating reflects concerns about execution, competitive pressure, and slow development pace. Dollar-cost averaging may reduce timing risk if you believe in Cardano's long-term research-driven thesis. Not financial advice.

Why does ADA have a Sell rating despite strong fundamentals?

ADA shows strong fundamentals (77.21%) and excellent technology (81.80%), but the overall TM Grade of 29.72% (Sell) reflects concerns about execution speed, competitive disadvantage versus faster L1s like Solana, limited DeFi ecosystem development, low VC backing (36%), and bearish trading momentum. Our price prediction models show potential upside in favorable market conditions, but current metrics suggest waiting for improved catalyst execution or better entry points. Not financial advice.

Is Cardano a good investment based on price predictions?

Cardano presents a complex investment case: strong fundamentals (77.21%), excellent technology (81.80%), but a Sell rating (29.72%) with bearish momentum. While our price prediction models show potential upside to $1.05-$4.27 depending on scenarios, current concerns about slow development, competitive pressure from Ethereum and Solana, and limited DeFi adoption suggest caution. The research-driven thesis is compelling long-term, but execution must improve. Consider diversified L1 exposure through indices. Not financial advice.

How does Cardano compare to Ethereum and Solana?

Cardano's price prediction framework suggests $0.94-$4.27 across scenarios, positioning it as a mid-tier L1. Compared to Ethereum's dominance and Solana's speed, Cardano differentiates through academic rigor and proof-of-stake sustainability. However, the Sell rating (29.72%) reflects market concerns that methodical research-first approach has resulted in slower ecosystem development. Cardano's strength in fundamentals (77.21%) and technology (81.80%) doesn't yet translate to market leadership or developer mindshare.

What are the biggest risks to Cardano price predictions?

Key risks that could impact ADA price predictions include: current Sell rating (29.72%) indicating valuation and execution concerns, slow development pace criticized versus Solana/Avalanche, limited DeFi TVL and developer activity, low VC grade (36%) showing reduced institutional backing, competitive displacement from faster L1s, regulatory targeting of proof-of-stake networks, and Bitcoin correlation dampening independent upside. Despite strong grades, execution risk dominates the near-term outlook.

Will Cardano benefit from an altcoin season?

Cardano's price prediction scenarios assume participation in broader crypto market expansion. However, the Sell rating (29.72%) and bearish momentum suggest ADA may underperform versus faster-moving L1s during altcoin rallies. Our base case scenarios ($1.05 to $3.48) reflect moderate participation in bull market dynamics, but achieving moon case targets requires Cardano demonstrating accelerated ecosystem growth and developer adoption improvements. Not financial advice.

What needs to happen for ADA to reach its price prediction targets?

For ADA to reach our price prediction targets of $1.05-$4.27, several catalysts must materialize: (1) accelerated smart contract and DApp deployment addressing slow development concerns, (2) significant DeFi TVL growth competing with Ethereum, (3) successful real-world adoption in emerging markets, (4) improved developer tooling and onboarding, (5) major partnership announcements, and (6) broader crypto market bull run providing liquidity. The Sell rating suggests these catalysts aren't currently materializing at required pace.

Next Steps

Disclosure

Educational purposes only, not financial advice. Crypto is volatile, do your own research and manage risk.

Why Use Token Metrics for Cardano Price Predictions?

  • Transparent analysis: Honest Sell ratings (29.72%) even when fundamentals (77.21%) and technology (81.80%) are strong
  • Scenario-based modeling: Four market cap tiers for comprehensive price prediction analysis
  • L1 specialization: Focused analysis of Cardano's research-driven approach versus execution speed trade-offs
  • Risk-adjusted approach: Balanced view of academic rigor strengths versus competitive disadvantages
  • Real-time signals: Trading signals and TM Grades updated regularly
  • Diversification tools: Index solutions to spread Layer-1 risk across multiple platforms
  • Comparative analysis: Analyze ADA against Ethereum, Solana, Avalanche, and 6,000+ tokens
Choose from Platinum, Gold, and Silver packages
Reach with 25–30% open rates and 0.5–1% CTR
Craft your own custom ad—from banners to tailored copy
Perfect for Crypto Exchanges, SaaS Tools, DeFi, and AI Products