Back to blog
Research

Best Cross-Chain Bridges for Crypto Traders (2025)

Explore the 10 best cross-chain bridges for traders and DeFi users in 2025, including pros, security features, fees, and use-case checklists. Compare Stargate, Synapse, and more for safe and fast crypto bridging.
Token Metrics Team
20 min read
Want Smarter Crypto Picks—Free?
See unbiased Token Metrics Ratings for BTC, ETH, and top alts.
Thank you! Your submission has been received!
Oops! Something went wrong while submitting the form.
 No credit card | 1-click unsubscribe

Who this guide is for: Traders, DeFi users, and multichain portfolio managers seeking secure, cost-effective ways to move assets across blockchains.

Top three picks:

  • Stargate Finance — deepest liquidity for stablecoin transfers across major EVM chains and non-EVM networks.
  • Synapse Protocol — fastest routes for traders needing sub-5-minute settlements on 20+ chains.
  • Across Protocol — lowest slippage and optimistic bridging for arbitrageurs and high-frequency movers.

Key caveat: Bridge fees vary by route, liquidity depth, and network congestion; always compare quotes and verify destination addresses before confirming transfers.


Introduction: Why Cross-Chain Bridges Matter in 2025

Cross-chain bridges are infrastructure protocols that enable seamless asset transfers between blockchains, solving fragmented liquidity and allowing traders to access opportunities across ecosystems without holding native tokens on every chain. In 2025, with over 100 active Layer 1 and Layer 2 networks, best cross-chain bridges for traders deliver speed, security, and capital efficiency—critical for arbitrage, yield farming, and portfolio rebalancing. This guide evaluates the top 10 cross-chain bridges based on liquidity depth, security architecture, chain coverage, fee transparency, and user experience, helping you select the right solution for your trading strategy.


How We Picked (Methodology & Scoring)

We evaluated 20+ cross-chain bridges using six weighted criteria:

  • Liquidity & Volume (30%) — Daily transfer volume, pool depth, and slippage on major routes
  • Security Architecture (25%) — Validator model, audit history, exploit record, bug bounties
  • Chain Coverage (15%) — Number of supported networks (EVM, non-EVM, L2s)
  • Costs & Fees (15%) — Bridge fees, gas optimization, hidden slippage
  • User Experience (10%) — Interface clarity, transaction speed, wallet integrations
  • Support & Documentation (5%) — Docs quality, status pages, support channels

Data sources: Official protocol documentation, pricing pages, security audit repositories, and status dashboards. Third-party volume data from CoinGecko and DefiLlama used for cross-checks only.

Last updated: November 2025


Best Cross-Chain Bridges in 2025 (Comparison Table)

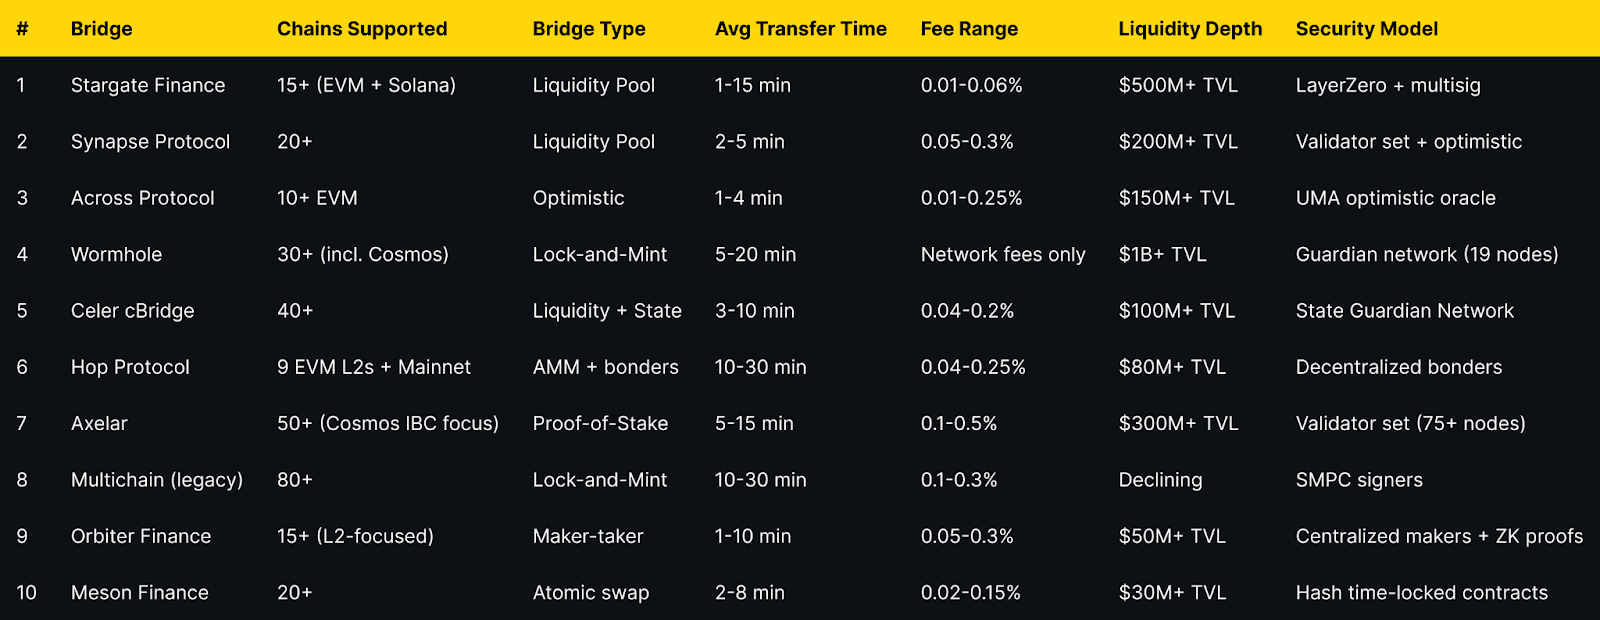
Top 10 Cross-Chain Bridges in 2025

1. Stargate Finance — Best for Stablecoin Transfers

Why Use It: Stargate leverages LayerZero's messaging protocol to offer unified liquidity pools across 15+ chains, ensuring minimal slippage for USDC, USDT, and DAI transfers. Traders benefit from instant guaranteed finality and native asset transfers without wrapped tokens, making it ideal for large stablecoin movements between Ethereum, Arbitrum, Optimism, Polygon, BNB Chain, Avalanche, and Solana.

Best For: DeFi yield farmers, arbitrageurs moving stablecoins, traders rebalancing across chains, institutional desks.

Notable Features:

  • Unified liquidity pools eliminate fragmented routes
  • Delta algorithm prevents pool depletion and maintains balance
  • Native USDC/USDT support on major chains
  • Audited by Quantstamp and Zellic with $25M bug bounty

Consider If: You need to bridge non-stablecoin assets frequently (limited ERC-20 coverage) or require sub-1-minute finality (average 1-15 min).

Alternatives: Synapse Protocol, Across Protocol


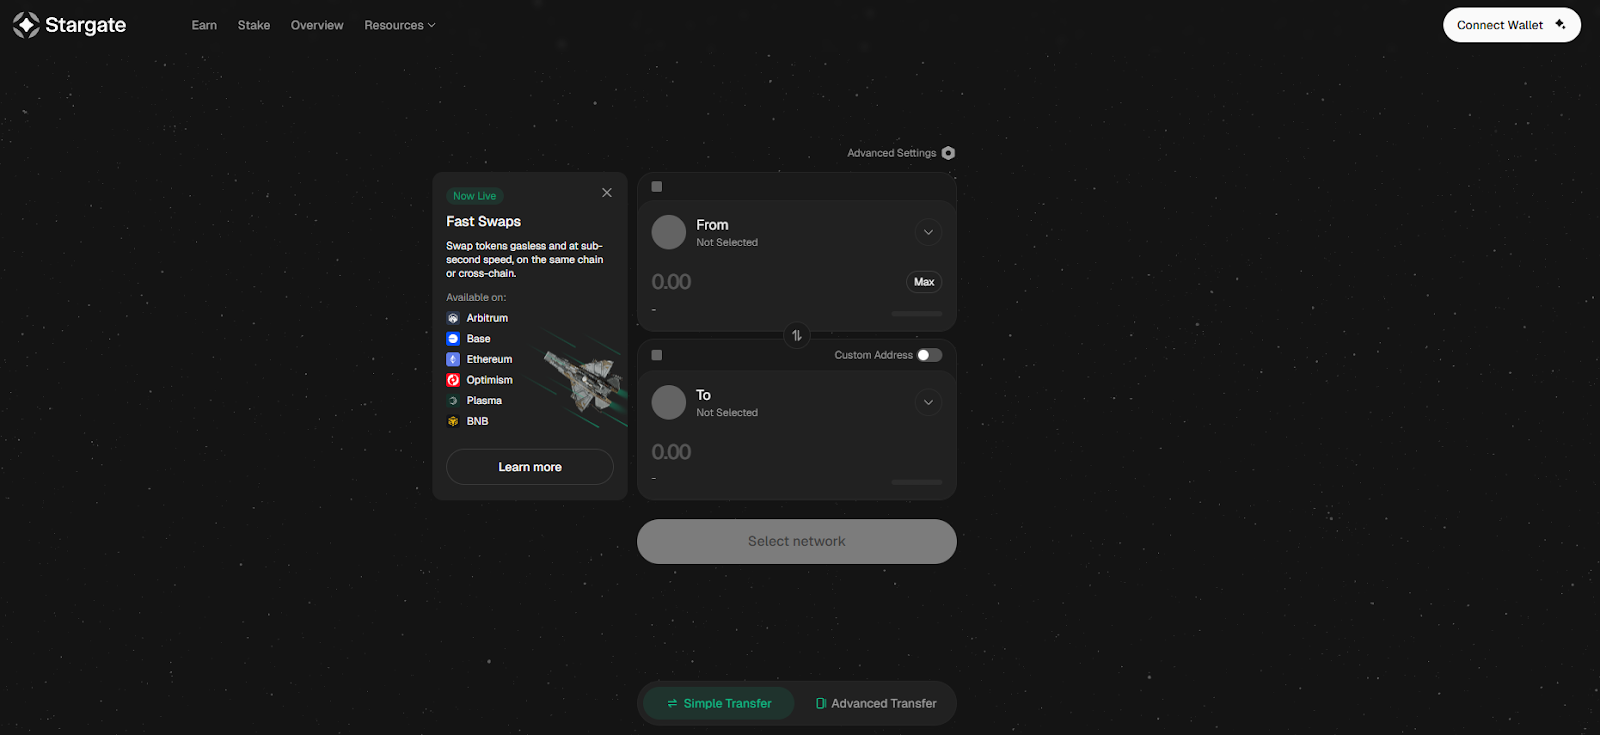
2. Synapse Protocol — Best for Speed Across 20+ Chains

Why Use It: Synapse combines liquidity pools with an optimistic verification model to deliver 2-5 minute average transfer times across 20+ networks, including Ethereum, Arbitrum, Optimism, Base, Polygon, BNB Chain, Avalanche, Fantom, Harmony, Moonbeam, and Aurora. Its nUSD and nETH synthetic assets enable efficient cross-chain swaps with competitive 0.05-0.3% fees, while the Synapse Bridge interface integrates one-click swaps for seamless UX.

Best For: Active traders prioritizing speed, multichain yield optimizers, NFT collectors moving assets, users bridging to emerging L2s.

Notable Features:

  • Sub-5-minute average transfers with optimistic verification
  • 20+ chain support including Base and zkSync Era
  • Integrated DEX for same-transaction swaps
  • Audited by Quantstamp, Certik, and Code4rena

Consider If: You move assets over $100K per transaction (liquidity depth varies by route) or need guaranteed finality before spending (optimistic delays possible).

Alternatives: Stargate Finance, Hop Protocol


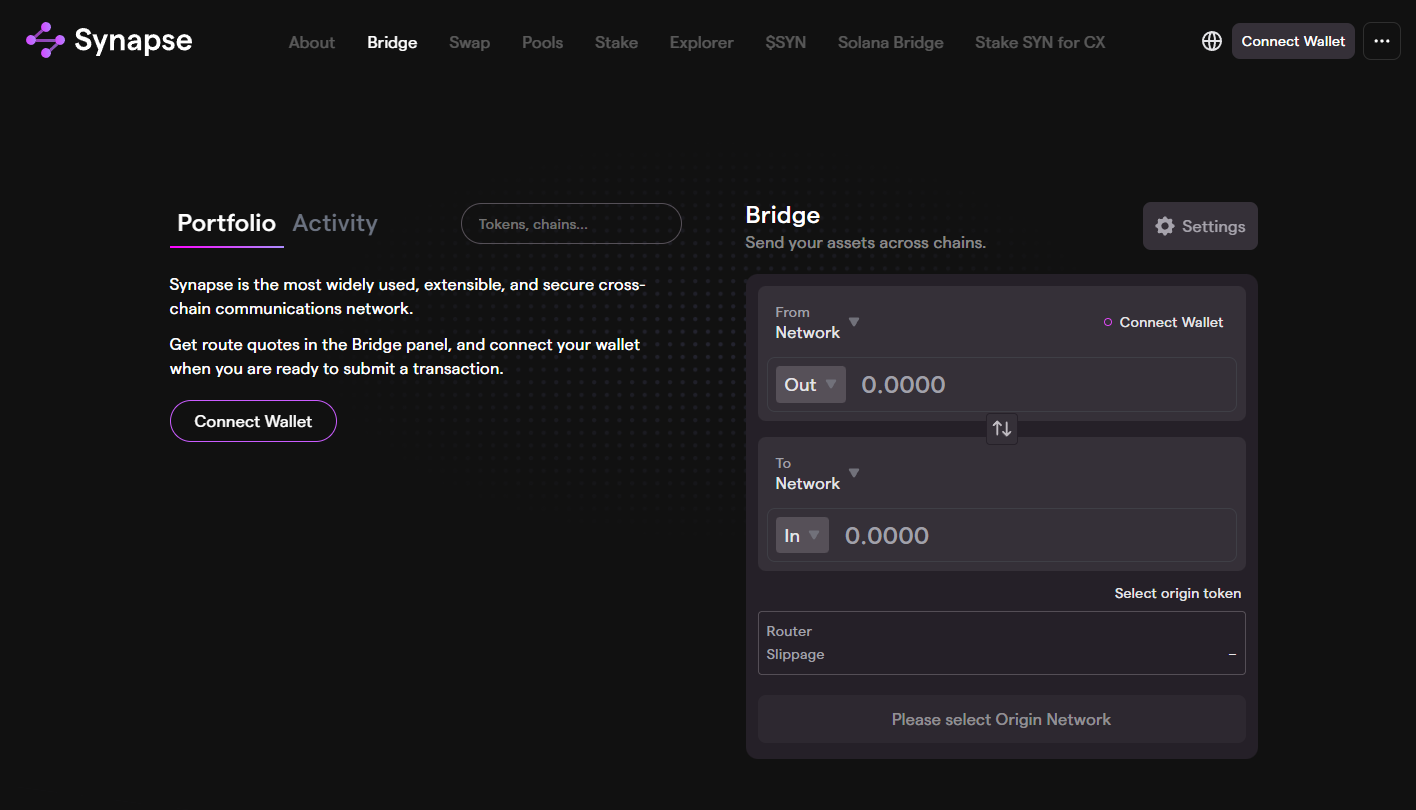
3. Across Protocol — Best for Optimistic Bridging & Low Slippage

Why Use It: Across uses UMA's optimistic oracle to facilitate near-instant transfers with relayers fronting capital and settling on the destination chain within 1-4 minutes. Traders enjoy 0.01-0.25% fees—among the lowest for EVM bridges—and minimal slippage on major routes like Ethereum to Arbitrum, Optimism, Polygon, and Base. The protocol's capital efficiency makes it ideal for arbitrageurs and high-frequency movers.

Best For: Arbitrage traders, gas-sensitive users, high-frequency DeFi participants, cost-conscious portfolio managers.

Notable Features:

  • Optimistic verification for 1-4 minute transfers
  • Ultra-low fees (0.01-0.25%) with transparent pricing
  • Relayer network ensures liquidity without pool fragmentation
  • Audited by OpenZeppelin and ABDK with ongoing bug bounty

Consider If: You need non-EVM chain support (currently EVM-only) or prefer liquidity-pool-based bridges for guaranteed execution.

Alternatives: Stargate Finance, Synapse Protocol


4. Wormhole — Best for Cross-Ecosystem Bridging

Why Use It: Wormhole is a generalized messaging protocol supporting 30+ blockchains including Ethereum, Solana, Terra, BNB Chain, Avalanche, Polygon, Fantom, Celo, and Cosmos-based chains. Its Guardian network of 19 validators enables lock-and-mint bridging for tokens and NFTs with no protocol fees beyond network gas costs. The recent Wormhole Connect widget simplifies integrations for traders using multichain dApps.

Best For: Cross-ecosystem traders (EVM to Solana/Cosmos), NFT collectors, developers integrating bridging, users of Wormhole-native dApps.

Notable Features:

  • 30+ chain support including Solana, Terra, and Cosmos IBC
  • Generalized messaging enables cross-chain smart contract calls
  • Guardian network with 19 institutional validators
  • Audited by Neodyme, Kudelski, and OtterSec post-2022 exploit recovery

Consider If: You prioritize speed over security guarantees (5-20 min transfers) or need the deepest liquidity per route (Stargate/Synapse stronger for stables).

Alternatives: Axelar, Celer cBridge


5. Celer cBridge — Best for 40+ Chain Coverage

Why Use It: Celer cBridge supports 40+ blockchains with a hybrid liquidity pool and state channel architecture, enabling 3-10 minute transfers at 0.04-0.2% fees. Its State Guardian Network provides security for cross-chain state verification, while the cBridge UI offers direct wallet integrations and historical transaction tracking. Recent additions include support for zkSync Era, Linea, and Scroll.

Best For: Multichain portfolio managers, traders accessing niche L2s, users bridging to gaming-focused chains, cost-conscious cross-chain swappers.

Notable Features:

  • 40+ chains including zkSync, Linea, Mantle, and Scroll
  • State Guardian Network for optimistic cross-chain verification
  • Integrated liquidity mining for yield on idle bridge assets
  • Audited by Certik, PeckShield, and SlowMist

Consider If: You operate in mainland China (limited access) or need guaranteed sub-5-minute finality (optimistic delays on congested routes).

Alternatives: Synapse Protocol, Axelar


6. Hop Protocol — Best for Ethereum L2 Bridging

Why Use It: Hop specializes in fast transfers between Ethereum mainnet and nine major L2s (Arbitrum, Optimism, Base, Polygon, zkSync Era, Linea, Scroll, Gnosis Chain, and Polygon zkEVM) using AMM-style liquidity pools and decentralized bonders who provide instant liquidity. Traders pay 0.04-0.25% fees and experience 10-30 minute average transfers, with the option to earn yield by providing liquidity or running bonder nodes.

Best For: L2-first traders, Ethereum mainnet to L2 bridgers, liquidity providers, users seeking decentralized bridge architecture.

Notable Features:

  • Native L2 focus with support for 9 Ethereum L2s
  • AMM-based liquidity pools for transparent pricing
  • Decentralized bonder network reduces trust assumptions
  • Audited by Consensys Diligence and OpenZeppelin

Consider If: You need to bridge to non-EVM chains (Ethereum ecosystem only) or require sub-10-minute finality consistently (bonder availability varies).

Alternatives: Synapse Protocol, Across Protocol


7. Axelar — Best for Cosmos & Proof-of-Stake Security

Why Use It: Axelar is a Cosmos SDK-based interoperability network with 75+ validators securing cross-chain transfers via proof-of-stake consensus. Supporting 50+ chains with IBC-native bridging to Cosmos, Osmosis, Injective, and other app-chains, Axelar enables secure general message passing for complex cross-chain dApp interactions at 0.1-0.5% fees. Transfers settle in 5-15 minutes with high finality guarantees.

Best For: Cosmos ecosystem traders, institutional users prioritizing security, developers building cross-chain dApps, users requiring verifiable bridge security.

Notable Features:

  • 75+ decentralized validators with proof-of-stake security
  • Native IBC support for Cosmos ecosystem chains
  • General Message Passing (GMP) for cross-chain smart contracts
  • Audited by NCC Group, OtterSec, and Certik

Consider If: You prioritize speed over security (5-15 min slower than optimistic bridges) or need the lowest fees per transaction (0.1-0.5% higher than Across/Stargate).

Alternatives: Wormhole, Celer cBridge


8. Multichain — Best for 80+ Chain Access (Use With Caution)

Why Use It: Multichain (formerly Anyswap) offers the broadest chain coverage with 80+ supported networks using SMPC (Secure Multi-Party Computation) signers for lock-and-mint bridging. While historically popular for accessing niche chains like Moonriver, Kava, and Metis, the protocol faced security concerns in mid-2023 related to validator key management. Fees range from 0.1-0.3% with 10-30 minute transfer times.

Best For: Users bridging to obscure chains unavailable elsewhere, legacy dApp integrations, traders willing to accept elevated risk for maximum coverage.

Notable Features:

  • 80+ chain support including niche L1s and L2s
  • Long operational history since 2020
  • Cross-chain router for multi-hop transactions
  • SMPC validator network (security incidents reported)

Consider If: Security is your top priority (2023 exploit drained $126M; ongoing validator concerns) or you need active development and transparent disclosures.

Alternatives: Celer cBridge, Axelar


9. Orbiter Finance — Best for L2-to-L2 Transfers

Why Use It: Orbiter uses a maker-taker model where centralized makers provide instant liquidity for L2-to-L2 transfers across 15+ chains including Arbitrum, Optimism, zkSync Era, StarkNet, Linea, Base, and Scroll. Transfers complete in 1-10 minutes at 0.05-0.3% fees, with ZK-proof verification planned for enhanced security. The interface is optimized for mobile and shows real-time maker liquidity status.

Best For: L2-native traders, StarkNet and zkSync users, mobile-first users, traders needing fast L2 exits.

Notable Features:

  • Specialized L2-to-L2 focus with 15+ network support
  • 1-10 minute average transfers via maker liquidity
  • ZK-proof verification roadmap for trustless bridging
  • Real-time liquidity tracking and maker status

Consider If: You prefer fully decentralized bridge models (makers are centralized) or need mainnet-to-L2 bridging exclusively (better alternatives exist).

Alternatives: Hop Protocol, Synapse Protocol


10. Meson Finance — Best for Atomic Swap Security

Why Use It: Meson implements hash time-locked contracts (HTLCs) for trustless atomic swaps across 20+ chains, eliminating validator risk and bridge contract vulnerabilities. Traders benefit from 2-8 minute transfers at 0.02-0.15% fees with cryptographic guarantees that transactions either complete or refund automatically. The protocol is audited by SlowMist and maintains zero-exploit history since launch.

Best For: Security-conscious traders, users burned by bridge exploits, atomic swap enthusiasts, traders moving mid-sized amounts ($1K-$50K).

Notable Features:

  • HTLC-based atomic swaps for trustless bridging
  • Zero-exploit record with cryptographic security guarantees
  • 20+ chain support including major EVM and L2s
  • 0.02-0.15% fees competitive with optimistic bridges

Consider If: You need to bridge large amounts over $100K (liquidity depth limited) or require sub-2-minute finality (HTLC setup adds overhead).

Alternatives: Across Protocol, Stargate Finance


Decision Guide: Best By Use Case

  • Stablecoin arbitrage & DeFi yield: Stargate Finance for deepest USDC/USDT liquidity
  • Fastest cross-chain execution: Synapse Protocol or Across Protocol for sub-5-minute transfers
  • Ethereum L2 specialists: Hop Protocol for native L2 bridging with decentralized bonders
  • Cross-ecosystem traders (EVM + Solana/Cosmos): Wormhole or Axelar for broadest coverage
  • Lowest fees & slippage: Across Protocol for optimistic bridging at 0.01-0.25%
  • Maximum chain coverage: Celer cBridge (40+) or Multichain (80+ with caution)
  • L2-to-L2 focus (zkSync, StarkNet, Arbitrum): Orbiter Finance for maker-taker speed
  • Security-first & trustless: Meson Finance for atomic swap guarantees
  • Institutional security requirements: Axelar for proof-of-stake validator model
  • Mobile-optimized bridging: Orbiter Finance or Synapse Protocol

How to Choose the Right Cross-Chain Bridge (Checklist)

  • [ ] Verify chain support — Confirm both source and destination chains are supported with active liquidity
  • [ ] Check fee transparency — Review total costs including bridge fees, gas, and potential slippage before confirming
  • [ ] Assess security model — Understand validator architecture (optimistic, proof-of-stake, HTLC, multisig) and audit history
  • [ ] Review transfer speed requirements — Match bridge speed (1-30 min) to your trading strategy urgency
  • [ ] Confirm liquidity depth — For large transfers ($50K+), verify pool TVL and recent volume on your specific route
  • [ ] Test with small amounts first — Always bridge test transactions ($10-$100) before moving significant capital
  • [ ] Verify destination address format — Double-check address compatibility and network selection to avoid irreversible losses
  • [ ] Monitor bridge status pages — Check for maintenance, paused routes, or congestion warnings before transacting
  • [ ] Understand finality guarantees — Know if transfers are optimistic (reversible), instant (relayer-based), or cryptographically final
  • [ ] Review regional restrictions — Confirm access from your jurisdiction (most bridges global; check compliance)
  • [ ] Check exploit history — Research past security incidents and protocol responses (Wormhole 2022, Multichain 2023)
  • 🚩 Red flags: Bridges with undisclosed validator sets, paused routes without status updates, or fees significantly higher than quoted

Use Token Metrics With Any Cross-Chain Bridge

Maximize your cross-chain trading strategy by combining bridge infrastructure with Token Metrics intelligence:

  • AI Ratings screen 6,000+ tokens across chains to identify quality assets before bridging capital

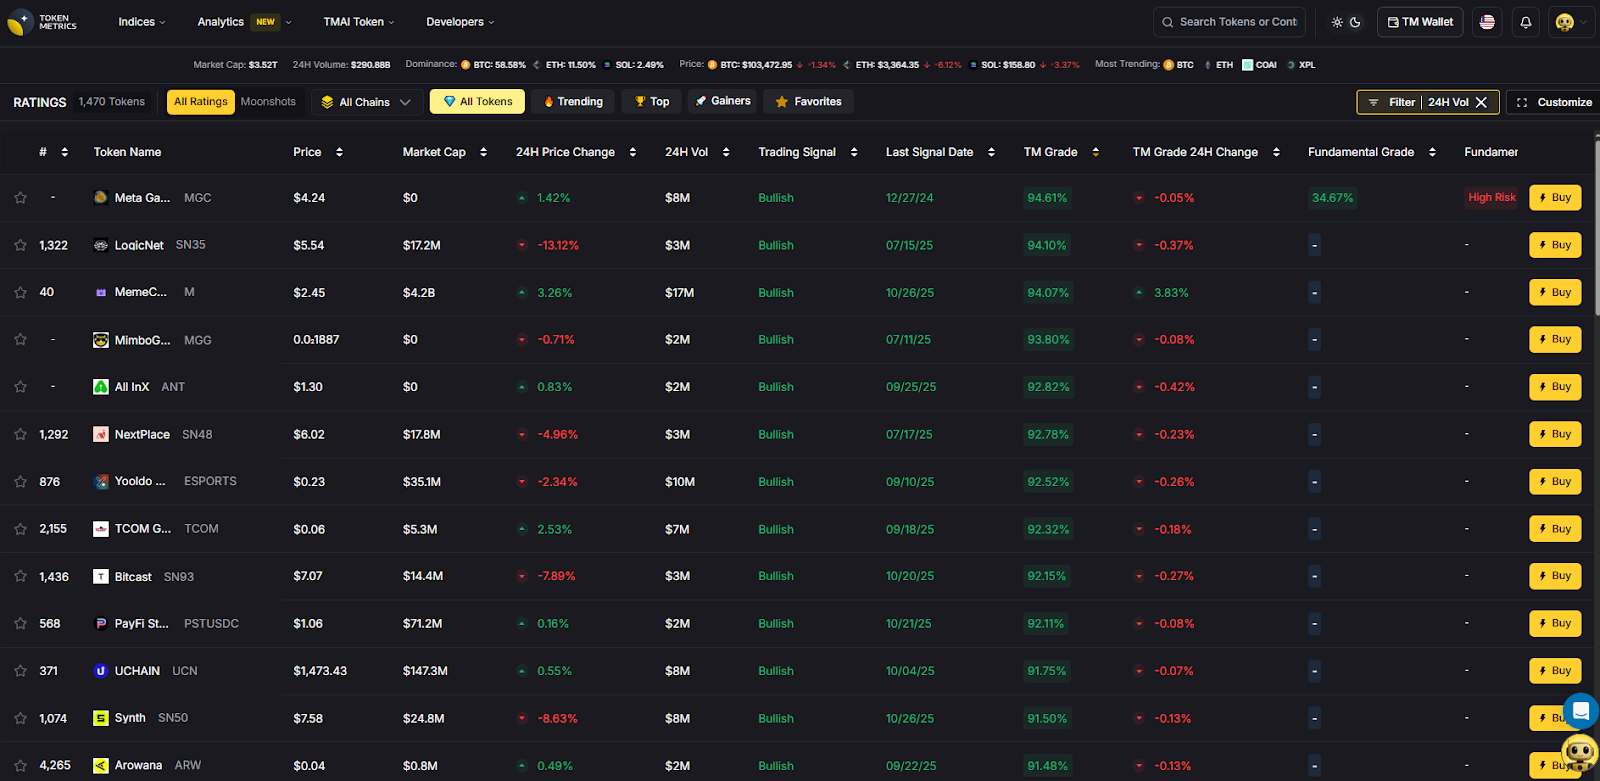
  • Narrative Detection spots emerging themes (e.g., Solana DeFi, Base ecosystem) to inform which chains to bridge into
  • Portfolio Optimization balances risk across chains and suggests rebalancing targets that justify bridge costs
  • Alerts & Signals time bridge transactions around momentum shifts, reducing exposure to unfavorable price action mid-transfer

Workflow: Research asset quality with AI Ratings → Select optimal bridge for your route → Execute transfer → Monitor destination chain with real-time alerts.

Start your free trial to screen assets and time bridge transactions with AI-powered intelligence.


Security & Compliance Tips

  • Verify official URLs — Always access bridges through bookmarked official domains; phishing sites are common
  • Use hardware wallets — Sign bridge transactions with Ledger/Trezor for cold-storage protection
  • Check token approvals — Revoke unlimited approvals after bridging using tools like Revoke.cash
  • Monitor bridge exploits — Follow protocol Twitter accounts and status pages for real-time security alerts
  • Understand validator risks — Multisig and SMPC bridges concentrate risk; optimistic and PoS models distribute trust
  • Avoid bridging during congestion — High gas fees and slippage increase during network congestion; wait for off-peak times
  • Store bridge receipts — Save transaction hashes and screenshots for tax reporting and dispute resolution
  • Test cross-chain contract calls — If using advanced features (e.g., Axelar GMP), test with minimal amounts first
  • Review liquidity provider risks — Impermanent loss and smart contract risk apply to bridge LPs; understand before depositing
  • Know refund procedures — Understand each bridge's failed transaction refund process and timeframes

This article is for research and educational purposes, not financial advice. Conduct your own security due diligence before bridging assets.


Beginner Mistakes to Avoid

  • Bridging to the wrong network — Always triple-check destination chain selection; wrong-network transfers are often irreversible
  • Ignoring slippage on large transfers — Pools with <$10M TVL may experience 1-5% slippage on $100K+ transactions
  • Bridging illiquid tokens — Ensure destination chain has DEX liquidity before bridging obscure tokens
  • Not accounting for gas on destination chain — Bridge enough native tokens (ETH, MATIC, etc.) to pay for transactions on arrival
  • Trusting wrapped tokens blindly — Verify wrapped token contracts are legitimate before swapping (scam tokens common)
  • Bridging during protocol upgrades — Avoid bridging when protocols announce maintenance windows or upgrades
  • Falling for "instant bridge" scams — No legitimate bridge offers instant finality across all chains; be skeptical of unrealistic claims
  • Ignoring bridge insurance options — Services like Nexus Mutual offer bridge exploit coverage for eligible protocols

FAQs

What is a cross-chain bridge?
 A cross-chain bridge is a protocol that enables asset transfers between different blockchains by locking tokens on the source chain and minting or unlocking equivalent tokens on the destination chain. Bridges use various security models including lock-and-mint, liquidity pools, optimistic verification, and atomic swaps to facilitate interoperability.

Are cross-chain bridges safe?
 Bridge security varies significantly by architecture and track record. Bridges secured by proof-of-stake validators (Axelar) or atomic swaps (Meson) offer stronger security than multisig or SMPC models. Historical exploits affecting Wormhole ($325M in 2022) and Multichain ($126M in 2023) highlight risks. Always verify audit reports, exploit history, and validator transparency before bridging significant amounts.

How much do cross-chain bridges cost?
 Bridge fees typically range from 0.01% to 0.5% of transfer amount, plus source and destination chain gas fees. Stargate and Across charge 0.01-0.06% for stablecoins, while Axelar charges 0.1-0.5% for broader coverage. Total costs including gas often range from $5-$50 for typical transactions, but can exceed $100 during Ethereum mainnet congestion.

Can I bridge any token between any chains?
 No—token bridging depends on protocol support and liquidity availability. Major tokens (USDC, USDT, ETH, WBTC) have deep liquidity on most bridges, while obscure tokens may only bridge via wrapped versions or not at all. Always verify token support on both source and destination chains before attempting transfers.

How long do cross-chain bridge transfers take?
 Transfer times range from 1 minute (Across optimistic transfers) to 30+ minutes (Hop during congestion or Multichain on slower chains). Average speeds: Across 1-4 min, Synapse 2-5 min, Stargate 1-15 min, Wormhole 5-20 min. Optimistic bridges are fastest but may delay finality during disputes; lock-and-mint bridges prioritize security over speed.

Do I need native tokens on the destination chain before bridging?
 Not for the bridge transaction itself, but you'll need native tokens (ETH on Ethereum, MATIC on Polygon, etc.) to pay gas for any subsequent transactions on the destination chain. Some bridges offer small gas token bridging or faucet integrations, but plan to bridge sufficient native tokens alongside your primary assets.

What happens if my bridge transaction fails?
 Failed transactions typically result in automatic refunds to the source address within 24-72 hours, though timelines vary by protocol. Optimistic bridges may take longer during dispute periods. Always save transaction hashes and monitor bridge status pages for updates. Contact protocol support via Discord or Telegram for transactions stuck beyond normal timeframes.

Can I use bridges for NFTs or only fungible tokens?
 Most bridges focus on fungible tokens (ERC-20, SPL, etc.), but several support NFT bridging. Wormhole enables NFT transfers across 30+ chains, while specialized solutions like Axelar and Celer support NFT metadata preservation. NFT bridges often charge fixed fees ($5-$20) regardless of NFT value and may take longer than fungible token transfers.


Conclusion + Related Reads

Selecting the right cross-chain bridge depends on your priorities: Stargate Finance delivers the deepest stablecoin liquidity for DeFi-focused traders, Synapse Protocol offers the fastest execution across 20+ chains, and Across Protocol provides the lowest fees for cost-conscious arbitrageurs. Security-first users should consider Meson Finance for atomic swap guarantees or Axelar for institutional-grade proof-of-stake validation. Always test with small amounts, verify destination addresses, and monitor bridge status pages before moving significant capital.

Related Reads:

Build Smarter Crypto Apps &
AI Agents in Minutes, Not Months
Real-time prices, trading signals, and on-chain insights all from one powerful API.
Grab a Free API Key
About Token Metrics
Token Metrics: AI-powered crypto research and ratings platform. We help investors make smarter decisions with unbiased Token Metrics Ratings, on-chain analytics, and editor-curated “Top 10” guides. Our platform distills thousands of data points into clear scores, trends, and alerts you can act on.
30 Employees
analysts, data scientists, and crypto engineers
Daily Briefings
concise market insights and “Top Picks”
Transparent & Compliant
Sponsored ≠ Ratings; research remains independent
Want Smarter Crypto Picks—Free?
See unbiased Token Metrics Ratings for BTC, ETH, and top alts.
Thank you! Your submission has been received!
Oops! Something went wrong while submitting the form.
 No credit card | 1-click unsubscribe
Token Metrics Team
Token Metrics Team

Recent Posts

Research

Hedera Price Prediction 2027: $0.10-$1.42 Target Analysis

Token Metrics Team
8 min read

Hedera Price Prediction: Portfolio Context for HBAR in the 2027 Landscape

Layer 1 tokens like Hedera represent bets on specific blockchain architectures winning developer and user mindshare. HBAR carries both systematic crypto risk and unsystematic risk from Hedera's technical roadmap execution and ecosystem growth. Multi-chain thesis suggests diversifying across several L1s rather than concentrating in one, since predicting which chains will dominate remains difficult.

The price prediction projections below show how HBAR might perform under different market cap scenarios. While Hedera may have strong fundamentals, prudent portfolio construction balances L1 exposure across Ethereum, competing smart contract platforms, and Bitcoin to capture the sector without overexposure to any single chain's fate.


Disclosure

Educational purposes only, not financial advice. Crypto is volatile, do your own research and manage risk.

How to read this price prediction:

Each band blends cycle analogues and market-cap share math with TA guardrails. Base assumes steady adoption and neutral or positive macro. Moon layers in a liquidity boom. Bear assumes muted flows and tighter liquidity.

TM Agent baseline:

Token Metrics lead metric for Hedera price prediction, cashtag $HBAR, is a TM Grade of 61.8%, which maps to Hold, and the trading signal is bearish, indicating short-term downward momentum. This means Token Metrics views $HBAR as having reasonably solid fundamentals but limited conviction for strong outperformance in the near term.

A concise long-term numeric price prediction view for a 12-month horizon: Token Metrics scenarios center around a range of about $0.06 to $0.18, with a base case price target near $0.10, reflecting steady ecosystem growth, moderate adoption of Hedera services, and continued enterprise partnerships. Implication: if Bitcoin and broader crypto risk appetite improve, $HBAR could revisit the higher end of the price prediction range, while a risk-off market or slower-than-expected developer traction would keep it toward the lower bound.

Token Details

Key Takeaways

  • Scenario driven, outcomes hinge on total crypto market cap, higher liquidity and adoption lift the bands.
  • Single-asset concentration amplifies both upside and downside versus diversified approaches.
  • Fundamentals: Fundamental Grade 81.08% (Community 74%, Tokenomics 100%, Exchange 100%, VC 59%, DeFi Scanner 85%).
  • Technology: Technology Grade 62.39% (Activity 58%, Repository 68%, Collaboration 74%, Security 56%, DeFi Scanner 85%).
  • TM Agent gist: bearish short term, range view with upside if crypto risk appetite improves.
  • Education only, not financial advice.

Hedera Price Prediction: Scenario Analysis

Token Metrics price prediction scenarios span four market cap tiers, each representing different levels of crypto market maturity and liquidity:

8T Market Cap Price Prediction:

At an 8 trillion dollar total crypto market cap, HBAR price prediction projects to $0.27 in bear conditions, $0.32 in the base case, and $0.37 in bullish scenarios.

16T Market Cap Price Prediction:

Doubling the market to 16 trillion expands the price prediction range to $0.42 (bear), $0.57 (base), and $0.72 (moon).

23T Market Cap Price Prediction:

At 23 trillion, the price forecast scenarios show $0.56, $0.82, and $1.07 respectively.

31T Market Cap Price Prediction:

In the maximum liquidity scenario of 31 trillion, HBAR price prediction could reach $0.71 (bear), $1.07 (base), or $1.42 (moon).

These price prediction ranges illustrate potential outcomes for concentrated HBAR positions, but investors should weigh whether single-asset exposure matches their risk tolerance or whether diversified strategies better suit their objectives.

The Case for Diversified Index Exposure

Professional investors across asset classes prefer diversified exposure over concentrated bets for good reason. Hedera faces numerous risks - technical vulnerabilities, competitive pressure, regulatory targeting, team execution failure - any of which could derail HBAR performance independent of broader market conditions. Token Metrics Indices spread this risk across one hundred tokens, ensuring no single failure destroys your crypto portfolio.

Diversification becomes especially critical in crypto given the sector's nascency and rapid evolution. Technologies and narratives that dominate today may be obsolete within years as the space matures. By holding HBAR exclusively, you're betting not only on crypto succeeding but on Hedera specifically remaining relevant. Index approaches hedge against picking the wrong horse while maintaining full crypto exposure.

Tax efficiency and rebalancing challenges also favor indices over managing concentrated positions. Token Metrics Indices handle portfolio construction, rebalancing, and position sizing systematically, eliminating the emotional and logistical burden of doing this manually with multiple tokens.

Early access to Token Metrics Indices 

What Is Hedera?

Hedera is a high-performance public ledger that emphasizes speed, low fees, and energy efficiency, positioning itself for enterprise and decentralized applications. It uses a unique Hashgraph consensus that enables fast finality and high throughput, paired with a council-governed model that targets real-world use cases like payments, tokenization, and decentralized identity.

HBAR is the native token used for fees, staking, and network security, and it supports smart contracts and decentralized file storage. Adoption draws from partnerships and integrations, though decentralization levels and reliance on institutional demand are often discussed in the community.

Token Metrics AI Analysis for Price Prediction

Token Metrics AI provides comprehensive context on Hedera's positioning and challenges that inform our price prediction models.

  • Vision: Hedera's vision is to provide a secure, fair, and scalable distributed ledger technology platform that supports decentralized applications and enterprise use cases globally. It emphasizes governed decentralization, aiming to combine the benefits of distributed systems with responsible oversight through its council-based governance model.
  • Problem: Many blockchain networks face trade-offs between scalability, security, and decentralization, often resulting in high transaction fees, slow processing times, or environmental concerns. Hedera aims to address these limitations by offering a system that supports high throughput and fast finality without sacrificing security or incurring significant energy costs, making it suitable for both enterprise and decentralized applications.
  • Solution: Hedera uses the Hashgraph consensus algorithm, a directed acyclic graph (DAG)-based approach that achieves asynchronous Byzantine fault tolerance, enabling fast, secure, and fair transaction processing. The network supports smart contracts, tokenization, and decentralized file storage, with HBAR serving as the native token for fees, staking, and network security. Its council-governed model aims to ensure stability and trust, particularly for institutional and enterprise users.
  • Market Analysis: Hedera operates in the Layer 1 blockchain space, competing with high-throughput platforms like Solana, Avalanche, and Algorand, while differentiating through its Hashgraph consensus and governed governance model. It targets enterprise adoption, focusing on use cases in supply chain, payments, and asset tokenization, which sets it apart from more community-driven or DeFi-centric networks. Adoption is influenced by strategic partnerships, developer engagement, and real-world integrations rather than speculative activity. Key risks include competition from established and emerging blockchains, regulatory scrutiny around governance tokens, and challenges in achieving broad decentralization.

Fundamental and Technology Snapshot from Token Metrics

Fundamental Grade: 81.08% (Community 74%, Tokenomics 100%, Exchange 100%, VC 59%, DeFi Scanner 85%).


Technology Grade: 62.39% (Activity 58%, Repository 68%, Collaboration 74%, Security 56%, DeFi Scanner 85%).


Catalysts That Skew Bullish for Price Prediction

  • Institutional and retail access expands with ETFs, listings, and integrations
  • Macro tailwinds from lower real rates and improving liquidity
  • Product or roadmap milestones such as upgrades, scaling, or partnerships
  • These factors could push HBAR toward higher price prediction targets

Risks That Skew Bearish for Price Prediction

  • Macro risk-off from tightening or liquidity shocks
  • Regulatory actions or infrastructure outages
  • Concentration in validator economics and competitive displacement
  • Protocol-specific execution risk and competitive pressure from alternatives
  • These factors could push HBAR toward lower price prediction scenarios

FAQs: Hedera Price Prediction

Can HBAR reach $1.00 according to price predictions?

Yes. Based on the price prediction scenarios, HBAR could reach $1.00 or above in the higher tiers. The 23T tier projects $1.07 in the moon case price forecast and the 31T tier projects $1.42 in the moon case. Achieving this price prediction requires broad market cap expansion and Hedera maintaining competitive position. Not financial advice.

What price could HBAR reach in the moon case price prediction?

Moon case price predictions range from $0.37 at 8T to $1.42 at 31T total crypto market cap. These price prediction scenarios assume maximum liquidity expansion and strong Hedera adoption. Diversified strategies aim to capture upside across multiple tokens rather than betting exclusively on any single moon scenario. Not financial advice.

What's the risk/reward profile for HBAR price prediction?

Risk and reward in our price prediction model span from $0.27 in the lowest bear case to $1.42 in the highest moon case. Downside risks include regulatory or infrastructure setbacks and competitive pressure, while upside drivers include improved liquidity and enterprise adoption. Concentrated positions amplify both tails, while diversified strategies smooth outcomes.

What is the 2027 Hedera price prediction?

Based on Token Metrics analysis, the 2027 price prediction for Hedera centers around $0.10 in the base case under current market conditions, with a range between $0.06 and $0.18 depending on market scenarios. Bullish price predictions range from $0.32 to $1.42 across different total crypto market cap environments.

What drives HBAR price predictions?

HBAR price predictions are driven by enterprise adoption of Hashgraph technology, institutional partnerships (Google Cloud, IBM, Boeing), council governance decisions, and competition from other Layer 1 platforms. The strong fundamentals (81.08% grade) support long-term price potential, though short-term bearish signals suggest caution. Enterprise use case development remains the primary driver for reaching upper price prediction targets.

Can HBAR reach $0.50 by 2027?

According to our price prediction models, HBAR could reach $0.50+ in multiple scenarios: the 16T base case ($0.57), 16T moon case ($0.72), and all higher market cap tiers. This price prediction outcome requires steady crypto market growth (16T+ total market cap) and Hedera maintaining strong enterprise partnerships. Not financial advice.


Next Steps

Disclosure

Educational purposes only, not financial advice. Crypto is volatile, concentration amplifies risk, and diversification is a fundamental principle of prudent portfolio construction. Do your own research and manage risk appropriately.

Research

LEO Token Price Prediction: Comprehensive Market Cap Scenario Analysis

Token Metrics Team
5 min read

LEO Token Price Prediction Framework: Market Cap Scenarios

Exchange tokens derive value from trading volume and platform revenue, creating linkage between crypto market activity and LEO price action. LEO Token delivers utility through reduced trading fees and enhanced platform services on Bitfinex and iFinex across Ethereum and EOS. Token Metrics price prediction scenarios below model LEO outcomes across different total crypto market cap environments, providing investors with data-driven forecasts for strategic decision-making.


Disclosure

Educational purposes only, not financial advice. Crypto is volatile, do your own research and manage risk.

How to Read This LEO Price Prediction

Each band blends cycle analogues and market-cap share math with TA guardrails. Base assumes steady adoption and neutral or positive macro. Moon layers in a liquidity boom. Bear assumes muted flows and tighter liquidity.

TM Agent baseline: Token Metrics price prediction probabilities favor a modest range between about $5 and $15, with a base case around current levels near $9, conditional on exchange token utility remaining steady, and downside risk if centralized exchange macro pressure increases.

Live details: Token Details 

Key Takeaways

  • Scenario driven, outcomes hinge on total crypto market cap, higher liquidity and adoption lift the bands.
  • TM Agent gist: 12-month horizon favors $5 to $15 range with base case near $9, contingent on stable exchange utility.
  • Education only, not financial advice.

LEO Token Price Prediction Scenario Analysis

Token Metrics price prediction scenarios span four market cap tiers reflecting different crypto market maturity levels:

8T Market Cap - LEO Price Prediction:

At 8 trillion total crypto market cap, LEO price prediction projects to $11.35 in bear conditions, $12.92 in the base case, and $14.48 in bullish scenarios.

16T Market Cap - LEO Price Prediction:

At 16 trillion total crypto market cap, LEO price prediction projects to $14.82 in bear conditions, $19.51 in the base case, and $24.20 in bullish scenarios.

23T Market Cap - LEO Price Prediction:

At 23 trillion total crypto market cap, LEO price prediction projects to $18.28 in bear conditions, $26.10 in the base case, and $33.92 in bullish scenarios.

31T Market Cap - LEO Price Prediction:

At 31 trillion total crypto market cap, LEO price prediction projects to $21.74 in bear conditions, $32.69 in the base case, and $43.63 in bullish scenarios.

Each tier in our price prediction framework assumes progressively stronger market conditions, with base scenarios reflecting steady exchange growth and moon cases requiring sustained bull market dynamics.

What Is LEO Token?

LEO Token is the native utility token of the Bitfinex and iFinex ecosystem, designed to provide benefits like reduced trading fees, enhanced lending and borrowing terms, and access to exclusive features on the platform. It operates on both Ethereum (ERC-20) and EOS blockchains, offering flexibility for users.

The primary role of LEO is to serve as a utility token within the exchange ecosystem, enabling fee discounts, participation in token sales, and other platform-specific advantages. Common usage patterns include holding LEO to reduce trading costs and utilizing it for enhanced platform services, positioning it primarily within the exchange token sector.

Catalysts That Skew LEO Price Predictions Bullish

  • Institutional and retail access expands with ETFs, listings, and integrations
  • Macro tailwinds from lower real rates and improving liquidity
  • Product or roadmap milestones such as upgrades, scaling, or partnerships
  • Increased Bitfinex trading volume and platform adoption
  • Strategic token burns and buyback programs

Risks That Skew LEO Price Predictions Bearish

  • Macro risk-off from tightening or liquidity shocks
  • Regulatory actions targeting centralized exchanges or infrastructure outages
  • Concentration risk or competitive displacement from rival exchange tokens
  • Declining exchange market share or trading volume
  • Negative sentiment around centralized exchange tokens

LEO Token Price Prediction FAQs

What gives LEO value?

LEO accrues value through reduced trading fees and enhanced platform services within the Bitfinex and iFinex ecosystem. Demand drivers include exchange usage and access to platform features, while supply dynamics follow the token's exchange utility design. Value realization depends on platform activity and user adoption—key factors in our price prediction methodology.

What price could LEO reach in the moon case?

Our moon case price predictions range from $14.48 at 8T to $43.63 at 31T total crypto market cap. These scenarios require maximum market cap expansion and strong exchange activity. Not financial advice.

What is the LEO Token price prediction for 2025-2027?

Our comprehensive price prediction framework suggests LEO could trade between $5 and $43.63 depending on market conditions and total crypto market capitalization. The base case price prediction scenario clusters around $9 to $32.69 across different market cap environments over the next 12-24 months. Not financial advice.

Can LEO Token reach $20?

Yes. Based on our price prediction scenarios, LEO could reach $19.51 in the 16T base case and surpass $20 in higher market cap scenarios (23T and 31T tiers). The 23T base case projects $26.10, making $20 an achievable target under favorable market conditions. Not financial advice.

Can LEO Token reach $50?

LEO reaching $50 would exceed our current price prediction models' highest scenario of $43.63 (31T moon case). This would require extraordinary market conditions beyond the 31T total crypto market cap tier and exceptional Bitfinex platform growth. Not financial advice.

Is LEO Token a good investment based on price predictions?

LEO's price prediction is tied to Bitfinex exchange performance and utility value. The token offers fee discounts and platform benefits, with moderate growth potential in our base scenarios. However, exchange token valuations carry platform-specific risks. Always conduct your own research and consult financial advisors. Not financial advice.

How accurate are LEO Token price predictions?

Our LEO price predictions use scenario-based modeling across multiple market cap tiers, combining cycle analogues, market-cap share math, and technical analysis guardrails. While this methodology provides structured forecasts, cryptocurrency markets remain highly volatile and unpredictable. Use these price predictions as educational frameworks, not guarantees. Not financial advice.


Next Steps

Curious how these forecasts are made? Token Metrics delivers LEO on-chain grades, forecasts, and deep research on 6,000+ tokens. Instantly compare fundamentals, on-chain scores, and AI-powered predictions.

Disclosure

Educational purposes only, not financial advice. Crypto is volatile, do your own research and manage risk.

Why Use Token Metrics for LEO Price Predictions?

  • Data-driven forecasts: Scenario-based price prediction models across multiple market cap tiers
  • Comprehensive analysis: On-chain metrics, fundamental grades, and technical guardrails
  • AI-powered insights: Advanced algorithms analyze 6,000+ tokens for comparative analysis
  • Regular updates: Real-time price predictions and signals based on market conditions
  • Risk management: Multiple scenarios (bear, base, moon) for informed decision-making
Research

SUI Price Prediction 2027: Layer-1 Portfolio Diversification Analysis

Token Metrics Team
8 min read

Portfolio Context for Sui Price Prediction: Diversification in the 2027 Landscape

Layer 1 tokens like Sui represent bets on specific blockchain architectures winning developer and user mindshare. SUI carries both systematic crypto risk and unsystematic risk from Sui's technical roadmap execution and ecosystem growth. Multi-chain thesis suggests diversifying across several L1s rather than concentrating in one, since predicting which chains will dominate remains difficult.

The SUI price prediction projections below show how SUI might perform under different market cap scenarios. While Sui may have strong fundamentals, prudent portfolio construction balances L1 exposure across Ethereum, competing smart contract platforms, and Bitcoin to capture the sector without overexposure to any single chain's fate.


Disclosure

Educational purposes only, not financial advice. Crypto is volatile, do your own research and manage risk.

How to Read This SUI Price Prediction Framework

Each band blends cycle analogues and market-cap share math with TA guardrails. Base assumes steady adoption and neutral or positive macro. Moon layers in a liquidity boom. Bear assumes muted flows and tighter liquidity.

TM Agent baseline: Token Metrics lead metric for Sui, cashtag $SUI, is a TM Grade of 67.4%, which maps to a Hold, and the trading signal is bearish, indicating short-term downward momentum. This suggests Token Metrics sees $SUI as having reasonable fundamentals but not yet strong conviction for substantial outperformance in our price prediction models, while near-term momentum is negative and could limit rallies. Market context, brief: Bitcoin's price direction is currently the primary market driver, and a risk-off Bitcoin environment increases downside pressure on layer-1 tokens like $SUI.

Token Details 

The Case for Diversified Index Exposure

Professional investors across asset classes prefer diversified exposure over concentrated bets for good reason. Sui faces numerous risks—technical vulnerabilities, competitive pressure, regulatory targeting, team execution failure—any of which could derail SUI price prediction performance independent of broader market conditions. Token Metrics Indices spread this risk across one hundred tokens, ensuring no single failure destroys your crypto portfolio.

Diversification becomes especially critical in crypto given the sector's nascency and rapid evolution. Technologies and narratives that dominate today may be obsolete within years as the space matures. By holding SUI exclusively, you're betting not only on crypto succeeding but on Sui specifically remaining relevant. Index approaches hedge against picking the wrong horse while maintaining full crypto exposure.

Early access to Token Metrics Indices

Key Takeaways: SUI Price Prediction Summary

  • Scenario driven: Price prediction outcomes hinge on total crypto market cap; higher liquidity and adoption lift the bands
  • Single-asset concentration: Amplifies both upside and downside versus diversified approaches
  • Fundamentals: Fundamental Grade 77.60% (Community 80%, Tokenomics 60%, Exchange 100%, VC 76%, DeFi Scanner 75%)
  • Technology: Technology Grade 79.06% (Activity 77%, Repository 72%, Collaboration 89%, Security N/A, DeFi Scanner 75%)
  • TM Agent gist: Hold grade, bearish trading signal, near-term negative momentum in price prediction models
  • Education only, not financial advice

SUI Price Prediction Scenario Analysis

Token Metrics price prediction scenarios span four market cap tiers, each representing different levels of crypto market maturity and liquidity:

8T Market Cap - SUI Price Prediction:

At an 8 trillion total crypto market cap, SUI price prediction projects to $4.64 in bear conditions, $6.29 in the base case, and $7.94 in bullish scenarios.

16T Market Cap - SUI Price Prediction:

At a 16 trillion total crypto market cap, SUI price prediction projects to $8.93 in bear conditions, $13.88 in the base case, and $18.83 in bullish scenarios.

23T Market Cap - SUI Price Prediction:

At a 23 trillion total crypto market cap, SUI price prediction projects to $13.22 in bear conditions, $21.47 in the base case, and $29.72 in bullish scenarios.

31T Market Cap - SUI Price Prediction:

At a 31 trillion total crypto market cap, SUI price prediction projects to $17.50 in bear conditions, $29.05 in the base case, and $40.61 in bullish scenarios.

These price prediction ranges illustrate potential outcomes for concentrated SUI positions, but investors should weigh whether single-asset exposure matches their risk tolerance or whether diversified strategies better suit their objectives.

What Is Sui?

Sui is a layer-1 blockchain network designed for general-purpose smart contracts and scalable user experiences. It targets high throughput and fast settlement, aiming to support applications that need low-latency interactions and horizontal scaling.

SUI is the native token used for transaction fees and staking, aligning validator incentives and securing the network. It underpins activity across common crypto sectors such as NFTs and DeFi while the ecosystem builds developer tooling and integrations.

Token Metrics AI Analysis

Token Metrics AI provides comprehensive context informing our SUI price prediction models:

Vision: Sui aims to create a highly scalable and low-latency blockchain platform that enables seamless user experiences for decentralized applications. Its vision centers on making blockchain technology accessible and efficient for mainstream applications by removing traditional bottlenecks in transaction speed and cost.

Problem: Many existing blockchains face trade-offs between scalability, security, and decentralization, often resulting in high fees and slow transaction finality during peak usage. This limits their effectiveness for applications requiring instant settlement, frequent interactions, or large user bases, such as games or social platforms. Sui addresses the need for a network that can scale horizontally without sacrificing speed or cost-efficiency.

Solution: Sui uses a unique object-centric blockchain model and the Move programming language to enable parallel transaction processing, allowing high throughput and instant finality for many operations. Its consensus mechanism, Narwhal and Tusk, is optimized for speed and scalability by decoupling transaction dissemination from ordering. The network supports smart contracts, NFTs, and decentralized applications, with an emphasis on developer ease and user experience. Staking is available for network security, aligning with common proof-of-stake utility patterns.

Market Analysis: Sui competes in the layer-1 blockchain space with platforms like Solana, Avalanche, and Aptos, all targeting high-performance decentralized applications. It differentiates itself through its object-based data model and parallel execution, aiming for superior scalability in specific workloads. Adoption drivers include developer tooling, ecosystem incentives, and integration with wallets and decentralized exchanges. The broader market for high-throughput blockchains is driven by demand for scalable Web3 applications, though it faces risks from technical complexity, regulatory uncertainty, and intense competition—all critical factors in our price prediction analysis.

Fundamental and Technology Snapshot from Token Metrics

Fundamental Grade: 77.60% (Community 80%, Tokenomics 60%, Exchange 100%, VC 76%, DeFi Scanner 75%).


Technology Grade: 79.06% (Activity 77%, Repository 72%, Collaboration 89%, Security N/A, DeFi Scanner 75%).


Catalysts That Skew SUI Price Predictions Bullish

  • Institutional and retail access expands with ETFs, listings, and integrations
  • Macro tailwinds from lower real rates and improving liquidity
  • Product or roadmap milestones such as upgrades, scaling, or partnerships
  • Growing developer ecosystem and dApp adoption
  • Strategic partnerships with major Web3 platforms

Risks That Skew SUI Price Predictions Bearish

  • Macro risk-off from tightening or liquidity shocks
  • Regulatory actions or infrastructure outages
  • Concentration or validator economics and competitive displacement
  • Protocol-specific execution risk and competitive pressure from alternatives
  • Technical vulnerabilities or smart contract exploits

How Token Metrics Can Help

Token Metrics empowers you to analyze Sui and hundreds of digital assets with AI-driven ratings, on-chain and fundamental data, and index solutions to manage portfolio risk smartly in a rapidly evolving crypto market. Our price prediction frameworks provide scenario-based analysis to inform your investment decisions.

SUI Price Prediction FAQs

What price could SUI reach in the moon case?

Our moon case price predictions range from $7.94 at 8T to $40.61 at 31T total crypto market cap. These scenarios assume maximum liquidity expansion and strong Sui adoption. Diversified strategies aim to capture upside across multiple tokens rather than betting exclusively on any single moon scenario. Not financial advice.

What is the SUI price prediction for 2025-2027?

Our comprehensive SUI price prediction framework suggests SUI could trade between $4.64 and $40.61 depending on market conditions and total crypto market capitalization. The base case price prediction scenario clusters around $6.29 to $29.05 across different market cap environments. Current TM Grade of 67.4% indicates a Hold rating with bearish near-term momentum. Not financial advice.

Can SUI reach $20?

Yes. Based on our price prediction scenarios, SUI could reach $21.47 in the 23T base case and $18.83 in the 16T moon case. The price target of $20 becomes achievable in moderate to high market cap environments with steady ecosystem growth. Not financial advice.

Can SUI reach $50?

SUI reaching $50 would exceed our current price prediction models' highest scenario of $40.61 (31T moon case). This would require extraordinary market conditions beyond the 31T total crypto market cap tier, exceptional ecosystem adoption, and SUI capturing significant market share from competing L1s. Not financial advice.

What's the risk/reward profile for SUI?

Our SUI price prediction risk/reward spans from $4.64 to $40.61 across all scenarios. Downside risks include regulatory pressure and competitive displacement, while upside drivers include ecosystem growth and favorable liquidity. Concentrated positions amplify both tails, while diversified strategies smooth outcomes and reduce single-asset risk.

What are the biggest risks to SUI price predictions?

Key risks that could impact SUI price predictions include regulatory actions, technical issues, competitive pressure from other L1s (Solana, Avalanche, Aptos), adverse market liquidity, validator centralization concerns, and execution challenges. Concentrated SUI positions magnify exposure to these risks. Diversified strategies spread risk across tokens with different profiles, reducing portfolio vulnerability to any single failure point.

Is SUI a good investment based on price predictions?

SUI shows solid fundamentals (77.60% grade) and technology scores (79.06% grade), but currently has a Hold rating (67.4% TM Grade) with bearish near-term trading signals. While our price prediction models show potential upside in favorable market conditions, the bearish momentum and L1 competition suggest a cautious approach. Consider diversified exposure rather than concentrated positions. Not financial advice.

How does SUI compare to other L1 price predictions?

SUI competes with Solana, Avalanche, and Aptos in the high-performance L1 space. Our price prediction framework suggests SUI's performance will correlate with broader L1 adoption trends while facing differentiation challenges. Diversified L1 exposure through indices may offer better risk-adjusted returns than concentrated SUI positions, as predicting which specific L1 will dominate remains uncertain.


Next Steps

Disclosure
Educational purposes only, not financial advice. Crypto is volatile, concentration amplifies risk, and diversification is a fundamental principle of prudent portfolio construction. Do your own research and manage risk appropriately.

Why Use Token Metrics for SUI Price Predictions?

  • Scenario-based modeling: Multiple market cap tiers for comprehensive price prediction analysis
  • AI-driven analysis: Fundamental (77.60%) and technology (79.06%) grades for informed decisions
  • Risk management tools: Index solutions to diversify L1 exposure beyond single-asset concentration
  • Real-time signals: Trading signals and TM Grades updated regularly
  • Comparative analysis: Analyze SUI against 6,000+ tokens for portfolio optimization
Choose from Platinum, Gold, and Silver packages
Reach with 25–30% open rates and 0.5–1% CTR
Craft your own custom ad—from banners to tailored copy
Perfect for Crypto Exchanges, SaaS Tools, DeFi, and AI Products