Discover the top crypto exchanges for July 2025 and how Token Metrics helps you trade smarter with AI-powered insights, altcoin moonshots, and price predictions.
Token Metrics Team
6 min
Want Smarter Crypto Picks—Free?
See unbiased Token Metrics Ratings for BTC, ETH, and top alts.
Thank you! Your submission has been received!
Oops! Something went wrong while submitting the form.
No credit card | 1-click unsubscribe
Cryptocurrency adoption has surged in 2025, with Bitcoin reaching over $118,000 and Ethereum climbing above $3,000. Whether you’re a beginner or an advanced trader, choosing the right exchange or trading app is critical. But while exchanges handle your transactions, it’s tools like Token Metrics that give you the edge—using AI to deliver real-time analytics, trading signals, moonshot altcoin picks, and price predictions.
In this guide, we’ll cover the top exchanges and apps for July 2025, along with Token Metrics, the best platform for AI-powered crypto research and trading.
🔝 Top Crypto Platforms for July 2025
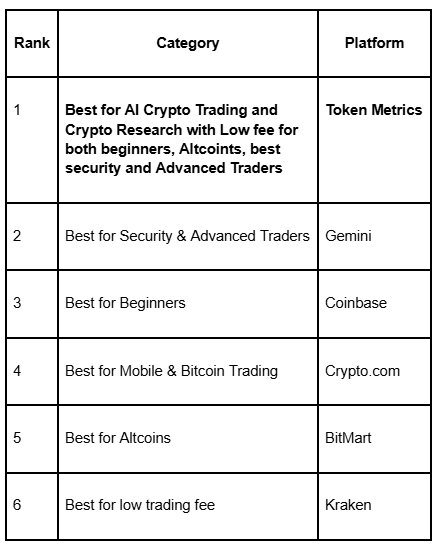
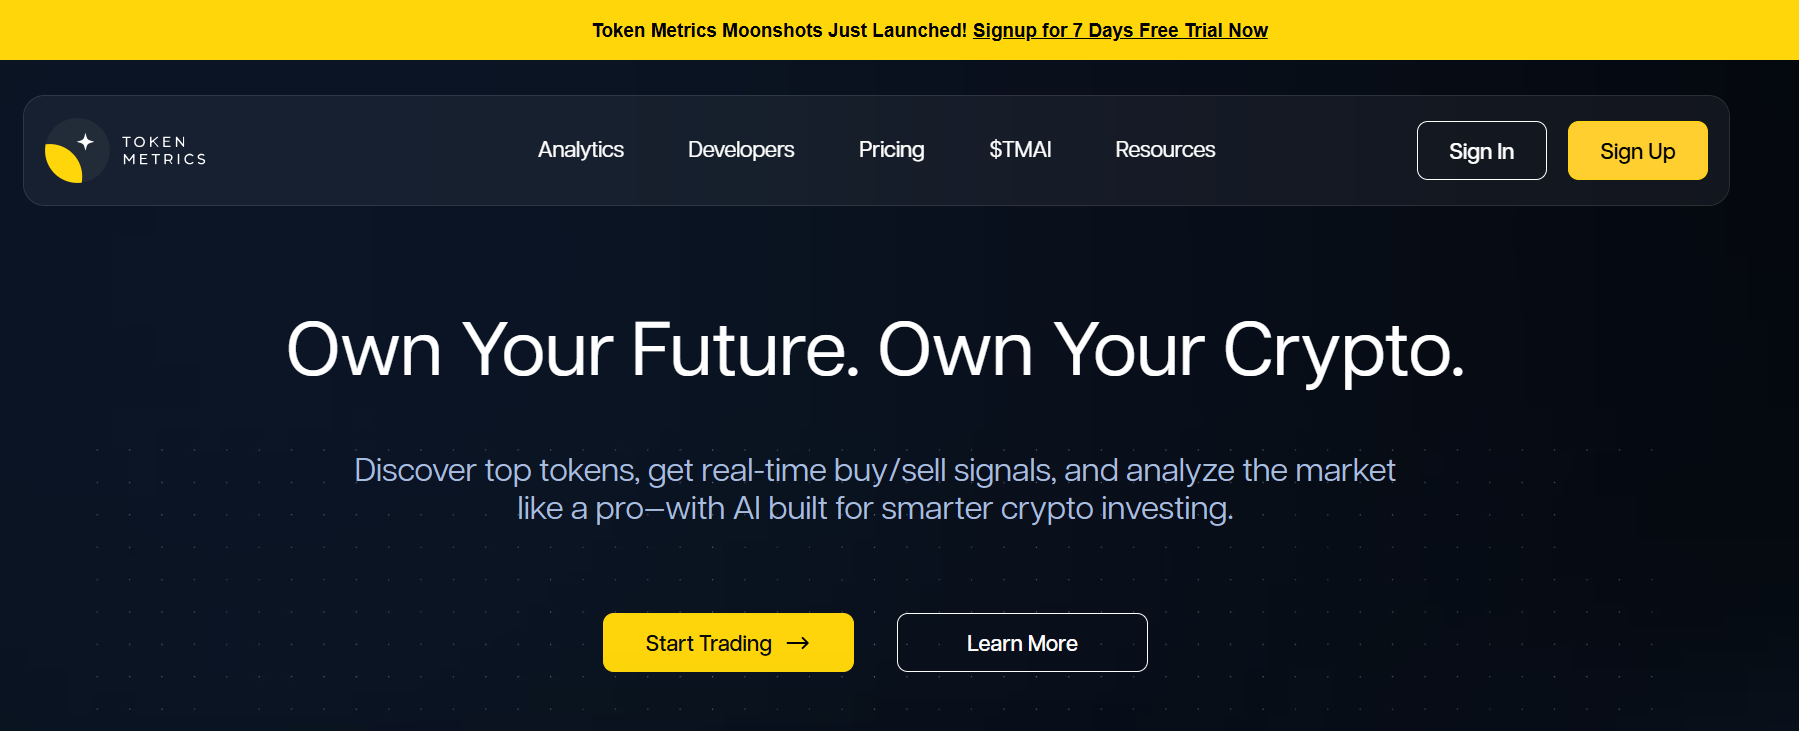
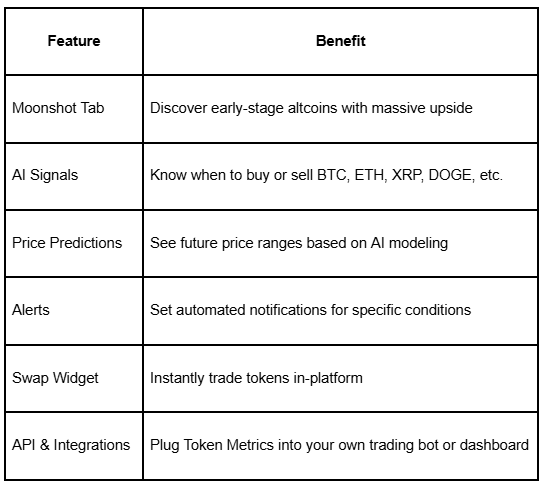
🧠 Token Metrics: Best AI Crypto Trading Platform
Token Metrics stands out not as an exchange, but as an AI-powered research, analytics, and trading platform. It gives retail and institutional investors data-driven insights to make smarter trades across any exchange.
Why Token Metrics is #1 for AI Crypto Trading:
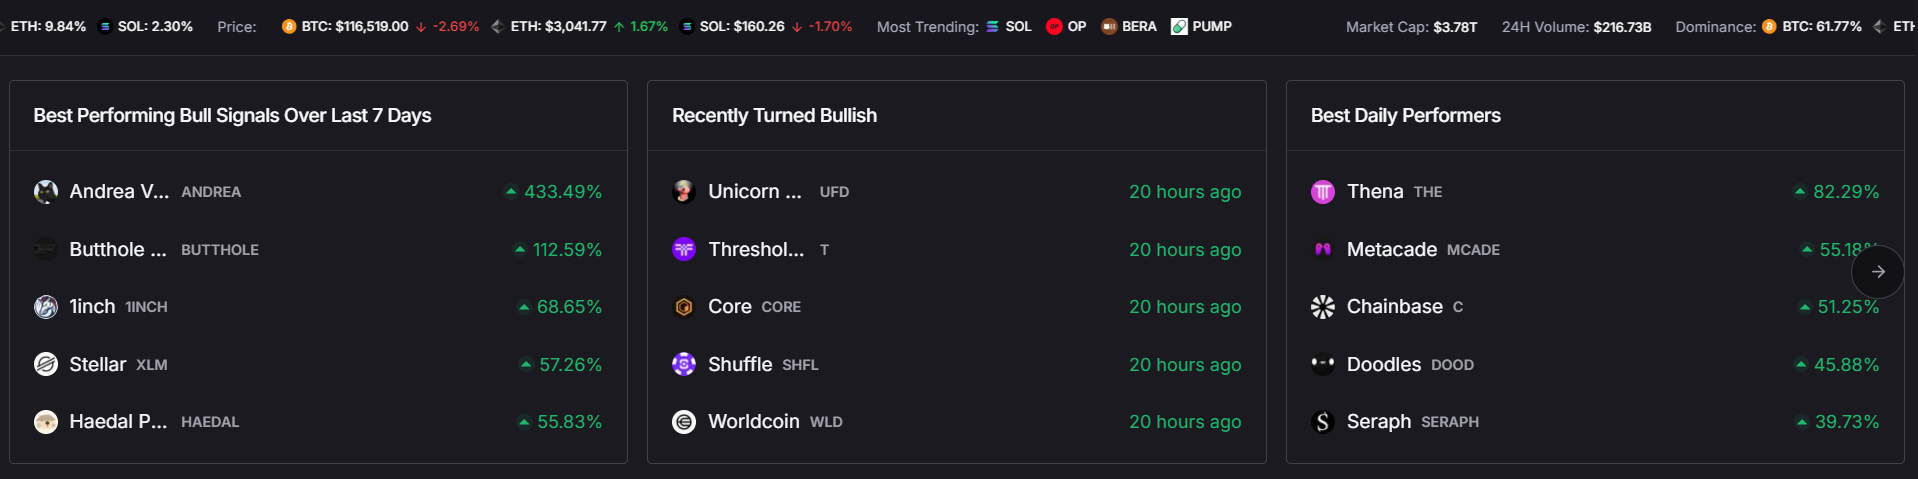
AI-Generated Buy/Sell Signals Token Metrics’ signals dashboard uses over 80 data points to issue bullish or bearish calls on top tokens. For example, the AI turned bullish on Bitcoin on June 28, just before it surged past $118,000.
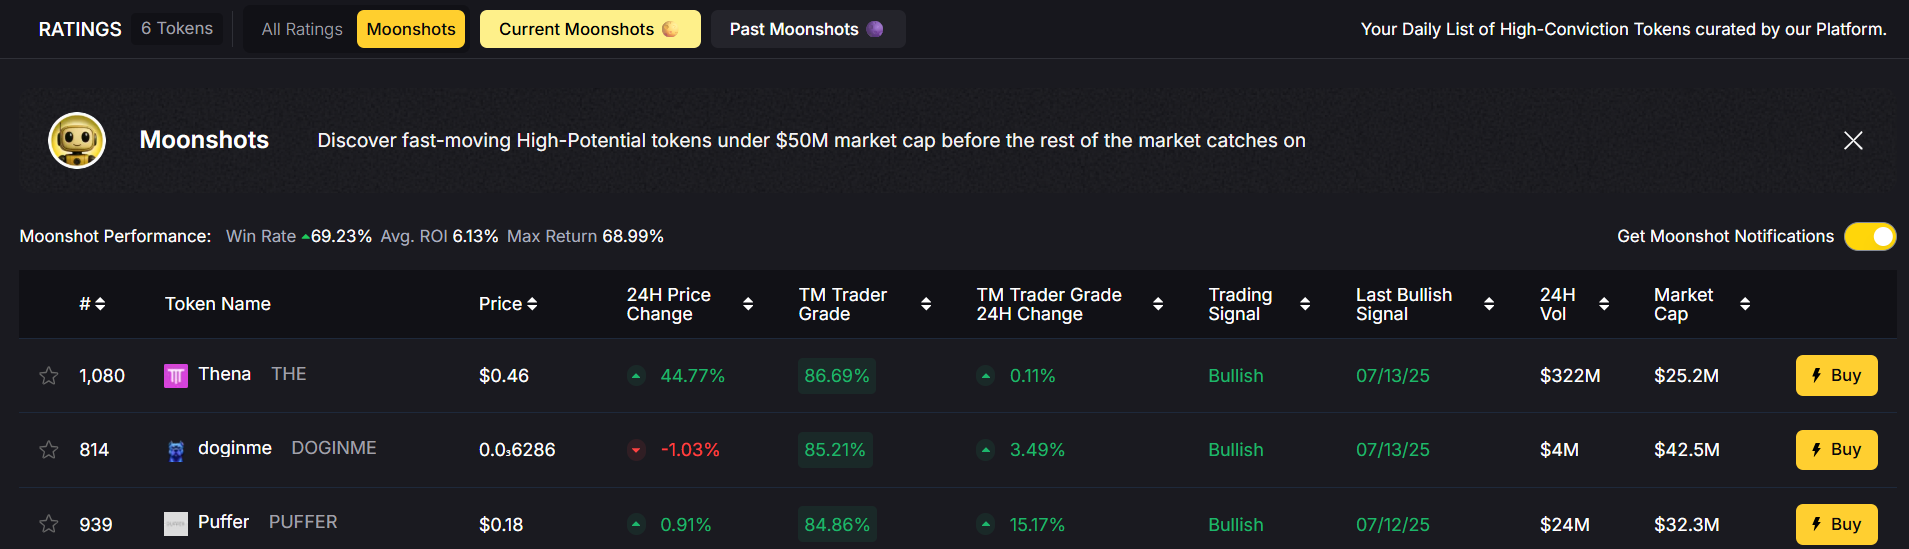
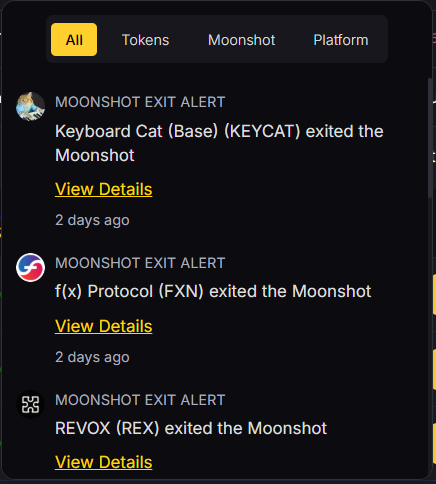
Moonshots for Early-Stage Altcoins The Moonshots tab identifies low-cap altcoins with 10x–100x potential based on momentum, AI scores, and liquidity—long before they hit mainstream exchanges.
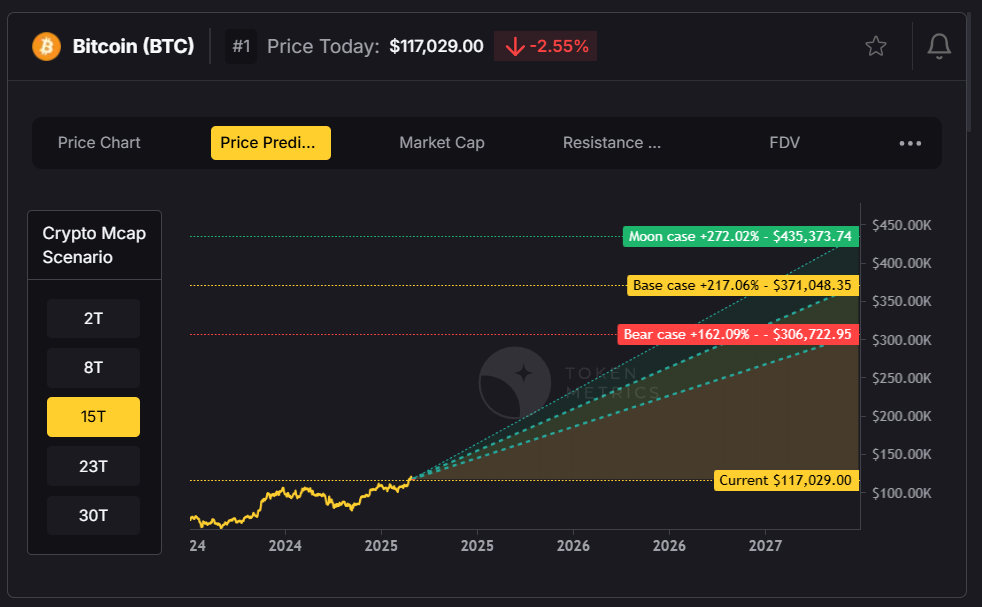
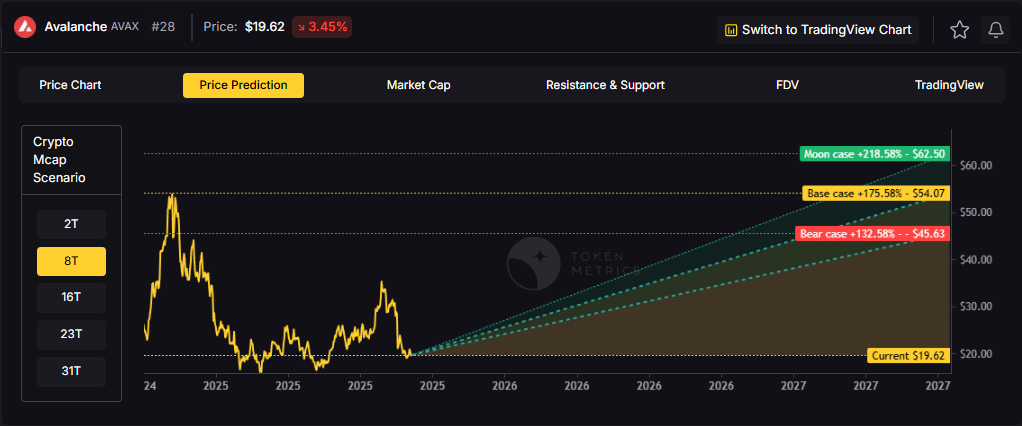
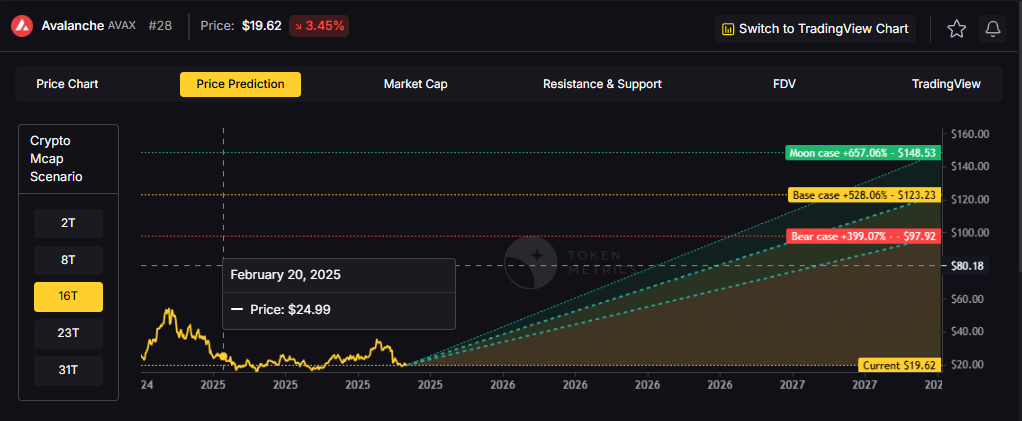
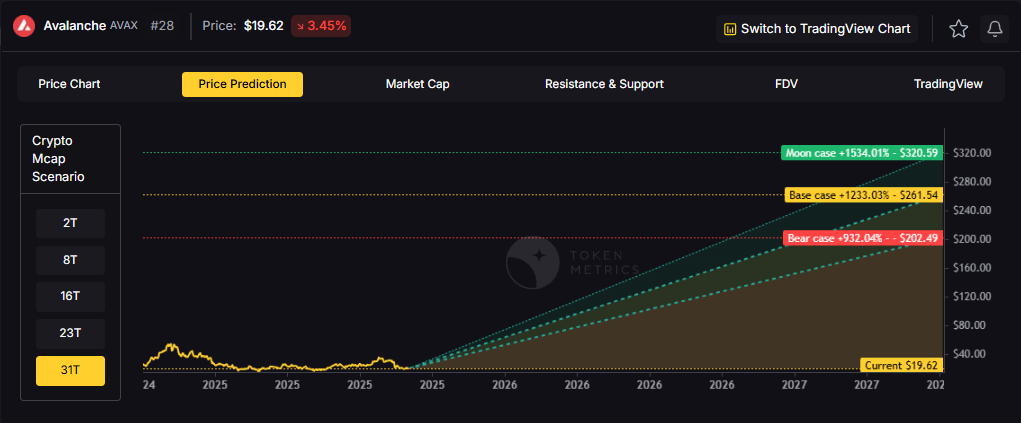
Price Forecasting Models Token Metrics predicts short-, medium-, and long-term prices for major tokens. Bitcoin’s 2026 forecast, for example, ranges between $150,000–$230,000, based on ETF flows, supply on exchanges, and macroeconomic signals.
Custom Alerts Users can set alerts based on price, trader grade, or AI signals, delivered instantly via Email, Telegram, SMS, or Slack.
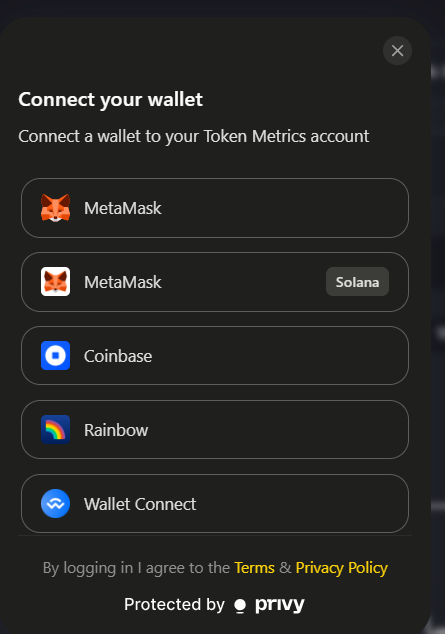
Integrated Swap Widget You can research, analyze, and buy tokens directly via Token Metrics’ swap widget—all in one dashboard.
Whether you’re trading on Kraken, Coinbase, or Binance, Token Metrics plugs into your strategy and helps you trade with confidence, using real-time AI insights.
Kraken is ideal for fee-sensitive traders. It’s available on web, mobile, desktop, and Kraken Pro. However, it's not available in all U.S. states and lacks FDIC or SIPC insurance.
🥈 Gemini – Best for Security & Experienced Traders
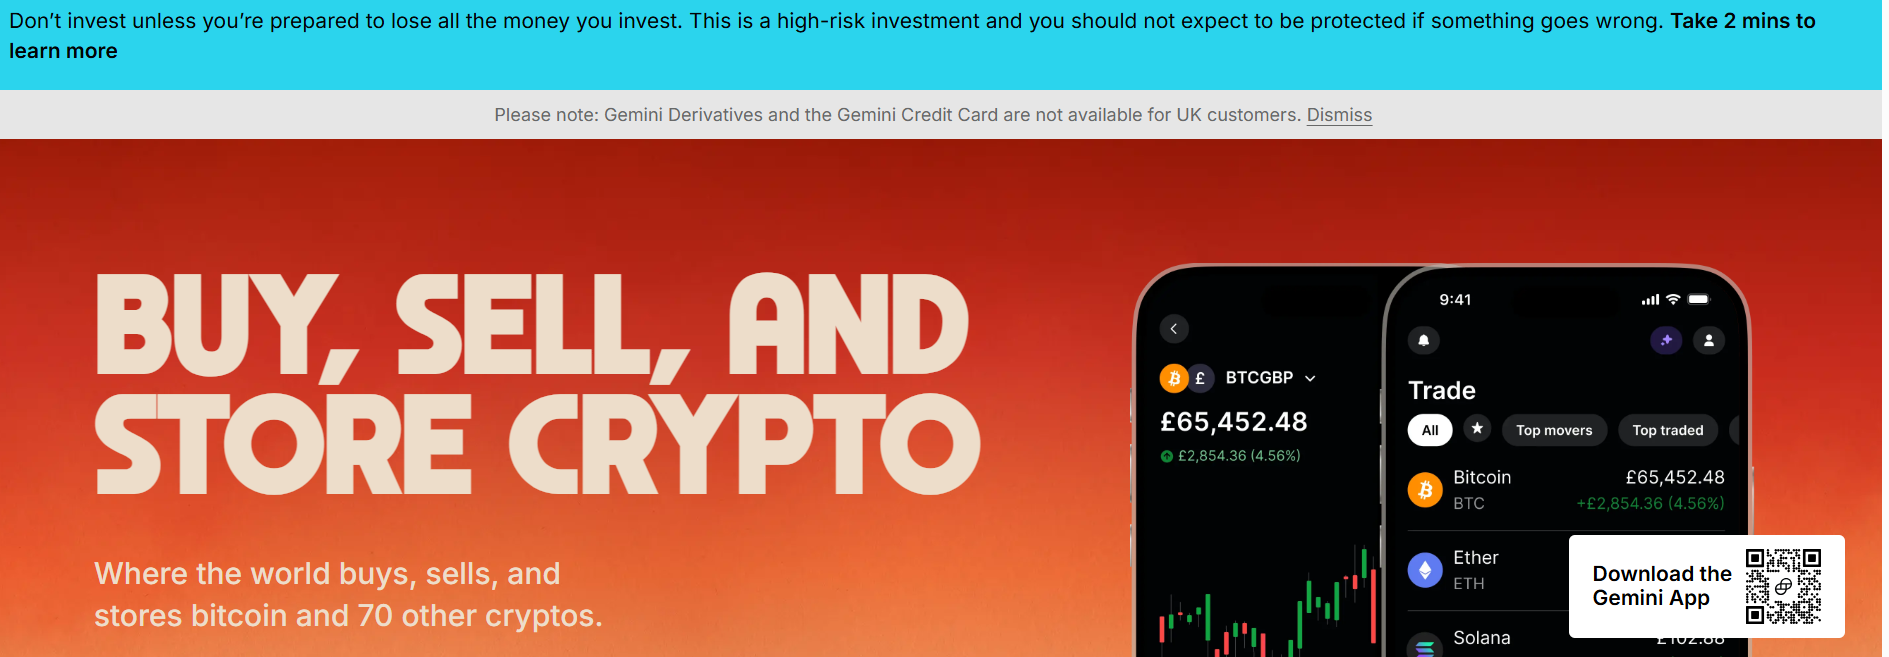
Maker Fees: 0.00%–0.20%
Taker Fees: 0.03%–0.40%
Minimum Deposit: $0
Crypto Offered: 70
Gemini is the most secure exchange in 2025, with FDIC insurance, crypto insurance, and advanced features through its ActiveTrader terminal. But it has a complex fee structure and limited assets.
🥉 Coinbase – Best for Beginners
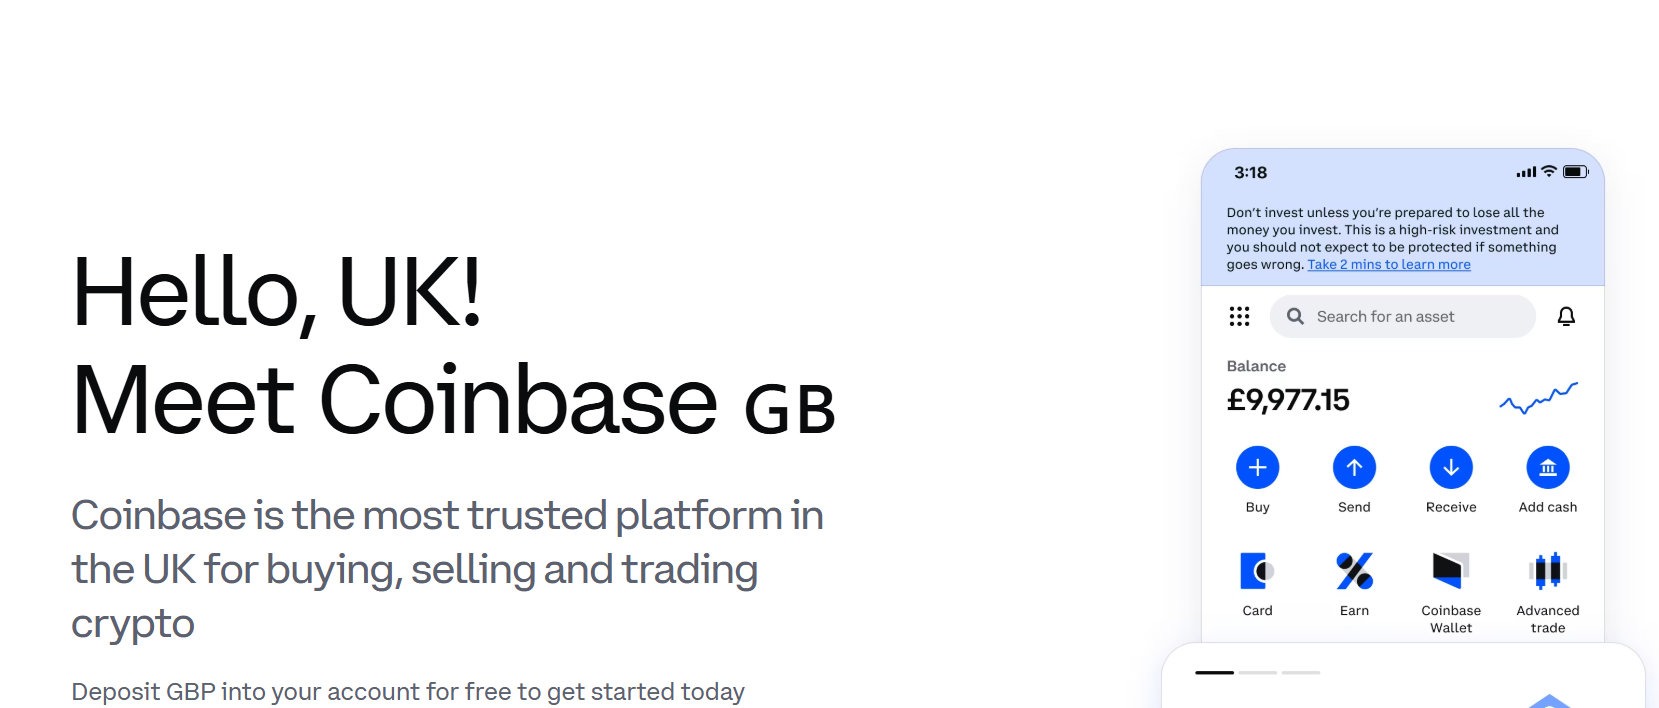
Maker Fees: 0.00%–0.40%
Taker Fees: 0.05%–0.60%
Minimum Deposit: $0
Crypto Offered: 240
Coinbase is ideal for newcomers with its clean UI, beginner-friendly tools, and educational content. It’s available in 172 countries, though advanced traders might want more features.
📱 Crypto.com – Best Mobile App & Bitcoin Trading
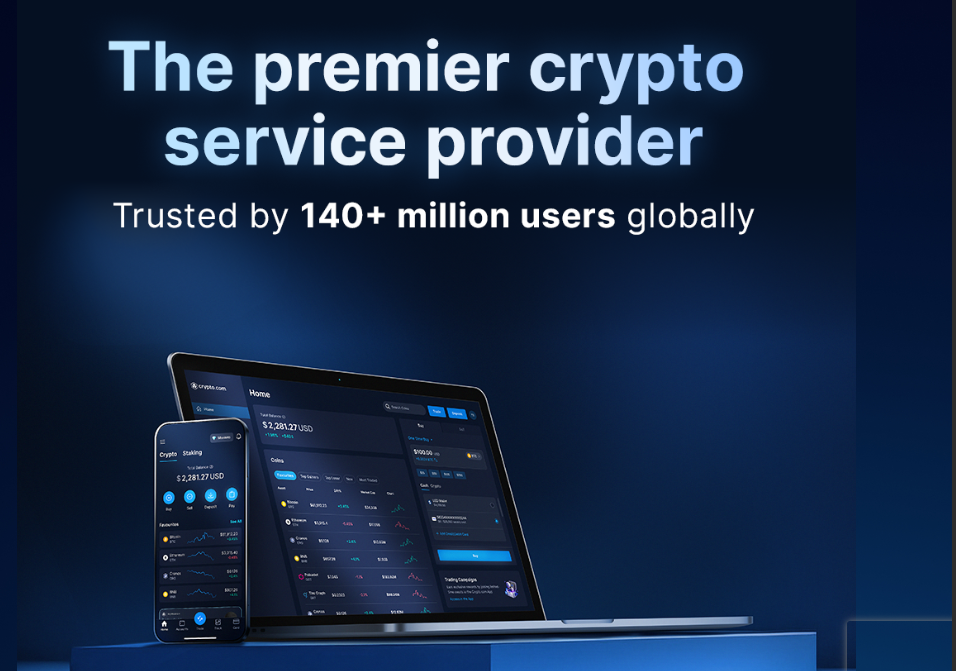
Maker Fees: 0.00%–0.25%
Taker Fees: 0.05%–0.50%
Minimum Deposit: $20
Crypto Offered: 417
With a sleek mobile app and support for Bitcoin options and futures, Crypto.com is perfect for on-the-go traders. However, it only supports a hot wallet and has limited global access.
BitMart is the best place to find rare altcoins. With copy trading and BitMart Academy, it’s useful for altcoin hunters. But its lack of transparency on security is a concern.
✅ Why Token Metrics Complements These Exchanges
⚠️ Reminder: Crypto Is Risky
Crypto markets are volatile and speculative. While these exchanges and tools can improve your strategy, always do your own research (DYOR) and consult professionals when investing.
Final Thoughts
If you want to trade crypto in July 2025, pair a high-quality exchange like Kraken or Coinbase with a research powerhouse like Token Metrics. Exchanges execute trades—but Token Metrics tells you what to trade, when to trade, and why.
Build Smarter Crypto Apps & AI Agents in Minutes, Not Months
Real-time prices, trading signals, and on-chain insights all from one powerful API.
Token Metrics: AI-powered crypto research and ratings platform. We help investors make smarter decisions with unbiased Token Metrics Ratings, on-chain analytics, and editor-curated “Top 10” guides. Our platform distills thousands of data points into clear scores, trends, and alerts you can act on.
See unbiased Token Metrics Ratings for BTC, ETH, and top alts.
Thank you! Your submission has been received!
Oops! Something went wrong while submitting the form.
No credit card | 1-click unsubscribe
Token Metrics Team
The Token Metrics Team comprises blockchain and cryptocurrency experts dedicated to providing accurate information and empowering investors. Through our blog, we aim to educate and inspire readers to navigate the world of cryptocurrencies confidently.
Token Metrics Team
The Token Metrics Team comprises blockchain and cryptocurrency experts dedicated to providing accurate information and empowering investors. Through our blog, we aim to educate and inspire readers to navigate the world of cryptocurrencies confidently.
Create Your Free Token Metrics Account
Access our Ratings Page for valuable token insights
Explore our Market Page for a comprehensive market overview
Stay in the loop with exclusive weekly Newsletters filled with insider tips and updates
Join our private Telegram group for exclusive community access
Avalanche Price Prediction: AVAX in the 2027 Landscape
The Layer 1 competitive landscape is consolidating as markets recognize that specialization matters more than being a generic alternative to Ethereum. Avalanche positions itself in this multi-chain world with specific technical and ecosystem advantages. Infrastructure maturity around custody, bridges, and developer tooling makes alternative L1s more accessible heading into 2026.
The price prediction scenario projections below map different market share outcomes for AVAX across varying total crypto market sizes. Base case price predictions assume Avalanche maintains current ecosystem momentum, while moon scenarios factor in accelerated adoption, and bear cases reflect increased competitive pressure.
Disclosure
Educational purposes only, not financial advice. Crypto is volatile, do your own research and manage risk.
How to read it: Each band blends cycle analogues and market-cap share math with TA guardrails. Base assumes steady adoption and neutral or positive macro. Moon layers in a liquidity boom. Bear assumes muted flows and tighter liquidity.
TM Agent baseline:
Token Metrics lead metric for Avalanche price prediction, cashtag $AVAX, is a TM Grade of 66.2%, which maps to Hold, and the trading signal is bearish, indicating short-term downward momentum. Concise long-term numeric price prediction view, 12-month horizon: Token Metrics' scenarios center around a price band roughly between $15 and $40, with a base case price target near $25. Market context: Bitcoin's direction remains the primary market driver, so broader crypto risk-on conditions are required for $AVAX to reach the higher price prediction scenario.
TM Agent gist: AVAX shows decent fundamentals with a Hold grade, short-term momentum is bearish, and a 12-month price prediction range clusters around $15 to $40 with a base near $25
Education only, not financial advice
Avalanche Price Prediction: Scenario Analysis
Token Metrics price prediction scenarios span four market cap tiers, each representing different levels of crypto market maturity and liquidity:
8T Market Cap Price Prediction:
At an eight trillion dollar total crypto market cap, AVAX price prediction projects to $45.63 in bear conditions, $54.07 in the base case, and $62.50 in bullish scenarios.
16T Market Cap Price Prediction:
Doubling the market to sixteen trillion expands the price prediction range to $97.92 (bear), $123.23 (base), and $148.53 (moon).
23T Market Cap Price Prediction:
At twenty-three trillion, the price forecast scenarios show $150.20, $192.38, and $234.56 respectively.
31T Market Cap Price Prediction:
In the maximum liquidity scenario of thirty-one trillion, AVAX price prediction could reach $202.49 (bear), $261.54 (base), or $320.59 (moon).
Each tier assumes progressively stronger market conditions, with the base case reflecting steady growth and the moon case requiring sustained bull market dynamics.
Why Consider the Indices with Top-100 Exposure
Avalanche represents one opportunity among hundreds in crypto markets. Token Metrics Indices bundle AVAX with top one hundred assets for systematic exposure to the strongest projects. Single tokens face idiosyncratic risks that diversified baskets mitigate.
Historical index performance demonstrates the value of systematic diversification versus concentrated positions.
Avalanche is a smart-contract platform known for high throughput, low latency, and a modular subnet architecture. It aims to support decentralized finance, gaming, and enterprise applications with fast finality and cost-efficient transactions.
AVAX is the native token used for fees, staking, and network security, and it powers activity across application subnets. The ecosystem positions Avalanche among leading Layer 1s competing for developer mindshare and user adoption.
Token Metrics AI Analysis for Price Prediction
Token Metrics AI provides comprehensive context on Avalanche's positioning and challenges that inform our price prediction models.
Vision: Avalanche aims to provide a highly scalable, secure, and decentralized platform for launching custom blockchains and decentralized applications. Its vision centers on enabling a global, open financial system and supporting a diverse ecosystem of interoperable blockchains.
Problem: Many blockchain networks face trade-offs between speed, security, and decentralization, often resulting in high fees and slow transaction times during peak demand. Avalanche addresses the need for a scalable and efficient infrastructure that can support widespread adoption of dApps and enterprise use cases without compromising on performance or security.
Solution: Avalanche uses a novel consensus mechanism that achieves rapid finality with low energy consumption, differentiating it from traditional Proof-of-Work systems. It employs a three-chain architecture—Exchange Chain (X-Chain), Platform Chain (P-Chain), and Contract Chain (C-Chain)—to separate functions like asset creation, staking, and smart contract execution, enhancing efficiency and scalability.
Market Analysis: Avalanche operates in the competitive Layer 1 blockchain space. It differentiates itself through its consensus protocol and support for subnet-based custom blockchains. Adoption is influenced by developer activity, partnerships, and integration with major DeFi protocols, with risks from technological shifts and regulatory developments.
Fundamental and Technology Snapshot from Token Metrics
Institutional and retail access expands with ETFs, listings, and integrations
Macro tailwinds from lower real rates and improving liquidity
Product or roadmap milestones such as upgrades, scaling, or partnerships
These factors could push AVAX toward higher price prediction targets
Risks That Skew Bearish for Price Prediction
Macro risk-off from tightening or liquidity shocks
Regulatory actions or infrastructure outages
Concentration in validator economics and competitive displacement
These factors could push AVAX toward lower price prediction scenarios
FAQs: Avalanche Price Prediction
Can AVAX reach $200 according to price predictions?
Based on the price prediction scenarios, AVAX could reach $200 in the 31T bear case at $202.49. The 31T tier also shows $261.54 in the base case price forecast and $320.59 in the moon case. Not financial advice.
Can AVAX 10x from current levels based on price predictions?
At a current price of $19.62, a 10x would reach $196.20. This falls within the 31T bear, base, and moon case price predictions, and the 23T moon case at $234.56. Bear in mind that 10x returns require substantial market cap expansion. Not financial advice.
Should I buy AVAX now or wait based on price predictions?
Timing depends on your risk tolerance and macro outlook. Current price of $19.62 sits below the 8T bear case price prediction at $45.63. Dollar-cost averaging may reduce timing risk. Not financial advice.
What is the 2027 Avalanche price prediction?
Based on Token Metrics analysis, the 2027 price prediction for Avalanche centers around $25 in the base case under current market conditions, with a range between $15 and $40 depending on market scenarios. Bullish price predictions range from $54.07 to $320.59 across different total crypto market cap environments.
What drives AVAX price predictions?
AVAX price predictions are driven by subnet adoption, DeFi ecosystem growth, developer activity, institutional partnerships, and overall Layer 1 competition. The strong fundamentals (91.63% grade) support long-term price potential, though short-term bearish signals suggest caution. Market-wide crypto conditions remain the primary driver for reaching upper price prediction targets.
Can AVAX reach $300 by 2027?
According to our price prediction models, AVAX could reach $300+ in the 31T moon case where it projects to $320.59. This price prediction outcome requires the total crypto market to reach 31 trillion and Avalanche to maintain strong competitive positioning with accelerated subnet adoption. Not financial advice.
Our team delivers scenario-driven price projections, in-depth grades, and actionable indices to empower smarter crypto investing—with both human and AI insights.
Hedera Price Prediction: Portfolio Context for HBAR in the 2027 Landscape
Layer 1 tokens like Hedera represent bets on specific blockchain architectures winning developer and user mindshare. HBAR carries both systematic crypto risk and unsystematic risk from Hedera's technical roadmap execution and ecosystem growth. Multi-chain thesis suggests diversifying across several L1s rather than concentrating in one, since predicting which chains will dominate remains difficult.
The price prediction projections below show how HBAR might perform under different market cap scenarios. While Hedera may have strong fundamentals, prudent portfolio construction balances L1 exposure across Ethereum, competing smart contract platforms, and Bitcoin to capture the sector without overexposure to any single chain's fate.
Disclosure
Educational purposes only, not financial advice. Crypto is volatile, do your own research and manage risk.
How to read this price prediction:
Each band blends cycle analogues and market-cap share math with TA guardrails. Base assumes steady adoption and neutral or positive macro. Moon layers in a liquidity boom. Bear assumes muted flows and tighter liquidity.
TM Agent baseline:
Token Metrics lead metric for Hedera price prediction, cashtag $HBAR, is a TM Grade of 61.8%, which maps to Hold, and the trading signal is bearish, indicating short-term downward momentum. This means Token Metrics views $HBAR as having reasonably solid fundamentals but limited conviction for strong outperformance in the near term.
A concise long-term numeric price prediction view for a 12-month horizon: Token Metrics scenarios center around a range of about $0.06 to $0.18, with a base case price target near $0.10, reflecting steady ecosystem growth, moderate adoption of Hedera services, and continued enterprise partnerships. Implication: if Bitcoin and broader crypto risk appetite improve, $HBAR could revisit the higher end of the price prediction range, while a risk-off market or slower-than-expected developer traction would keep it toward the lower bound.
TM Agent gist: bearish short term, range view with upside if crypto risk appetite improves.
Education only, not financial advice.
Hedera Price Prediction: Scenario Analysis
Token Metrics price prediction scenarios span four market cap tiers, each representing different levels of crypto market maturity and liquidity:
8T Market Cap Price Prediction:
At an 8 trillion dollar total crypto market cap, HBAR price prediction projects to $0.27 in bear conditions, $0.32 in the base case, and $0.37 in bullish scenarios.
16T Market Cap Price Prediction:
Doubling the market to 16 trillion expands the price prediction range to $0.42 (bear), $0.57 (base), and $0.72 (moon).
23T Market Cap Price Prediction:
At 23 trillion, the price forecast scenarios show $0.56, $0.82, and $1.07 respectively.
31T Market Cap Price Prediction:
In the maximum liquidity scenario of 31 trillion, HBAR price prediction could reach $0.71 (bear), $1.07 (base), or $1.42 (moon).
These price prediction ranges illustrate potential outcomes for concentrated HBAR positions, but investors should weigh whether single-asset exposure matches their risk tolerance or whether diversified strategies better suit their objectives.
The Case for Diversified Index Exposure
Professional investors across asset classes prefer diversified exposure over concentrated bets for good reason. Hedera faces numerous risks - technical vulnerabilities, competitive pressure, regulatory targeting, team execution failure - any of which could derail HBAR performance independent of broader market conditions. Token Metrics Indices spread this risk across one hundred tokens, ensuring no single failure destroys your crypto portfolio.
Diversification becomes especially critical in crypto given the sector's nascency and rapid evolution. Technologies and narratives that dominate today may be obsolete within years as the space matures. By holding HBAR exclusively, you're betting not only on crypto succeeding but on Hedera specifically remaining relevant. Index approaches hedge against picking the wrong horse while maintaining full crypto exposure.
Tax efficiency and rebalancing challenges also favor indices over managing concentrated positions. Token Metrics Indices handle portfolio construction, rebalancing, and position sizing systematically, eliminating the emotional and logistical burden of doing this manually with multiple tokens.
Hedera is a high-performance public ledger that emphasizes speed, low fees, and energy efficiency, positioning itself for enterprise and decentralized applications. It uses a unique Hashgraph consensus that enables fast finality and high throughput, paired with a council-governed model that targets real-world use cases like payments, tokenization, and decentralized identity.
HBAR is the native token used for fees, staking, and network security, and it supports smart contracts and decentralized file storage. Adoption draws from partnerships and integrations, though decentralization levels and reliance on institutional demand are often discussed in the community.
Token Metrics AI Analysis for Price Prediction
Token Metrics AI provides comprehensive context on Hedera's positioning and challenges that inform our price prediction models.
Vision: Hedera's vision is to provide a secure, fair, and scalable distributed ledger technology platform that supports decentralized applications and enterprise use cases globally. It emphasizes governed decentralization, aiming to combine the benefits of distributed systems with responsible oversight through its council-based governance model.
Problem: Many blockchain networks face trade-offs between scalability, security, and decentralization, often resulting in high transaction fees, slow processing times, or environmental concerns. Hedera aims to address these limitations by offering a system that supports high throughput and fast finality without sacrificing security or incurring significant energy costs, making it suitable for both enterprise and decentralized applications.
Solution: Hedera uses the Hashgraph consensus algorithm, a directed acyclic graph (DAG)-based approach that achieves asynchronous Byzantine fault tolerance, enabling fast, secure, and fair transaction processing. The network supports smart contracts, tokenization, and decentralized file storage, with HBAR serving as the native token for fees, staking, and network security. Its council-governed model aims to ensure stability and trust, particularly for institutional and enterprise users.
Market Analysis: Hedera operates in the Layer 1 blockchain space, competing with high-throughput platforms like Solana, Avalanche, and Algorand, while differentiating through its Hashgraph consensus and governed governance model. It targets enterprise adoption, focusing on use cases in supply chain, payments, and asset tokenization, which sets it apart from more community-driven or DeFi-centric networks. Adoption is influenced by strategic partnerships, developer engagement, and real-world integrations rather than speculative activity. Key risks include competition from established and emerging blockchains, regulatory scrutiny around governance tokens, and challenges in achieving broad decentralization.
Fundamental and Technology Snapshot from Token Metrics
Institutional and retail access expands with ETFs, listings, and integrations
Macro tailwinds from lower real rates and improving liquidity
Product or roadmap milestones such as upgrades, scaling, or partnerships
These factors could push HBAR toward higher price prediction targets
Risks That Skew Bearish for Price Prediction
Macro risk-off from tightening or liquidity shocks
Regulatory actions or infrastructure outages
Concentration in validator economics and competitive displacement
Protocol-specific execution risk and competitive pressure from alternatives
These factors could push HBAR toward lower price prediction scenarios
FAQs: Hedera Price Prediction
Can HBAR reach $1.00 according to price predictions?
Yes. Based on the price prediction scenarios, HBAR could reach $1.00 or above in the higher tiers. The 23T tier projects $1.07 in the moon case price forecast and the 31T tier projects $1.42 in the moon case. Achieving this price prediction requires broad market cap expansion and Hedera maintaining competitive position. Not financial advice.
What price could HBAR reach in the moon case price prediction?
Moon case price predictions range from $0.37 at 8T to $1.42 at 31T total crypto market cap. These price prediction scenarios assume maximum liquidity expansion and strong Hedera adoption. Diversified strategies aim to capture upside across multiple tokens rather than betting exclusively on any single moon scenario. Not financial advice.
What's the risk/reward profile for HBAR price prediction?
Risk and reward in our price prediction model span from $0.27 in the lowest bear case to $1.42 in the highest moon case. Downside risks include regulatory or infrastructure setbacks and competitive pressure, while upside drivers include improved liquidity and enterprise adoption. Concentrated positions amplify both tails, while diversified strategies smooth outcomes.
What is the 2027 Hedera price prediction?
Based on Token Metrics analysis, the 2027 price prediction for Hedera centers around $0.10 in the base case under current market conditions, with a range between $0.06 and $0.18 depending on market scenarios. Bullish price predictions range from $0.32 to $1.42 across different total crypto market cap environments.
What drives HBAR price predictions?
HBAR price predictions are driven by enterprise adoption of Hashgraph technology, institutional partnerships (Google Cloud, IBM, Boeing), council governance decisions, and competition from other Layer 1 platforms. The strong fundamentals (81.08% grade) support long-term price potential, though short-term bearish signals suggest caution. Enterprise use case development remains the primary driver for reaching upper price prediction targets.
Can HBAR reach $0.50 by 2027?
According to our price prediction models, HBAR could reach $0.50+ in multiple scenarios: the 16T base case ($0.57), 16T moon case ($0.72), and all higher market cap tiers. This price prediction outcome requires steady crypto market growth (16T+ total market cap) and Hedera maintaining strong enterprise partnerships. Not financial advice.
Educational purposes only, not financial advice. Crypto is volatile, concentration amplifies risk, and diversification is a fundamental principle of prudent portfolio construction. Do your own research and manage risk appropriately.
LEO Token Price Prediction Framework: Market Cap Scenarios
Exchange tokens derive value from trading volume and platform revenue, creating linkage between crypto market activity and LEO price action. LEO Token delivers utility through reduced trading fees and enhanced platform services on Bitfinex and iFinex across Ethereum and EOS. Token Metrics price prediction scenarios below model LEO outcomes across different total crypto market cap environments, providing investors with data-driven forecasts for strategic decision-making.
Disclosure
Educational purposes only, not financial advice. Crypto is volatile, do your own research and manage risk.
How to Read This LEO Price Prediction
Each band blends cycle analogues and market-cap share math with TA guardrails. Base assumes steady adoption and neutral or positive macro. Moon layers in a liquidity boom. Bear assumes muted flows and tighter liquidity.
TM Agent baseline: Token Metrics price prediction probabilities favor a modest range between about $5 and $15, with a base case around current levels near $9, conditional on exchange token utility remaining steady, and downside risk if centralized exchange macro pressure increases.
Scenario driven, outcomes hinge on total crypto market cap, higher liquidity and adoption lift the bands.
TM Agent gist: 12-month horizon favors $5 to $15 range with base case near $9, contingent on stable exchange utility.
Education only, not financial advice.
LEO Token Price Prediction Scenario Analysis
Token Metrics price prediction scenarios span four market cap tiers reflecting different crypto market maturity levels:
8T Market Cap - LEO Price Prediction:
At 8 trillion total crypto market cap, LEO price prediction projects to $11.35 in bear conditions, $12.92 in the base case, and $14.48 in bullish scenarios.
16T Market Cap - LEO Price Prediction:
At 16 trillion total crypto market cap, LEO price prediction projects to $14.82 in bear conditions, $19.51 in the base case, and $24.20 in bullish scenarios.
23T Market Cap - LEO Price Prediction:
At 23 trillion total crypto market cap, LEO price prediction projects to $18.28 in bear conditions, $26.10 in the base case, and $33.92 in bullish scenarios.
31T Market Cap - LEO Price Prediction:
At 31 trillion total crypto market cap, LEO price prediction projects to $21.74 in bear conditions, $32.69 in the base case, and $43.63 in bullish scenarios.
Each tier in our price prediction framework assumes progressively stronger market conditions, with base scenarios reflecting steady exchange growth and moon cases requiring sustained bull market dynamics.
What Is LEO Token?
LEO Token is the native utility token of the Bitfinex and iFinex ecosystem, designed to provide benefits like reduced trading fees, enhanced lending and borrowing terms, and access to exclusive features on the platform. It operates on both Ethereum (ERC-20) and EOS blockchains, offering flexibility for users.
The primary role of LEO is to serve as a utility token within the exchange ecosystem, enabling fee discounts, participation in token sales, and other platform-specific advantages. Common usage patterns include holding LEO to reduce trading costs and utilizing it for enhanced platform services, positioning it primarily within the exchange token sector.
Catalysts That Skew LEO Price Predictions Bullish
Institutional and retail access expands with ETFs, listings, and integrations
Macro tailwinds from lower real rates and improving liquidity
Product or roadmap milestones such as upgrades, scaling, or partnerships
Increased Bitfinex trading volume and platform adoption
Strategic token burns and buyback programs
Risks That Skew LEO Price Predictions Bearish
Macro risk-off from tightening or liquidity shocks
Regulatory actions targeting centralized exchanges or infrastructure outages
Concentration risk or competitive displacement from rival exchange tokens
Declining exchange market share or trading volume
Negative sentiment around centralized exchange tokens
LEO Token Price Prediction FAQs
What gives LEO value?
LEO accrues value through reduced trading fees and enhanced platform services within the Bitfinex and iFinex ecosystem. Demand drivers include exchange usage and access to platform features, while supply dynamics follow the token's exchange utility design. Value realization depends on platform activity and user adoption—key factors in our price prediction methodology.
What price could LEO reach in the moon case?
Our moon case price predictions range from $14.48 at 8T to $43.63 at 31T total crypto market cap. These scenarios require maximum market cap expansion and strong exchange activity. Not financial advice.
What is the LEO Token price prediction for 2025-2027?
Our comprehensive price prediction framework suggests LEO could trade between $5 and $43.63 depending on market conditions and total crypto market capitalization. The base case price prediction scenario clusters around $9 to $32.69 across different market cap environments over the next 12-24 months. Not financial advice.
Can LEO Token reach $20?
Yes. Based on our price prediction scenarios, LEO could reach $19.51 in the 16T base case and surpass $20 in higher market cap scenarios (23T and 31T tiers). The 23T base case projects $26.10, making $20 an achievable target under favorable market conditions. Not financial advice.
Can LEO Token reach $50?
LEO reaching $50 would exceed our current price prediction models' highest scenario of $43.63 (31T moon case). This would require extraordinary market conditions beyond the 31T total crypto market cap tier and exceptional Bitfinex platform growth. Not financial advice.
Is LEO Token a good investment based on price predictions?
LEO's price prediction is tied to Bitfinex exchange performance and utility value. The token offers fee discounts and platform benefits, with moderate growth potential in our base scenarios. However, exchange token valuations carry platform-specific risks. Always conduct your own research and consult financial advisors. Not financial advice.
How accurate are LEO Token price predictions?
Our LEO price predictions use scenario-based modeling across multiple market cap tiers, combining cycle analogues, market-cap share math, and technical analysis guardrails. While this methodology provides structured forecasts, cryptocurrency markets remain highly volatile and unpredictable. Use these price predictions as educational frameworks, not guarantees. Not financial advice.
Curious how these forecasts are made? Token Metrics delivers LEO on-chain grades, forecasts, and deep research on 6,000+ tokens. Instantly compare fundamentals, on-chain scores, and AI-powered predictions.
Disclosure
Educational purposes only, not financial advice. Crypto is volatile, do your own research and manage risk.
Why Use Token Metrics for LEO Price Predictions?
Data-driven forecasts: Scenario-based price prediction models across multiple market cap tiers
Comprehensive analysis: On-chain metrics, fundamental grades, and technical guardrails
AI-powered insights: Advanced algorithms analyze 6,000+ tokens for comparative analysis
Regular updates: Real-time price predictions and signals based on market conditions
Risk management: Multiple scenarios (bear, base, moon) for informed decision-making