Back to blog
Research

Best Custody Insurance Providers (2025)

Compare the top crypto custody insurance providers, coverage types, and capacity—then pick the right partner for your stack.
Sam Monac
7 min
Want Smarter Crypto Picks—Free?
See unbiased Token Metrics Ratings for BTC, ETH, and top alts.
Thank you! Your submission has been received!
Oops! Something went wrong while submitting the form.
 No credit card | 1-click unsubscribe

Why Custody Insurance Matters in September 2025

Institutions now hold billions in digital assets, and regulators expect professional risk transfer—not promises. Custody insurance providers bridge the gap by transferring losses from theft, key compromise, insider fraud, and other operational failures to regulated carriers and markets. In one line: custody insurance is a specialized policy that helps institutions recover financial losses tied to digital assets held in custody (cold, warm, or hot) when defined events occur. As spot ETF flows and bank re-entries accelerate, boards want auditable coverage, clear exclusions, and credible capacity. This guide highlights who actually writes, brokers, and structures meaningful digital-asset custody insurance in 2025, and how to pick among them. Secondary considerations include capacity, claims handling, supported custody models, and regional eligibility across Global, US, EU, and APAC.

How We Picked (Methodology & Scoring)

  • Scale/Liquidity (30%) — demonstrated capacity, panel depth (carriers/reinsurers/markets), and limits available for custody crime/specie.

  • Security & Underwriting Rigor (25%) — due diligence on key management, operational controls, audits, and loss prevention expectations.

  • Coverage Breadth (15%) — hot/warm/cold support, staking/slashing riders, social-engineering, wallet recovery, smart-contract add-ons.

  • Costs (15%) — indicative premiums/deductibles vs. limits; structure efficiency (excess, towers, programs).

  • UX (10%) — clarity of wordings, onboarding guidance, claims transparency.

  • Support (5%) — global service footprint, specialist teams (DART/crypto units), and education resources.

We prioritized official product/security pages, disclosures, and market directories; third-party datasets were used only for cross-checks. Last updated September 2025.

Top 10 Custody Insurance Providers in September 2025

1. Evertas — Best for Dedicated Crypto Crime & Custody Cover

Why Use It: Evertas is a specialty insurer focused on crypto, offering A-rated crime/specie programs tailored to cold, warm, and hot storage with practitioner-level key-management scrutiny. Their policies target the operational realities of custodians and platforms, not just generic cyber forms.
Best For: Qualified custodians, exchanges, trustees, prime brokers.
Notable Features:

  • Crime/specie coverage across storage tiers.
  • Crypto-native underwriting of private-key processes.
  • Lloyd’s-backed capacity with global reach. Consider If: You need a crypto-first insurer vs. a generalist broker.
    Alternatives: Marsh, Canopius.

Regions: Global.

2. Coincover — Best for Warranty-Backed Protection & Wallet Recovery

Why Use It: Coincover provides proactive fraud screening, disaster recovery for wallets, and warranty-backed protection that can sit alongside traditional insurance programs—useful for fintechs and custodians embedding safety into UX. Lloyd’s syndicates partnered with Coincover to launch wallet coverage initiatives. Best For: B2B platforms, fintechs, MPC vendors, exchanges seeking embedded protection.
Notable Features:

  • Real-time outbound transaction screening.
  • Wallet recovery and disaster-recovery tooling.
  • Warranty-backed protection that “makes it right” on covered failures. Consider If: You want prevention + recovery layered with traditional insurance.
    Alternatives: Evertas, Marsh.

Regions: Global.

3. Marsh (DART) — Best Global Broker for Building Towers

Why Use It: Marsh’s Digital Asset Risk Transfer team is a top broker for structuring capacity across crime/specie/D&O and connecting clients to specialist markets. They also advertise dedicated solutions for theft of digital assets held by institutions. Best For: Large exchanges, custodians, ETF service providers, banks.
Notable Features:

  • Specialist DART team and market access.
  • Program design across multiple lines (crime/specie/E&O).
  • Solutions aimed at institutional theft protection. Consider If: You need a broker to source multi-carrier, multi-region capacity.
    Alternatives: Aon, Lloyd’s Market.

Regions: Global.

4. Aon — Best for Custody Assessments + Crime/Specie Placement

Why Use It: Aon’s digital-asset practice brokers crime/specie, D&O, E&O, and cyber, and offers custody assessments and loss-scenario modeling—useful for underwriting readiness and board sign-off. Best For: Banks entering custody, prime brokers, tokenization platforms.
Notable Features:

  • Crime & specie for theft of digital assets.
  • Custody assessments and PML modeling.
  • Cyber/E&O overlays for staking and smart-contract exposure. Consider If: You want pre-underwriting hardening plus market reach.
    Alternatives: Marsh, Evertas.

Regions: Global.

5. Munich Re — Best for Reinsurance-Backed Crime & Staking Risk

Why Use It: As a top global reinsurer, Munich Re provides digital-asset crime policies designed for professional custodians and platforms, with coverage spanning external hacks, employee fraud, and certain third-party breaches—often supporting primary carriers. Best For: Carriers building programs; large platforms needing robust backing.
Notable Features:

  • Comprehensive crime policy for custodians and trading venues.
  • Options for staking and smart-contract risks.
  • Capacity and technical guidance at program level. Consider If: You’re assembling a tower requiring reinsurance strength.
    Alternatives: Lloyd’s Market, Canopius.

Regions: Global.

6. Lloyd’s Market — Best Marketplace to Source Specialist Syndicates

Why Use It: Lloyd’s is a global specialty market where syndicates (e.g., Atrium) have launched crypto wallet/custody solutions, often in partnership with firms like Coincover. Access via brokers to build bespoke custody crime/specie programs with flexible limits. Best For: Firms needing bespoke wording and multi-syndicate capacity.
Notable Features:

  • Marketplace access to expert underwriters.
  • Wallet/custody solutions pioneered by syndicates.
  • Adjustable limits and layered structures. Consider If: You use a broker (Marsh/Aon) to navigate syndicates.
    Alternatives: Munich Re (reinsurance), Canopius.

Regions: Global.

7. Canopius — Best Carrier for Cross-Class Custody (Crime/Specie/Extortion)

Why Use It: Canopius underwrites digital-asset custody coverage and has launched cross-class products (crime/specie/extortion). They’re also active in APAC via Lloyd’s Asia and have public case studies on large Asian capacity deployments. Best For: APAC custodians, global platforms seeking single-carrier leadership.
Notable Features:

  • Digital-asset custody product on Lloyd’s Asia.
  • Cross-class protection with extortion elements.
  • Demonstrated large committed capacity in Hong Kong. Consider If: You want a lead carrier with APAC presence.
    Alternatives: Lloyd’s Market, Evertas.

Regions: Global/APAC.

8. Relm Insurance — Best Specialty Carrier for Digital-Asset Businesses

Why Use It: Bermuda-based Relm focuses on emerging industries including digital assets, offering tailored specialty programs and partnering with web3 security firms. Useful for innovative custody models needing bespoke underwriting. Best For: Web3 platforms, custodians with non-standard architectures.
Notable Features:

  • Digital-asset specific coverage and insights.
  • Partnerships with cyber threat-intel providers.
  • Bermuda specialty flexibility for novel risks. Consider If: You need bespoke terms for unique custody stacks.
    Alternatives: Evertas, Canopius.

Regions: Global (Bermuda-domiciled).

9. Breach Insurance — Best for Exchange/Platform Embedded Coverage

Why Use It: Breach builds regulated crypto insurance products like Crypto Shield for platforms and investors, and offers institutional “Crypto Shield Pro” and platform-embedded options—useful for exchanges and custodians seeking retail-facing coverage. Best For: Exchanges, retail platforms, SMB crypto companies.
Notable Features:

  • Regulated products targeting custody at qualified venues.
  • Institutional policy options (Pro).
  • Wallet risk assessments to prep for underwriting. Consider If: You want customer-facing protection aligned to your stack.
    Alternatives: Coincover, Aon.

Regions: US/Global.

10. Chainproof — Best Add-On for Smart-Contract/Slashing Risks

Why Use It: While not a custody crime policy, Chainproof (incubated by Quantstamp; reinsured backing) offers regulated insurance for smart contracts and slashing—valuable as an adjunct when custodians support staking or programmatic flows tied to custody. Best For: Custodians/exchanges with staking, DeFi integrations, or on-chain workflows.
Notable Features:

  • Regulated smart-contract and slashing insurance.
  • Backing and provenance via Quantstamp ecosystem.
  • Bermuda regulatory progress noted in 2024-25. Consider If: You need to cover the on-chain leg alongside custody.
    Alternatives: Munich Re (staking), Marsh.

Regions: Global.

Decision Guide: Best By Use Case

  • Regulated U.S. programs & towers: Marsh, Aon, Lloyd’s Market.
  • Crypto-native underwriting: Evertas.
  • APAC leadership capacity: Canopius (Lloyd’s Asia).
  • Embedded protection/wallet recovery: Coincover.
  • Reinsurance strength for large towers: Munich Re.
  • Retail/platform-facing add-ons: Breach Insurance.
  • On-chain/Slashing riders: Chainproof.
  • Specialty/innovative risk placements: Relm Insurance.

How to Choose the Right Custody Insurance (Checklist)

  • Confirm eligible regions/regulators (US/EU/APAC) and your entity domicile.

  • Map storage tiers (cold/warm/hot/MPC) to coverage and sub-limits.

  • Validate wordings/exclusions (internal theft, collusion, social engineering, vendor breaches).

  • Align limits/deductibles with AUM, TVL, and worst-case loss scenarios.

  • Ask for claims playbooks and incident response timelines.

  • Review audits & controls (SOC 2, key ceremonies, disaster recovery).

  • Query reinsurance backing and panel stability.

  • Red flags: vague wordings; “cyber-only” policies for custody crime; no clarity on key compromise.

Use Token Metrics With Any Custody Insurance Provider

AI Ratings to vet venues and counterparties you work with.

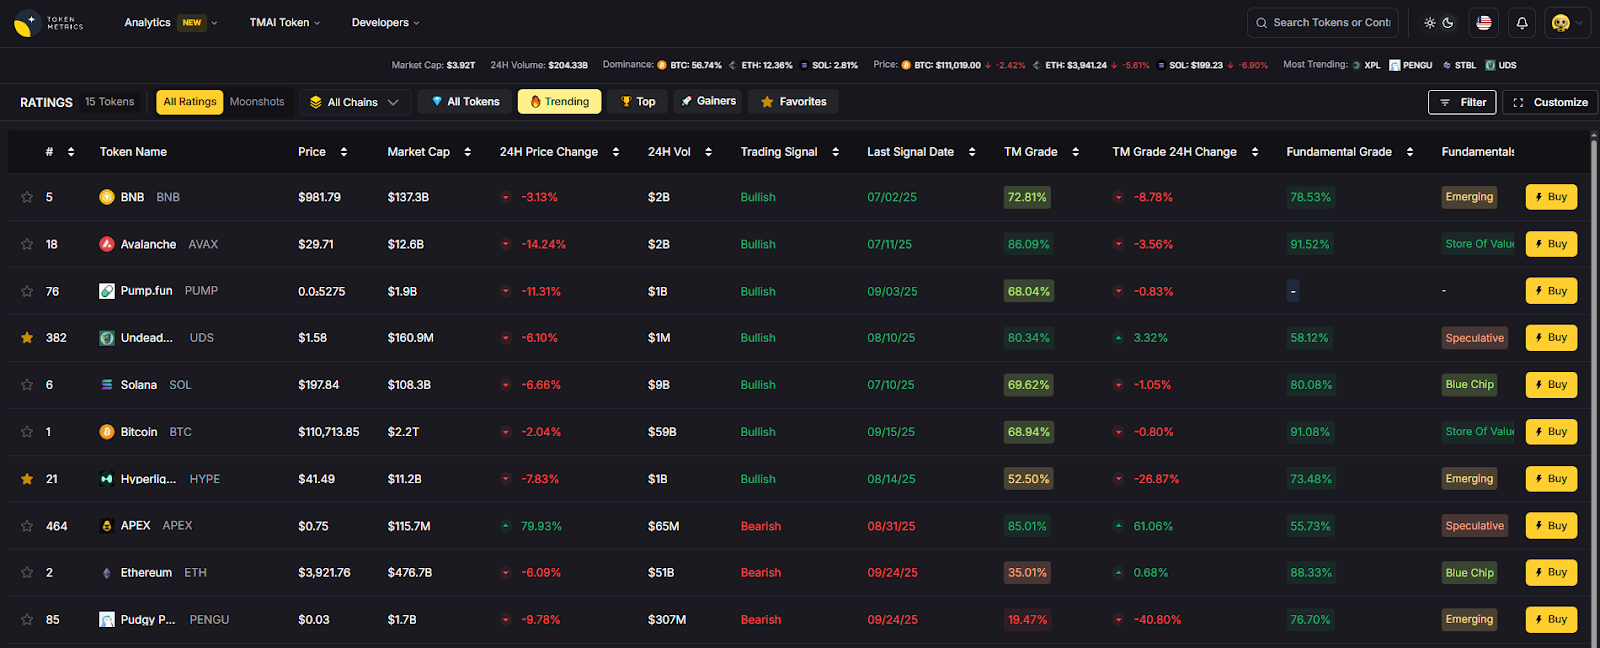
Narrative Detection to identify risk-on/off regimes impacting exposure.

Portfolio Optimization to size custody-related strategies.

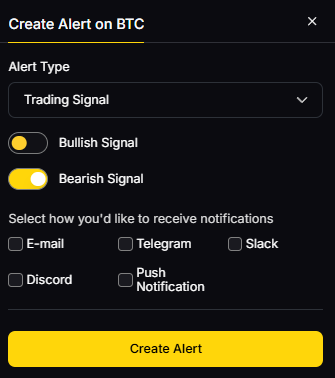
Alerts/Signals to monitor market stress that could correlate with loss events.
Workflow: Research → Select provider via broker → Bind coverage → Operate and monitor with Token Metrics alerts.

 Primary CTA: Start free trial

Security & Compliance Tips

  • Enforce MPC/hardware-isolated keys and dual-control operations.

  • Use 2FA, withdrawal whitelists, and policy controls across org accounts.

  • Keep KYC/AML and sanctions screening current for counterparties.

  • Practice RFQ segregation and least-privilege for ops staff.

  • Run tabletop exercises for incident/claims readiness.

This article is for research/education, not financial advice.

Beginner Mistakes to Avoid

  • Assuming cyber insurance = custody crime coverage.

  • Buying limits that don’t match hot-wallet exposure.

  • Skipping vendor-risk riders for sub-custodians and wallet providers.

  • Not documenting key ceremonies and access policies.

  • Waiting until after an incident to engage a broker/insurer.

FAQs

What does crypto custody insurance cover?
Typically theft, key compromise, insider fraud, and sometimes extortion or vendor breaches under defined conditions. Coverage varies widely by wording; verify hot/warm/cold definitions and exclusions.

Do I need both crime and specie?
Crime commonly addresses employee dishonesty and external theft; specie focuses on physical loss/damage to assets in secure storage. Many carriers blend elements for digital assets—ask how your program handles each.

Can staking be insured?
Yes—some reinsurers/insurers offer staking/slashing riders or separate policies; smart-contract risk often requires additional cover like Chainproof.

How much capacity is available?
Depends on controls and market appetite. Lloyd’s syndicates and reinsurers like Munich Re can support sizable towers when risk controls are strong.

How do I reduce premiums?
Improve key-management controls, segregate duties, minimize hot exposure, complete independent audits, and adopt continuous monitoring/fraud screening (e.g., Coincover-style prevention).

Are exchanges’ “insured” claims enough?
Not always—check if coverage is platform-wide, per-customer, warranty-backed, or contingent. Ask for wordings, limits, and who the named insureds are.

Conclusion + Related Reads

If you need a crypto-first insurer, start with Evertas. Building a global tower? Engage Marsh or Aon across the Lloyd’s Market and reinsurers like Munich Re. For APAC-localized capacity, consider Canopius; for embedded protection, weigh Coincover or Breach. Add Chainproof if staking/DeFi exposure touches custody workflows.

Related Reads:

  • Best Cryptocurrency Exchanges 2025

  • Top Derivatives Platforms 2025

  • Top Institutional Custody Providers 2025
Build Smarter Crypto Apps &
AI Agents in Minutes, Not Months
Real-time prices, trading signals, and on-chain insights all from one powerful API.
Grab a Free API Key
About Token Metrics
Token Metrics: AI-powered crypto research and ratings platform. We help investors make smarter decisions with unbiased Token Metrics Ratings, on-chain analytics, and editor-curated “Top 10” guides. Our platform distills thousands of data points into clear scores, trends, and alerts you can act on.
30 Employees
analysts, data scientists, and crypto engineers
Daily Briefings
concise market insights and “Top Picks”
Transparent & Compliant
Sponsored ≠ Ratings; research remains independent
Want Smarter Crypto Picks—Free?
See unbiased Token Metrics Ratings for BTC, ETH, and top alts.
Thank you! Your submission has been received!
Oops! Something went wrong while submitting the form.
 No credit card | 1-click unsubscribe
Token Metrics Team
Token Metrics Team

Recent Posts

Research

Cronos Price Prediction 2027: $0.10-$1.46 Target Analysis

Token Metrics Team
9 min read

Cronos Price Prediction: Portfolio Context for CRO in the 2027 Landscape

Layer 1 tokens like Cronos represent bets on specific blockchain architectures winning developer and user mindshare. CRO carries both systematic crypto risk and unsystematic risk from Cronos's technical roadmap execution and ecosystem growth. Multi-chain thesis suggests diversifying across several L1s rather than concentrating in one, since predicting which chains will dominate remains difficult.

The price prediction projections below show how CRO might perform under different market cap scenarios. While Cronos may have strong fundamentals, prudent portfolio construction balances L1 exposure across Ethereum, competing smart contract platforms, and Bitcoin to capture the sector without overexposure to any single chain's fate.

Disclosure

Educational purposes only, not financial advice. Crypto is volatile, do your own research and manage risk.

How to read this price prediction:

Each band blends cycle analogues and market-cap share math with TA guardrails. Base assumes steady adoption and neutral or positive macro. Moon layers in a liquidity boom. Bear assumes muted flows and tighter liquidity.

TM Agent baseline:

Token Metrics price prediction scenarios center roughly between $0.03 and $0.28, with a base case price target near $0.10, assuming steady ecosystem growth, continued cross-chain demand, and no major security incidents.

Live details: Token Details 

The Case for Diversified Index Exposure

Portfolio theory teaches that diversification is the only free lunch in investing. CRO concentration violates this principle by tying your crypto returns to one protocol's fate. Token Metrics Indices blend Cronos with the top one hundred tokens, providing broad exposure to crypto's growth while smoothing volatility through cross-asset diversification. This approach captures market-wide tailwinds without overweighting any single point of failure.

Systematic rebalancing within index strategies creates an additional return source that concentrated positions lack. As some tokens outperform and others lag, regular rebalancing mechanically sells winners and buys laggards, exploiting mean reversion and volatility. Single-token holders miss this rebalancing alpha and often watch concentrated gains evaporate during corrections while index strategies preserve more gains through automated profit-taking.

Beyond returns, diversified indices improve the investor experience by reducing emotional decision-making. Concentrated CRO positions subject you to severe drawdowns that trigger panic selling at bottoms. Indices smooth the ride through natural diversification, making it easier to maintain exposure through full market cycles.

Get early access

What Is Cronos?

Cronos is an EVM-compatible blockchain built to support decentralized applications with high throughput and low transaction costs. The network is designed to bridge the gap between crypto and traditional finance, offering interoperability with Ethereum and Cosmos ecosystems. Its focus on scalability and developer-friendly infrastructure aims to attract DeFi, NFT, and gaming projects.

CRO serves as the native utility token of the Cronos ecosystem, used for transaction fees, staking, and governance. It enables users to participate in network security, pay for smart contract execution, and access services within the Cronos DeFi ecosystem. Common usage patterns include staking for rewards, providing liquidity in DeFi protocols, and facilitating cross-chain transfers.

Key Takeaways for CRO Price Prediction

  • Scenario driven: price prediction outcomes hinge on total crypto market cap; higher liquidity and adoption lift the price targets
  • Single-asset concentration amplifies both upside and downside versus diversified approaches
  • Fundamentals: Fundamental Grade 72.71% (Community 55%, Tokenomics 60%, Exchange 100%, VC N/A, DeFi Scanner 83%)
  • Technology: Technology Grade 81.41% (Activity 64%, Repository 74%, Collaboration 82%, Security N/A, DeFi Scanner 83%)
  • TM Agent gist: Base price prediction near $0.10 amid steady growth
  • Education only, not financial advice

Cronos Price Prediction: Scenario Analysis

8T Market Cap Price Prediction:

At an 8 trillion dollar total crypto market cap, CRO price prediction projects to $0.14 in bear conditions, $0.29 in the base case, and $0.34 in bullish scenarios.

16T Market Cap Price Prediction:

Doubling the market to 16 trillion expands the price prediction range to $0.43 (bear), $0.57 (base), and $0.71 (moon).

23T Market Cap Price Prediction:

At 23 trillion, the price forecast scenarios show $0.62, $0.85, and $1.09 respectively.

31T Market Cap Price Prediction:

In the maximum liquidity scenario of 31 trillion, CRO price prediction could reach $0.81 (bear), $1.13 (base), or $1.46 (moon).


These price prediction ranges illustrate potential outcomes for concentrated CRO positions, but investors should weigh whether single-asset exposure matches their risk tolerance or whether diversified strategies better suit their objectives.

Fundamental and Technology Snapshot from Token Metrics

Fundamental Grade: 72.71% (Community 55%, Tokenomics 60%, Exchange 100%, VC N/A, DeFi Scanner 83%).


Technology Grade: 81.41% (Activity 64%, Repository 74%, Collaboration 82%, Security N/A, DeFi Scanner 83%).


Catalysts That Skew Bullish for Price Prediction

  • Institutional and retail access expands with ETFs, listings, and integrations
  • Macro tailwinds from lower real rates and improving liquidity
  • Product or roadmap milestones such as upgrades, scaling, or partnerships
  • These factors could push CRO toward higher price prediction targets

Risks That Skew Bearish for Price Prediction

  • Macro risk-off from tightening or liquidity shocks
  • Regulatory actions or infrastructure outages
  • Concentration in validator economics and competitive displacement
  • Protocol-specific execution risk and competitive pressure from alternatives
  • These factors could push CRO toward lower price prediction scenarios

FAQs: Cronos Price Prediction

Can CRO reach $1 according to price predictions?

Based on the price prediction scenarios, CRO could reach $1 in the 23T moon case where it projects to $1.09, and in the 31T scenarios where the base case is $1.13 and the moon case is $1.46. These price prediction outcomes require both broad market cap expansion and Cronos maintaining competitive position. Not financial advice.

What's the risk/reward profile for CRO price prediction?

Risk/reward in our price prediction model spans from $0.14 in the lowest bear case to $1.46 in the highest moon case. Downside risks include regulatory or infrastructure shocks and competitive displacement, while upside drivers include liquidity expansion and roadmap execution. Concentrated positions amplify both tails, while diversified strategies smooth outcomes.

What gives CRO value and impacts price predictions?

CRO accrues value through transaction fees, staking, and governance utility across the Cronos ecosystem. Demand drivers include DeFi activity, cross-chain usage, and network services. While these fundamentals matter for price predictions, diversified portfolios capture value accrual across multiple tokens rather than betting on one protocol's success.

What is the 2027 Cronos price prediction?

Based on Token Metrics analysis, the 2027 price prediction for Cronos centers around $0.10 in the base case, with potential for higher targets ($0.57-$1.13) in bullish scenarios if the total crypto market expands significantly. Moon case price predictions range up to $1.46 at maximum liquidity.

Next Steps

Disclosure
Educational purposes only, not financial advice. Crypto is volatile, concentration amplifies risk, and diversification is a fundamental principle of prudent portfolio construction. Do your own research and manage risk appropriately.

Research

Shiba Inu Price Prediction 2027: SHIB Forecast & Risk Warning

Token Metrics Team
6 min read

Shiba Inu Price Prediction: Understanding SHIB's Speculative Nature

Shiba Inu operates as a community-driven meme token where price action stems primarily from social sentiment, attention cycles, and speculative trading rather than fundamental value drivers. SHIB exhibits extreme volatility with no defensive characteristics or revenue-generating mechanisms typical of utility tokens. Token Metrics price prediction scenarios below provide technical price forecasts across different market cap environments, though meme tokens correlate more strongly with viral trends and community engagement than systematic market cap models. Positions in SHIB should be sized as high-risk speculative bets with potential for total loss.


Disclosure

Educational purposes only, not financial advice. Crypto is volatile, do your own research and manage risk.

How to read this price prediction:

Each band blends cycle analogues and market-cap share math with TA guardrails. Base assumes steady adoption and neutral or positive macro. Moon layers in a liquidity boom. Bear assumes muted flows and tighter liquidity. For meme tokens, actual price prediction outcomes depend heavily on social trends and community momentum beyond what market cap models capture.

TM Agent baseline:

Token Metrics TM Grade is 24.1%, Sell, with a bearish trading signal. The concise 12‑month numeric price prediction view centers between $0.000005 and $0.000035, with a base case price target near $0.000012.

TM Agent numeric view: scenarios center roughly between $0.000005 and $0.000035, with a base case near $0.000012.

Live details: Token Details 

Key Takeaways for SHIB Price Prediction

  • Highly speculative asset driven by sentiment and attention rather than fundamentals
  • Scenario driven: price prediction outcomes hinge on total crypto market cap and viral momentum
  • Extreme volatility characteristic - SHIB can experience double-digit percentage moves daily
  • TM Agent gist: Bearish short term, price prediction range $0.000005–$0.000035
  • Entertainment risk only, not financial advice

Shiba Inu Price Prediction: Scenario Analysis

Token Metrics price prediction scenarios provide technical price bands across market cap tiers:

8T Market Cap Price Prediction:

At 8 trillion total crypto market cap, SHIB price prediction projects to $0.041998 (bear), $0.042366 (base), and $0.042734 (moon).

16T Market Cap Price Prediction:

At 16 trillion total crypto market cap, SHIB price forecast projects to $0.043973 (bear), $0.045077 (base), and $0.046182 (moon).

23T Market Cap Price Prediction:

At 23 trillion total crypto market cap, SHIB price prediction projects to $0.045948 (bear), $0.047789 (base), and $0.049629 (moon).

  31T Market Cap Price Prediction:

At 31 trillion total crypto market cap, SHIB price prediction projects to $0.047923 (bear), $0.051050 (base), and $0.051307 (moon).

 These technical price prediction ranges assume meme tokens maintain market cap share proportional to overall crypto growth. Actual outcomes for speculative tokens typically exhibit higher variance and stronger correlation to social trends than these price prediction models predict.

What Is Shiba Inu?

Shiba Inu is a meme-born crypto project that centers on community and speculative culture. Unlike utility tokens with specific use cases, SHIB operates primarily as a speculative asset and community symbol. The project focuses on community engagement and entertainment value.

SHIB has demonstrated viral moments and community loyalty within the broader meme token category. The token trades on community sentiment and attention cycles more than fundamentals. Market performance depends heavily on social media attention and broader meme coin cycles.

Risks That Skew Bearish for Price Prediction

  • Extreme volatility from pure sentiment-driven price action with no fundamental support
  • Attention cycles shift rapidly, leaving early viral tokens abandoned as new memes emerge
  • Liquidity can evaporate quickly during downturns, creating severe slippage and exit difficulty
  • Regulatory scrutiny may target meme tokens as securities or gambling instruments
  • Macro risk-off environments hit speculative assets hardest, with meme coins showing largest drawdowns
  • Community fragmentation or developer abandonment can eliminate remaining narrative support
  • These factors could push SHIB price predictions toward the lower bear scenarios

Make Your Next Move with Token Metrics

Token Metrics provides technical analysis, scenario math, price prediction models, and rigorous risk evaluation for hundreds of crypto tokens. Want to dig deeper? Explore our powerful AI-powered ratings and scenario tools here.

FAQs: Shiba Inu Price Prediction

Will SHIB 10x from here according to price predictions?

At current price of $0.041027, a 10x reaches $0.41027. This level does not appear in any of the listed bear, base, or moon price prediction scenarios across 8T, 16T, 23T, or 31T tiers. Meme tokens can 10x rapidly during viral moments but can also lose 90%+ just as quickly. Position sizing for potential total loss is critical. Not financial advice.

What are the biggest risks to SHIB price predictions?

Primary risks include attention shifting to newer memes, community fragmentation, developer abandonment, regulatory crackdowns, and liquidity collapse during downturns. Unlike utility tokens with defensive characteristics, SHIB has zero fundamental floor. Price can approach zero if community interest disappears. Total loss is a realistic outcome that price prediction models cannot fully account for. Not financial advice.

What is the 2027 Shiba Inu price prediction?

Based on Token Metrics analysis, the 2027 price prediction for SHIB centers around $0.000012 in the base case under current market conditions. However, meme token price predictions are highly unreliable due to extreme dependence on social trends, viral cycles, and community sentiment that can change rapidly. These technical price prediction ranges should be viewed with extreme caution.

Can SHIB reach $0.01 according to price predictions?

Based on the price prediction scenarios across all market cap tiers (8T-31T), SHIB projections range from $0.041998 to $0.051307. While these technical price predictions show SHIB trading above $0.04, the extreme volatility and sentiment-driven nature of meme tokens means actual outcomes can vary dramatically from model projections. Not financial advice.


Next Steps

Track live data: Token Details

• Consider fundamental crypto assets with utility and defensive characteristics rather than pure speculation.

Disclosure

Educational purposes only, not financial advice. SHIB is a highly speculative asset with extreme volatility and high risk of total loss. Meme tokens operate as entertainment and gambling instruments rather than investments. Only allocate capital you can afford to lose entirely. Do your own research and manage risk appropriately.

Research

WhiteBIT Coin Price Prediction 2028: $40-$272 Target Analysis

Token Metrics Team
7 min read

WhiteBIT Coin Price Prediction: Portfolio Context for WBT in the 2028 Landscape

Exchange tokens like WhiteBIT Coin offer leveraged exposure to overall market activity, creating concentration risk around a single platform's success. While WBT can deliver outsized returns during bull markets with high trading volumes, platform-specific risks like regulatory action, security breaches, or competitive displacement amplify downside exposure. Portfolio theory suggests balancing such concentrated bets with broader sector exposure.

The price prediction scenarios below show how WBT might perform across different crypto market cap environments. Rather than betting entirely on WhiteBIT Coin's exchange succeeding, diversified strategies blend exchange tokens with L1s, DeFi protocols, and infrastructure plays to capture crypto market growth while mitigating single-platform risk.

The Case for Diversified Index Exposure

Portfolio theory teaches that diversification is the only free lunch in investing. WBT concentration violates this principle by tying your crypto returns to one protocol's fate. Token Metrics Indices blend WhiteBIT Coin with the top one hundred tokens, providing broad exposure to crypto's growth while smoothing volatility through cross-asset diversification. This approach captures market-wide tailwinds without overweighting any single point of failure.

Systematic rebalancing within index strategies creates an additional return source that concentrated positions lack. As some tokens outperform and others lag, regular rebalancing mechanically sells winners and buys laggards, exploiting mean reversion and volatility. Single-token holders miss this rebalancing alpha and often watch concentrated gains evaporate during corrections while index strategies preserve more gains through automated profit-taking.

Beyond returns, diversified indices improve the investor experience by reducing emotional decision-making. Concentrated WBT positions subject you to severe drawdowns that trigger panic selling at bottoms. Indices smooth the ride through natural diversification, making it easier to maintain exposure through full market cycles.

Get Early Acces


Disclosure

Educational purposes only, not financial advice. Crypto is volatile, do your own research and manage risk.

How to read this price prediction:

Each band blends cycle analogues and market-cap share math with TA guardrails. Base assumes steady adoption and neutral or positive macro. Moon layers in a liquidity boom. Bear assumes muted flows and tighter liquidity.

TM Agent baseline:

Token Metrics long term price prediction view for WhiteBIT Coin, cashtag $WBT. Lead metric first, Token Metrics TM Grade is 52.5%, Hold, and the trading signal is bearish, indicating short-term downward momentum. Concise 12-month numeric price prediction view: Token Metrics scenarios center roughly between $10 and $85, with a base case price target near $40.

Live details: Token Details

Key Takeaways for WBT Price Prediction

  • Scenario driven: price prediction outcomes hinge on total crypto market cap; higher liquidity and adoption lift the price bands
  • Single-asset concentration amplifies both upside and downside versus diversified approaches
  • Fundamentals: Fundamental Grade 52.35% (Community 82%, Tokenomics 60%, Exchange 50%, VC —, DeFi Scanner N/A)
  • TM Agent gist: Bearish momentum, 12-month price prediction range $10 to $85
  • Education only, not financial advice

WhiteBIT Coin Price Prediction: Scenario Analysis

Token Metrics price prediction scenarios span four market cap tiers, each representing different levels of crypto market maturity and liquidity:

8T Market Cap Price Prediction:

At an 8 trillion dollar total crypto market cap, WBT price prediction projects to $54.50 in bear conditions, $64.88 in the base case, and $75.26 in bullish scenarios.

16T Market Cap Price Prediction:

Doubling the market to 16 trillion expands the price prediction range to $78.61 (bear), $109.75 (base), and $140.89 (moon).

23T Market Cap Price Prediction:

At 23 trillion, the price forecast scenarios show $102.71, $154.61, and $206.51 respectively.

31T Market Cap Price Prediction:

In the maximum liquidity scenario of 31 trillion, WBT price prediction could reach $126.81 (bear), $199.47 (base), or $272.13 (moon).


These price prediction ranges illustrate potential outcomes for concentrated WBT positions, but investors should weigh whether single-asset exposure matches their risk tolerance or whether diversified strategies better suit their objectives.

What Is WhiteBIT Coin?

WhiteBIT Coin is the native exchange token associated with the WhiteBIT ecosystem. It is designed to support utility on the platform and related services.

WBT typically provides fee discounts and ecosystem benefits where supported. Usage depends on exchange activity and partner integrations.

Token Metrics AI Analysis for Price Prediction

Token Metrics AI provides comprehensive context on WhiteBIT Coin's positioning and challenges that inform our price prediction models.

Vision: The stated vision for WhiteBIT Coin centers on enhancing user experience within the WhiteBIT exchange ecosystem by providing tangible benefits such as reduced trading fees, access to exclusive features, and participation in platform governance or rewards programs. It aims to strengthen user loyalty and engagement by aligning token holders' interests with the exchange's long-term success. While not positioned as a decentralized protocol token, its vision reflects a broader trend of exchanges leveraging tokens to build sustainable, incentivized communities.

Problem: Centralized exchanges often face challenges in retaining active users and differentiating themselves in a competitive market. Users may be deterred by high trading fees, limited reward mechanisms, or lack of influence over platform developments. WhiteBIT Coin aims to address these frictions by introducing a native incentive layer that rewards participation, encourages platform loyalty, and offers cost-saving benefits. This model seeks to improve user engagement and create a more dynamic trading environment on the WhiteBIT platform.

Solution: WhiteBIT Coin serves as a utility token within the WhiteBIT exchange, offering users reduced trading fees, staking opportunities, and access to special events such as token sales or airdrops. It functions as an economic lever to incentivize platform activity and user retention. While specific governance features are not widely documented, such tokens often enable voting on platform upgrades or listing decisions. The solution relies on integrating the token deeply into the exchange's operational model to ensure consistent demand and utility for holders.

Market Analysis: Exchange tokens like WhiteBIT Coin operate in a competitive landscape led by established players such as Binance Coin (BNB) and KuCoin Token (KCS). While BNB benefits from a vast ecosystem including a launchpad, decentralized exchange, and payment network, WBT focuses on utility within its native exchange. Adoption drivers include the exchange's trading volume, security track record, and the attractiveness of fee discounts and staking yields. Key risks involve regulatory pressure on centralized exchanges and competition from other exchange tokens that offer similar benefits.

Fundamental Snapshot from Token Metrics

Fundamental Grade: 52.35% (Community 82%, Tokenomics 60%, Exchange 50%, VC —, DeFi Scanner N/A).


Catalysts That Skew Bullish for Price Prediction

  • Institutional and retail access expands with ETFs, listings, and integrations
  • Macro tailwinds from lower real rates and improving liquidity
  • Product or roadmap milestones such as upgrades, scaling, or partnerships
  • These factors could push WBT toward higher price prediction targets

Risks That Skew Bearish for Price Prediction

  • Macro risk-off from tightening or liquidity shocks
  • Regulatory actions or infrastructure outages
  • Concentration in validator economics and competitive displacement
  • Protocol-specific execution risk and competitive pressure from alternatives
  • These factors could push WBT toward lower price prediction scenarios

FAQs: WhiteBIT Coin Price Prediction

Can WBT reach $100 according to price predictions?

Based on the price prediction scenarios, WBT could reach $100 in the 16T base case. The 16T tier projects $109.75 in the base case price forecast. Achieving this price prediction requires both broad market cap expansion and WhiteBIT Coin maintaining competitive position. Not financial advice.

What's the risk/reward profile for WBT price prediction?

Risk and reward in our price prediction model span from $54.50 in the lowest bear case to $272.13 in the highest moon case. Downside risks include regulatory actions and competitive displacement, while upside drivers include expanding access and favorable macro liquidity. Concentrated positions amplify both tails, while diversified strategies smooth outcomes.

What gives WBT value and impacts price predictions?

WBT accrues value through fee discounts, staking rewards, access to special events, and potential participation in platform programs. Demand drivers include exchange activity, user growth, and security reputation. While these fundamentals matter for price predictions, diversified portfolios capture value accrual across multiple tokens rather than betting on one protocol's success.

What is the 2028 WhiteBIT Coin price prediction?

Based on Token Metrics analysis, the 2028 price prediction for WhiteBIT Coin centers around $40 in the base case under current market conditions, with a range between $10 and $85 depending on market scenarios. Bullish price predictions range from $64.88 to $272.13 across different total crypto market cap environments.

Can WBT reach $200 by 2028?

According to our price prediction models, WBT could reach $200 in the 23T moon case ($206.51) and in the 31T scenarios where the base case is $199.47 and the moon case is $272.13. These price prediction outcomes require significant crypto market expansion and WhiteBIT maintaining strong competitive positioning. Not financial advice.


Next Steps

Disclosure

Educational purposes only, not financial advice. Crypto is volatile, concentration amplifies risk, and diversification is a fundamental principle of prudent portfolio construction. Do your own research and manage risk appropriately.

Choose from Platinum, Gold, and Silver packages
Reach with 25–30% open rates and 0.5–1% CTR
Craft your own custom ad—from banners to tailored copy
Perfect for Crypto Exchanges, SaaS Tools, DeFi, and AI Products