Back to blog
Research

Best Index Providers & Benchmark Services (2025)

Crypto index providers give institutions and advanced investors rules-based, auditable ways to measure the digital asset market. In one sentence: a crypto index provider designs and administers regulated benchmarks—like price indices or market baskets—that funds, ETPs, quants, and risk teams can track or license.
Sam Monac
5 min
Want Smarter Crypto Picks—Free?
See unbiased Token Metrics Ratings for BTC, ETH, and top alts.
Thank you! Your submission has been received!
Oops! Something went wrong while submitting the form.
 No credit card | 1-click unsubscribe

Why Crypto Index Providers & Benchmark Services Matter in September 2025

Crypto index providers give institutions and advanced investors rules-based, auditable ways to measure the digital asset market. In one sentence: a crypto index provider designs and administers regulated benchmarks—like price indices or market baskets—that funds, ETPs, quants, and risk teams can track or license. As liquidity deepens and regulation advances, high-integrity benchmarks reduce noise, standardize reporting, and enable products from passive ETPs to factor strategies.
If you’re comparing crypto index providers for portfolio measurement, product launches, or compliance reporting, this guide ranks the best options now—what they do, who they fit, and what to consider across security posture, coverage, costs, and support.

How We Picked (Methodology & Scoring)

  • Liquidity (30%) – Does the provider screen venues/liquidity robustly and publish transparent inclusion rules?

  • Security & Governance (25%) – Benchmark authorization/registration, governance committees, calculation resilience, and public methodologies/audits.

  • Coverage (15%) – Breadth across single-asset, multi-asset, sectors/factors, and region eligibility.

  • Costs (15%) – Licensing clarity, data access models, and total cost to operate products.

  • UX (10%) – Docs, factsheets, ground rules, rebalancing cadence, client tooling.

  • Support (5%) – Responsiveness, custom index build capacity, enterprise integration.

We relied on official product pages, methodologies, and security/governance disclosures; third-party datasets (e.g., venue quality screens) were used only as cross-checks. Last updated September 2025.

Top 10 Crypto Index Providers & Benchmark Services in September 2025

1) CF Benchmarks — Best for regulated settlement benchmarks

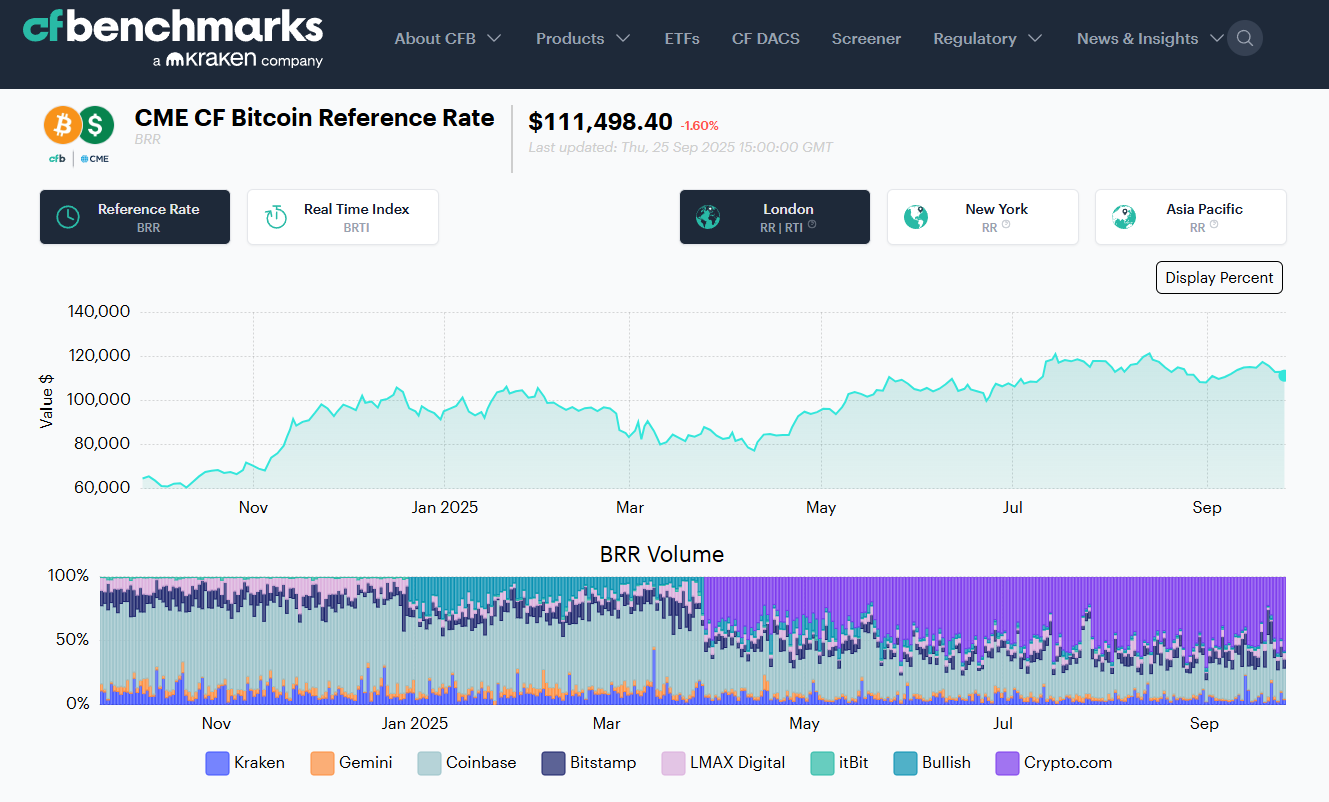
Why Use It: Administrator of the CME CF Bitcoin Reference Rate (BRR) and related benchmarks used to settle major futures and institutional products; UK BMR-registered with transparent exchange criteria and daily calculation since 2016. If you need benchmark-grade spot references (BTC, ETH and more) with deep derivatives alignment, start here. CF Benchmarks+1
Best For: Futures settlement references; fund NAV/pricing; risk; audit/compliance.
Notable Features: BRR/BRRNY reference rates; multi-exchange liquidity screens; methodology & governance docs; broad suite of real-time indices.
Consider If: You need composite market baskets beyond single-assets—pair with a multi-asset provider.
Alternatives: S&P Dow Jones Indices; FTSE Russell.
Regions: Global • Fees/Notes: Licensed benchmarks; enterprise pricing.

2) S&P Dow Jones Indices — Best for broad, institution-first crypto baskets

Why Use It: The S&P Cryptocurrency series (incl. Broad Digital Market) brings index craft, governance, and transparency familiar to traditional asset allocators—ideal for boards and committees that already use S&P. S&P Global+1
Best For: Asset managers launching passive products; OCIOs; consultants.
Notable Features: Broad/large-cap/mega-cap indices; single-asset BTC/ETH; published ground rules; established brand trust.
Consider If: You need highly customizable factors or staking-aware baskets—other vendors may move faster here.
Alternatives: MSCI; MarketVector.
Regions: Global • Fees/Notes: Licensing via S&P DJI.

3) MSCI Digital Assets — Best for thematic & institutional risk frameworks

Why Use It: MSCI’s Global Digital Assets and Smart Contract indices apply MSCI’s taxonomy/governance with themed exposures and clear methodologies—useful when aligning with enterprise risk standards. MSCI+1
Best For: CIOs needing policy-friendly thematics; due-diligence heavy institutions.
Notable Features: Top-30 market index; smart-contract subset; methodology docs; global brand assurance.
Consider If: You need exchange-by-exchange venue vetting or settlement rates—pair with CF Benchmarks or FTSE Russell.
Alternatives: S&P DJI; FTSE Russell.
Regions: Global • Fees/Notes: Enterprise licensing.

4) FTSE Russell Digital Asset Indices — Best for liquidity-screened, DAR-vetted universes

Why Use It: Built in association with Digital Asset Research (DAR), FTSE Russell screens assets and venues to EU Benchmark-ready standards; strong fit for risk-controlled coverage from large to micro-cap and single-asset series. LSEG+1
Best For: Product issuers who need venue vetting & governance; EU-aligned programs.
Notable Features: FTSE Global Digital Asset series; single-asset BTC/ETH; ground rules; DAR reference pricing.
Consider If: You require highly custom factor tilts—MarketVector or Vinter may be quicker to bespoke.
Alternatives: Wilshire; S&P DJI.
Regions: Global (EU-friendly) • Fees/Notes: Licensed benchmarks.

5) Nasdaq Crypto Index (NCI) — Best for flagship, dynamic market representation

Why Use It: NCI is designed to be dynamic, representative, and trackable; widely recognized and replicated by ETPs seeking diversified core exposure—useful as a single “beta” benchmark. Nasdaq+2Nasdaq Global Index Watch+2
Best For: Core market ETPs; CIO benchmarks; sleeve construction.
Notable Features: Rules-driven eligibility; regular reconstitutions; strong market recognition.
Consider If: You want deep sector/thematic granularity—pair with MSCI/MarketVector.
Alternatives: Bloomberg Galaxy (BGCI); MarketVector MVDA.
Regions: Global • Fees/Notes: Licensing via Nasdaq.

6) MarketVector Indexes — Best for broad coverage & custom builds

Why Use It: Backed by VanEck’s index arm (formerly MVIS), MarketVector offers off-the-shelf MVDA 100 plus sectors, staking-aware, and bespoke solutions—popular with issuers needing speed to market and depth. MarketVector Indexes+1
Best For: ETP issuers; quants; asset managers needing customization.
Notable Features: MVDA (100-asset) benchmark; single/multi-asset indices; staking/factor options; robust docs.
Consider If: You prioritize blue-chip simplicity—BGCI/NCI might suffice.
Alternatives: Vinter; S&P DJI.
Regions: Global • Fees/Notes: Enterprise licensing; custom index services.

7) Bloomberg Galaxy Crypto Index (BGCI) — Best for blue-chip, liquid market beta

Why Use It: Co-developed by Bloomberg and Galaxy, BGCI targets the largest, most liquid cryptoassets, with concentration caps and monthly reviews—an institutional “core” that’s widely cited on terminals. Galaxy Asset Management+1
Best For: CIO benchmarks; performance reporting; media-friendly references.
Notable Features: Capped weights; qualified exchange criteria; Bloomberg governance.
Consider If: You need smaller-cap breadth—MVDA/NCI may cover more names.
Alternatives: NCI; S&P DJI.
Regions: Global • Fees/Notes: License via Bloomberg Index Services.

8) CoinDesk Indices — Best for reference pricing (XBX) & tradable composites (CoinDesk 20)

Why Use It: Administrator of XBX (Bitcoin Price Index) and the CoinDesk 20, with transparent liquidity weighting and growing exchange integrations—including use in listed products. CoinDesk Indices+2CoinDesk Indices+2
Best For: Reference rates; product benchmarks; quant research.
Notable Features: XBX reference rate; CoinDesk 20; governance/methodologies; exchange selection rules.
Consider If: You require UK BMR-registered BTC settlement—CF Benchmarks BRR is purpose-built.
Alternatives: CF Benchmarks; S&P DJI.
Regions: Global • Fees/Notes: Licensing available; contact sales.

9) Vinter — Best for specialist, regulated crypto index construction

Why Use It: A regulated, crypto-native index provider focused on building/maintaining indices tracked by ETPs across Europe; fast on custom thematics and single-asset reference rates. vinter.co+1
Best For: European ETP issuers; bespoke strategies; rapid prototyping.
Notable Features: BMR-style reference rates; multi-asset baskets; calc-agent services; public factsheets.
Consider If: You need mega-brand recognition for U.S. committees—pair with S&P/MSCI.
Alternatives: MarketVector; Solactive.
Regions: Global (strong EU footprint) • Fees/Notes: Custom build/licensing.

10) Wilshire (FT Wilshire Digital Asset Index Series) — Best for institutional coverage & governance

Why Use It: The FT Wilshire series aims to be an institutional market standard with transparent rules, broad coverage, and exchange quality screens—supported by detailed methodology documents. wilshireindexes.com+1
Best For: Consultants/OCIOs; plan sponsors; research teams.
Notable Features: Broad Market index; governance via advisory groups; venue vetting; classification scheme.
Consider If: You need media-ubiquitous branding—S&P/Bloomberg carry more name recall.
Alternatives: FTSE Russell; S&P DJI.
Regions: Global • Fees/Notes: Enterprise licensing.

Decision Guide: Best By Use Case

How to Choose the Right Crypto Index Provider (Checklist)

  • Region & eligibility: Confirm benchmark status (e.g., UK/EU BMR) and licensing.

  • Coverage fit: Single-asset, broad market, sectors/factors, staking yield handling.

  • Liquidity screens: How are exchanges qualified and weighted?

  • Rebalance/refresh: Frequency and buffers to limit turnover/slippage.

  • Data quality & ops: Timestamps, outage handling, fallbacks, NAV timing.

  • Costs: Licensing, data access, custom build fees.

  • Support: SLAs, client engineering, custom index services.

  • Red flags: Opaque methodologies; limited venue vetting.

Use Token Metrics With Any Index Provider

  • AI Ratings to screen constituents and spot outliers.
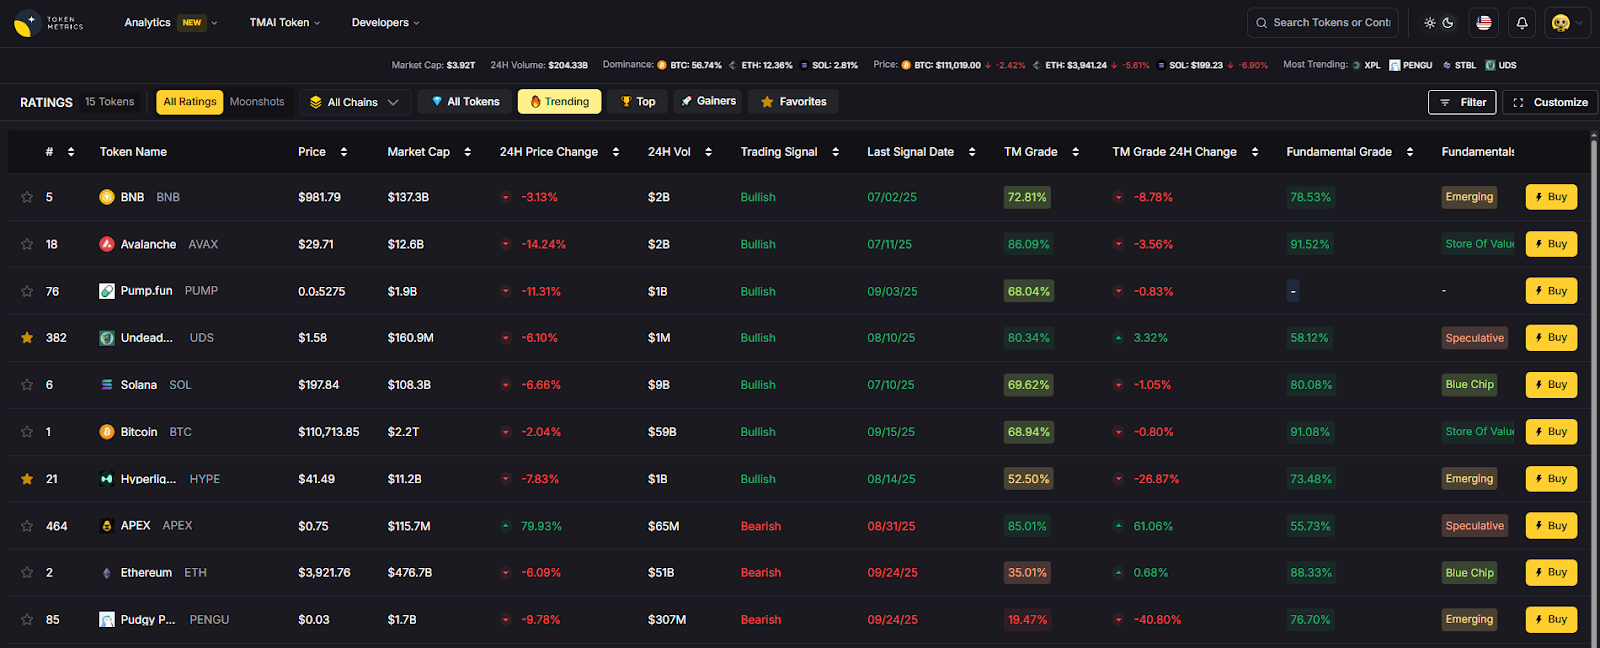
  • Narrative Detection to see when sectors (e.g., L2s, DePIN) start trending.

  • Portfolio Optimization to balance broad index beta with targeted alpha sleeves.

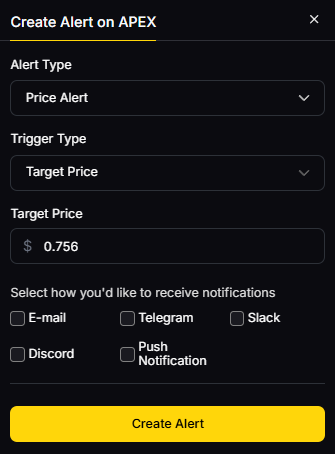
  • Alerts & Signals to monitor entries/exits as indices rebalance.
    Mini-workflow: Research → Select index/benchmark → Execute via your provider or ETP → Monitor with Token Metrics alerts.

 Primary CTA: Start free trial.

Security & Compliance Tips

  • Enable 2FA and role-based access for index data portals.

  • Map custody and pricing cut-offs to index valuation times.

  • Align with KYC/AML when launching index-linked products.

  • For RFQ/OTC hedging around rebalances, pre-plan execution windows.

  • Staking/bridged assets: verify methodology treatment and risks.

This article is for research/education, not financial advice.

Beginner Mistakes to Avoid

  • Assuming all “broad market” indices hold the same assets/weights.

  • Ignoring venue eligibility—liquidity and data quality vary.

  • Overlooking reconstitution buffers (can drive turnover and cost).

  • Mixing reference rates and investable baskets in reporting.

  • Not confirming licensing scope for marketing vs. product use.

FAQs

What is a crypto index provider?
A company that designs, calculates, and governs rules-based benchmarks for digital assets—ranging from single-asset reference rates to diversified market baskets—licensed for reporting or products.

Which crypto index is best for “core beta”?
For simple, liquid market exposure, many institutions look to BGCI or NCI due to broad recognition and liquidity screens; your use case and region may point to S&P/FTSE alternatives. Galaxy Asset Management+1

How do providers choose exchanges and assets?
They publish ground rules defining eligible venues (liquidity, compliance), asset screening, capping, and rebalances—see S&P, FTSE (with DAR), and CF Benchmarks for examples. S&P Global+2LSEG+2

Can I license a custom crypto index?
Yes—MarketVector and Vinter (among others) frequently build bespoke indices and act as calculation agents for issuers. MarketVector Indexes+1

What’s the difference between a reference rate and a market basket?
Reference rates (e.g., BRR, XBX) target a single asset’s robust price; market baskets (e.g., NCI, BGCI) represent diversified multi-asset exposure. Galaxy Asset Management+3CF Benchmarks+3CoinDesk Indices+3

Are these benchmarks available in the U.S. and EU?
Most are global; for EU/UK benchmark usage, verify authorization/registration (e.g., CF Benchmarks UK BMR) and your product’s country-specific rules. CF Benchmarks

Conclusion + Related Reads

If you need regulated reference pricing for settlement or NAVs, start with CF Benchmarks. For core market beta, BGCI and NCI are widely recognized. For institution-grade breadth, consider S&P DJI or FTSE Russell (with DAR). If you’re launching custom or thematic products, MarketVector and Vinter are strong build partners.

Related Reads:

  • Best Cryptocurrency Exchanges 2025

  • Top Derivatives Platforms 2025

  • Top Institutional Custody Providers 2025

Sources & Update Notes

We reviewed official product pages, methodologies, and governance documents current as of September 2025. A short list of key sources per provider is below (official sites only; non-official data used only for cross-checks and not linked here).

  • CF Benchmarks: “BRR – CME CF Bitcoin Reference Rate”; CME CF Cryptocurrency Benchmarks. CF Benchmarks+1

  • S&P Dow Jones Indices: “Cryptocurrency – Indices”; “S&P Cryptocurrency Broad Digital Market Index.” S&P Global+1

  • MSCI: “Digital Assets Solutions”; “Global Digital Assets Index Methodology.” MSCI+1

  • FTSE Russell: “Digital Asset indices”; FTSE + DAR reference pricing overview/ground rules. LSEG+2LSEG+2

  • Nasdaq: “Nasdaq Crypto Index (NCI)” solution page; NCI index overview; Hashdex NCI ETP replication note. Nasdaq+2Nasdaq Global Index Watch+2

  • MarketVector: “Digital Assets Indexes” hub; “MarketVector Digital Assets 100 (MVDA).” MarketVector Indexes+1

  • Bloomberg Galaxy: Galaxy “Bloomberg Indices (BGCI)” page; Bloomberg terminal quote page. Galaxy Asset Management+1

  • CoinDesk Indices: “CoinDesk Indices” homepage; “XBX” page; NYSE/ICE collaboration release referencing XBX. CoinDesk Indices+2CoinDesk Indices+2

  • Vinter: “Making Smarter Crypto Indexes for ETF Issuers”; example single-asset reference rate page. vinter.co+1

Wilshire: FT Wilshire Digital Asset Index Series page; methodology PDF. wilshireindexes.com+1

Build Smarter Crypto Apps &
AI Agents in Minutes, Not Months
Real-time prices, trading signals, and on-chain insights all from one powerful API.
Grab a Free API Key
About Token Metrics
Token Metrics: AI-powered crypto research and ratings platform. We help investors make smarter decisions with unbiased Token Metrics Ratings, on-chain analytics, and editor-curated “Top 10” guides. Our platform distills thousands of data points into clear scores, trends, and alerts you can act on.
30 Employees
analysts, data scientists, and crypto engineers
Daily Briefings
concise market insights and “Top Picks”
Transparent & Compliant
Sponsored ≠ Ratings; research remains independent
Want Smarter Crypto Picks—Free?
See unbiased Token Metrics Ratings for BTC, ETH, and top alts.
Thank you! Your submission has been received!
Oops! Something went wrong while submitting the form.
 No credit card | 1-click unsubscribe
Token Metrics Team
Token Metrics Team

Recent Posts

Research

AAVE Price Prediction 2027: $70-$2,175 Forecast Analysis

Token Metrics Team
9 min read

AAVE Price Prediction 2027: Market Analysis and Scenario-Based Forecasts

Market Context for Aave Price Prediction: The Case for 2027

DeFi protocols are maturing beyond early ponzi dynamics toward sustainable revenue models. Aave operates in this evolving landscape where real yield and proven product-market fit increasingly drive valuations rather than speculation alone. Growing regulatory pressure on centralized platforms creates tailwinds for decentralized alternatives—factors that inform our comprehensive AAVE price prediction framework.

The scenario bands below reflect how AAVE price predictions might perform across different total crypto market cap environments. Each tier represents a distinct liquidity regime, from bear conditions with muted DeFi activity to moon scenarios where decentralized infrastructure captures significant value from traditional finance.


Disclosure

Educational purposes only, not financial advice. Crypto is volatile, do your own research and manage risk.

How to Read This AAVE Price Prediction

Each band blends cycle analogues and market-cap share math with TA guardrails. Base assumes steady adoption and neutral or positive macro. Moon layers in a liquidity boom. Bear assumes muted flows and tighter liquidity.

TM Agent baseline: Token Metrics TM Grade is 72, Buy, and the trading signal is bullish, indicating solid protocol fundamentals, healthy developer activity, and positive near-term momentum. Concise twelve-month numeric view, Token Metrics price prediction scenarios cluster roughly between $70 and $320, with a base case near $150, reflecting continued growth in lending TVL, fee revenue capture by the protocol, and modest macro tailwinds.

Live details: Aave Token Details

Affiliate Disclosure: We may earn a commission from qualifying purchases made via this link, at no extra cost to you.

Key Takeaways

  • Scenario driven, outcomes hinge on total crypto market cap, higher liquidity and adoption lift the bands.
  • Fundamentals: Fundamental Grade 75.51% (Community 77%, Tokenomics 100%, Exchange 100%, VC 49%, DeFi Scanner 70%).
  • Technology: Technology Grade 83.17% (Activity 75%, Repository 68%, Collaboration 92%, Security 78%, DeFi Scanner 70%).
  • TM Agent gist: scenarios cluster between $70 and $320 with base near $150, assuming steady lending TVL growth and neutral macro conditions.
  • Education only, not financial advice.

AAVE Price Prediction Scenario Analysis

Our Token Metrics price prediction framework spans four market cap tiers, each representing different levels of crypto market maturity and liquidity:

8T Market Cap - AAVE Price Prediction:

At an 8 trillion dollar total crypto market cap, AAVE projects to $293.45 in bear conditions, $396.69 in the base case, and $499.94 in bullish scenarios.

16T Market Cap - AAVE Price Prediction:

Doubling the market to 16 trillion expands the price prediction range to $427.46 (bear), $732.18 (base), and $1,041.91 (moon).

23T Market Cap - AAVE Price Prediction:

At 23 trillion, the price prediction scenarios show $551.46, $1,007.67, and $1,583.86 respectively.

31T Market Cap - AAVE Price Prediction:

In the maximum liquidity scenario of 31 trillion, AAVE price predictions could reach $680.47 (bear), $1,403.16 (base), or $2,175.85 (moon).

Each tier assumes progressively stronger market conditions, with the base case price prediction reflecting steady growth and the moon case requiring sustained bull market dynamics.

Why Consider the Indices with Top-100 Exposure

Aave represents one opportunity among hundreds in crypto markets. Token Metrics Indices bundle AAVE with top one hundred assets for systematic exposure to the strongest projects. Single tokens face idiosyncratic risks that diversified baskets mitigate.

Historical index performance demonstrates the value of systematic diversification versus concentrated positions.

Join the early access list

What Is Aave?

Aave is a decentralized lending protocol that operates across multiple EVM-compatible chains including Ethereum, Polygon, Arbitrum, and Optimism. The network enables users to supply crypto assets as collateral and borrow against them in an over-collateralized manner, with interest rates dynamically adjusted based on utilization.

The AAVE token serves as both a governance asset and a backstop for the protocol through the Safety Module, where stakers earn rewards in exchange for assuming shortfall risk. Primary utilities include voting on protocol upgrades, fee switches, collateral parameters, and new market deployments.

Token Metrics AI Analysis

Token Metrics AI provides comprehensive context on Aave's positioning and challenges.

Vision: Aave aims to create an open, accessible, and non-custodial financial system where users have full control over their assets. Its vision centers on decentralizing credit markets and enabling seamless, trustless lending and borrowing across blockchain networks.

Problem: Traditional financial systems often exclude users due to geographic, economic, or institutional barriers. Even in crypto, accessing credit or earning yield on idle assets can be complex, slow, or require centralized intermediaries. Aave addresses the need for transparent, permissionless, and efficient lending and borrowing markets in the digital asset space.

Solution: Aave uses a decentralized protocol where users supply assets to liquidity pools and earn interest, while borrowers can draw from these pools by posting collateral. It supports features like variable and stable interest rates, flash loans, and cross-chain functionality through its Layer 2 and multi-chain deployments. The AAVE token is used for governance and as a safety mechanism via its staking program (Safety Module).

Market Analysis: Aave is a leading player in the DeFi lending sector, often compared with protocols like Compound and Maker. It benefits from strong brand recognition, a mature codebase, and ongoing innovation such as Aave Arc for institutional pools and cross-chain expansion. Adoption is driven by liquidity, developer activity, and integration with other DeFi platforms. Key risks include competition from newer lending protocols, regulatory scrutiny on DeFi, and smart contract risks. As a top DeFi project, Aave's performance reflects broader trends in decentralized finance, including yield demand, network security, and user trust. Its multi-chain strategy helps maintain relevance amid shifting ecosystem dynamics.

Fundamental and Technology Snapshot from Token Metrics

Fundamental Grade: 75.51% (Community 77%, Tokenomics 100%, Exchange 100%, VC 49%, DeFi Scanner 70%).


Technology Grade: 83.17% (Activity 75%, Repository 68%, Collaboration 92%, Security 78%, DeFi Scanner 70%).

Catalysts That Skew AAVE Price Predictions Bullish

  • Institutional and retail access expands with ETFs, listings, and integrations
  • Macro tailwinds from lower real rates and improving liquidity
  • Product or roadmap milestones such as upgrades, scaling, or partnerships

Risks That Skew AAVE Price Predictions Bearish

  • Macro risk-off from tightening or liquidity shocks
  • Regulatory actions or infrastructure outages
  • Concentration or competitive displacement in lending

AAVE Price Prediction FAQs

Can AAVE reach $1,000?

Yes. Based on our price prediction scenarios, AAVE could reach $1,007.67 in the 23T base case and $1,041.91 in the 16T moon case. Not financial advice.

Can AAVE 10x from current levels?

At current price of $228.16, a 10x would reach $2,281.60. This falls within the 31T moon case price prediction at $2,175.85 (only slightly below), and would require extreme liquidity expansion. Not financial advice.

What price could AAVE reach in the moon case?

Our moon case price predictions range from $499.94 at 8T to $2,175.85 at 31T. These scenarios assume maximum liquidity expansion and strong Aave adoption. Not financial advice.

What is the AAVE price prediction for 2027?

Our comprehensive 2027 price prediction framework suggests AAVE could trade between $293.45 and $2,175.85, depending on market conditions and total crypto market capitalization. The base case scenario clusters around $396.69 to $1,403.16 across different market cap environments. Not financial advice.

Is AAVE a good investment based on price predictions?

AAVE shows strong fundamentals (75.51% grade) and technology scores (83.17% grade), with bullish trading signals. However, all price predictions involve uncertainty and risk. Always conduct your own research and consult financial advisors before investing. Not financial advice.


Next Steps

Track live grades and signals: Token Details 

Join Indices Early Access

Want exposure? Buy AAVE on MEXC 

Disclosure

Educational purposes only, not financial advice. Crypto is volatile, do your own research and manage risk.

Why Use Token Metrics?

  • AI-driven crypto and DeFi grades for risk management and alpha discovery.
  • Quantitative, on-chain signals and robust scenario modeling for tokens like AAVE.
  • Access in-depth research reports, analyst perspectives, auto-grades, and portfolio tools from Token Metrics.
Research

x402 & HTTP 402 Explained: Why Wallet-Paid API Calls Are Winning (and Where Token Metrics Fits)

Token Metrics Team
10 min read

What Is x402?

x402 is an open-source, HTTP-native payment protocol developed by Coinbase that enables pay-per-call API access using crypto wallets. It leverages the HTTP 402 Payment Required status code to create seamless, keyless API payments.

It eliminates traditional API keys and subscriptions, allowing agents and applications to pay for exactly what they use in real time. It works across Base and Solana with USDC and selected native tokens such as TMAI.

Start using Token Metrics X402 integration here. https://www.x402scan.com/server/244415a1-d172-4867-ac30-6af563fd4d25 

TLDR — The x402 Value Proposition

x402 transforms API access by making payments native to HTTP requests.

Feature

Traditional APIs

x402 APIs

Authentication

API keys, tokens

Wallet signature

Payment Model

Subscription, prepaid

Pay-per-call

Onboarding

Sign up, KYC, billing

Connect wallet

Rate Limits

Fixed tiers

Economic (pay more = more access)

Commitment

Monthly/annual

Zero, per-call only

How to use it: Add x-coinbase-402: true header to any supported endpoint. Sign payment with your wallet. The API responds immediately after confirming micro-payment.

Token Metrics integration: All public endpoints available via x402 with per-call pricing from $0.017 to $0.068 USDC (10% discount with TMAI token).

Explore live agents: https://www.x402scan.com/composer.

How HTTP 402 Payment Required Works — Technical Deep Dive

The Protocol Flow

The HTTP 402 status code was reserved in HTTP/1.1 in 1997 for future digital payment use cases and was never standardized for any specific payment scheme. x402 activates this path by using 402 responses to coordinate crypto payments during API requests.

  1. Step by step: Client makes an API request with the header x-coinbase-402: true.
  2. The server can return 402 with payment details such as amount, recipient, and chain.
  3. The client wallet signs and submits the payment transaction.
  4. The server verifies the payment on-chain, then processes the original request and returns 200 with data.

Why this matters: It eliminates intermediary payment processors, enables true machine-to-machine commerce, and reduces friction for AI agents.

Ecosystem Proof: x402 Is Winning — Three Validation Points

CoinGecko Recognition

CoinGecko launched a dedicated x402 Ecosystem category in October 2025, tracking 700+ projects with over $1 billion market cap and approximately $213 million in daily trading volume. Top performers include PING and Alnalyst, along with established projects like EigenCloud.


Base Network Adoption

Base has emerged as the primary chain for x402 adoption, with 450,000+ weekly transactions by late October 2025, up from near-zero in May. This growth demonstrates real agent and developer usage.

x402scan Composer — Where Agents Pay in Real Time

Composer is x402scan's sandbox for discovering and using AI agents that pay per tool call. Users can open any agent, chat with it, and watch tool calls and payments stream in real time.

Top agents include AInalyst, Canza, SOSA, and NewEra. The Composer feed shows live activity across all agents.


Explore Composer: https://x402scan.com/composer 

Token Metrics x402 Integration — Concrete Implementation

What We Ship

Token Metrics offers all public API endpoints via x402 with no API key required. Pay per call with USDC or TMAI for a 10 percent discount. Access includes trading signals, price predictions, fundamental grades, technology scores, indices data, and the AI chatbot.

Check out Token Metrics Integration on X402. https://www.x402scan.com/server/244415a1-d172-4867-ac30-6af563fd4d25 


Data as of October, 2025.

Pricing Tiers


Important note: TMAI Spend Limit: TMAI has 18 decimals. Set max payment to avoid overspending. Example: 200 TMAI = 200 * (10 ** 18) in base units.

Full integration guide: https://api.tokenmetrics.com 

Why x402 Changes Everything for AI Agents

  • Eliminates onboarding friction. Agents can discover and use new APIs instantly without human intervention for API key management or billing setup.
  • Enables true agentic commerce. Agents pay for exactly what they use, which makes micro-transactions economically viable. This unlocks composition of multiple specialized services.
  • Aligns incentives. API providers get paid per call, users only pay for value received, and agents can optimize costs by choosing best-fit providers. Network effects accelerate as more endpoints adopt x402.

Use Cases Already Working

  • Crypto analytics agents: Pull Token Metrics data on demand to answer market questions, generate trade signals, or build custom dashboards.
  • Research automation: Chain together x402 endpoints like Twitter search, Tavily extract, Firecrawl, and Token Metrics to gather and structure data.
  • Portfolio management: Agents monitor positions, fetch real-time prices, calculate risk metrics, and execute rebalancing decisions using paid data sources.
  • Trading strategy backtests: Access historical OHLCV, grades, and signals data via x402 without committing to monthly subscriptions.
  • Multi-chain intelligence: Combine Base and Solana x402 services for cross-chain analysis and arbitrage discovery.

Ecosystem Participants and Tools

Active x402 Endpoints

Key endpoints beyond Token Metrics include Heurist Mesh for crypto intelligence, Tavily extract for structured web content, Firecrawl search for SERP and scraping, Twitter or X search for social discovery, and various DeFi and market data providers.

Infrastructure and Tools

  • x402scan: Explorer and analytics platform tracking all x402 activity across chains.
  • Composer: Hosted sandbox for discovering and using x402-enabled agents.
  • x402-axios and x402-httpx: Client libraries for Node.js and Python.
  • Coinbase Agent Kit: SDK integration for building x402-native agents.
  • LangChain connectors: Framework integration for agent workflows.

Common Questions About x402

How is x402 different from traditional API keys?

x402 uses wallet signatures instead of API keys. Payment happens per call rather than via subscription. No sign-up, no monthly billing, no rate limit tiers. You pay for exactly what you use.

Which chains support x402?

Currently Base and Solana. Most activity is on Base with USDC as the primary payment token. Some endpoints accept native tokens like TMAI for discounts.

Do I need to trust the API provider with my funds?

No. Payments are on-chain and verifiable. You approve each transaction amount. No escrow or prepayment is required.

What happens if a payment fails?

The API returns 402 Payment Required again with updated payment details. Your client retries automatically. You do not receive data until payment confirms.

Can I use x402 with existing API clients?

Yes, with x402 client libraries such as x402-axios for Node and x402-httpx for Python. These wrap standard HTTP clients and handle the payment flow automatically.

Getting Started Checklist

  1. Set up a wallet: Create a Base wallet with USDC or TMAI balance.
  2. Install x402 client: npm install x402-axios or pip install x402-httpx.
  3. Choose an endpoint: Browse x402scan or Composer for available APIs.
  4. Write minimal code: Add x-coinbase-402: true header to requests.
  5. Watch payments flow: Monitor transactions in your wallet and on x402scan feed.
  6. Optimize costs: Compare endpoint pricing, use TMAI for 10% discount, cache results when appropriate.

Token Metrics x402 Resources

What's Next for x402

Ecosystem expansion. More API providers adopting x402, additional chains beyond Base and Solana, standardization of payment headers and response formats.

Agent sophistication. As x402 matures, expect agents that automatically discover and compose multiple paid endpoints, optimize costs across providers, and negotiate better rates for bulk usage.

Disclosure

Educational content only, not financial advice. API usage and crypto payments carry risks. Verify all transactions before signing. Do your own research.

Frequently Asked Questions

Research

Top 10 Pump.fun Livestream Tokens by Fees Earned

Token Metrics Team
7 min read


Opening Hook

Fees Earned is a clean way to see which livestream tokens convert attention into on-chain activity. This leaderboard ranks the top 10 Pump.fun livestream tokens by Fees Earned using the screenshot you provided.

Selection rule is simple, top 10 by Fees Earned from the screenshot, numbers appear exactly as shown. If a field is not in the image, it is recorded as —.

Entity coverage: project names and tickers are taken as listed on Pump.fun, chain is Solana, sector is livestream meme tokens and creator tokens.

Featured: Token Metrics Live (TMLIVE) — Why We Built on Pump.fun

Token Metrics Live (TMLIVE) brings real time, data driven crypto market analysis to Pump.fun. The team has produced live crypto content for 7 years with a 500K plus audience and a platform of more than 100,000 users. Our public track record includes early coverage of winners like MATIC and Helium in 2018.

TMLIVE Quick Stats, as captured

  • ATH market cap: $291.7K
  • 24 hour volume on day one: $1.7M
  • Holders at capture: ~876
  • Current market cap at capture: $36.1K, displayed price: $0.043, visible chart timestamp: 22:33:49 UTC
  • Ticker: TMLIVE, Chain: Solana, Contract: 8Dxpc8Q8jg7TK8TT1pVntcqunHGofqpetCaP5fEhpump
  • Use these as captured numbers when referencing day one results. If you update screenshots later, swap in the new captures.

TLDR: Fees Earned Leaders at a Glance

  • Fees Earned: StrSzn ranks first with strong peak and average viewership for its size.
  • Fees Earned: Bagwork and POLYFACTS are close behind, both with large holder bases and double digit KOL counts.
  • Fees Earned: KIND shows the biggest KOL presence in the top 10, aligned with solid viewer averages.
  • Fees Earned: Newer names like Fapcoin appear despite modest viewer counts, proof that recency and focused pushes can drive fees.
  • Fees Earned: Live status correlates with short bursts for BUN COIN and FTP, while sustained averages matter over time.

Pump.fun Fees Earned Leaderboard (Top 10)


Short distribution note: the top three sit within a narrow band of each other, while mid-table tokens show a mix of older communities and recent streams. Several names with modest average viewers still appear due to concentrated activity during peaks.

Project Snapshots: What Each Token Does

StrSzn

Positioning: Active community meme with consistent viewer base.

Research Blurb: Project details unclear at time of writing. Fees and viewership suggest consistent stream engagement over the last month.

Quick Facts: Chain = Solana, Status = —, Peak Viewers = 1,951, Avg Viewers = 548.


https://pump.fun/coin/986j8mhmidrcbx3wf1XJxsQFvWBMXg7gnDi3mejsr8H8

Bagwork

Positioning: Large holder base with sustained attention.

Research Blurb: Project details unclear at time of writing. Strong holders and KOL presence supported steady audience numbers.

Quick Facts: Chain = Solana, Status = 1mo ago, Holders = 9,192, KOLs = 19.


https://pump.fun/coin/7Pnqg1S6MYrL6AP1ZXcToTHfdBbTB77ze6Y33qBBpump

POLYFACTS

Positioning: Higher market cap with light average viewership.

Research Blurb: Project details unclear at time of writing. High market cap with comparatively low average viewers implies fees concentrated in shorter windows.

Quick Facts: Chain = Solana, Status = 1mo ago, MC = 3.15M, Avg Viewers = 13.


https://pump.fun/coin/FfixAeHevSKBZWoXPTbLk4U4X9piqvzGKvQaFo3cpump

STREAMER

Positioning: Community focused around streaming identity.

Research Blurb: Project details unclear at time of writing. Solid holders and moderate KOL count, steady averages over time.

Quick Facts: Chain = Solana, Status = 1mo ago, Holders = 8,008, KOLs = 14.


https://pump.fun/coin/3arUrpH3nzaRJbbpVgY42dcqSq9A5BFgUxKozZ4npump

KIND

Positioning: Heaviest KOL footprint in the top 10.

Research Blurb: Project details unclear at time of writing. The largest KOL count here aligns with above average view metrics and meaningful fees.

Quick Facts: Chain = Solana, Status = 29d ago, KOLs = 23, Avg Viewers = 57.


https://pump.fun/coin/V5cCiSixPLAiEDX2zZquT5VuLm4prr5t35PWmjNpump

ELIZABETH

Positioning: Mid-cap meme with consistent streams.

Research Blurb: Project details unclear at time of writing. Viewer averages and recency indicate steady presence rather than single spike behavior.

Quick Facts: Chain = Solana, Status = 1mo ago, Avg Viewers = 47, Peak Viewers = 113.


https://pump.fun/coin/DiiTPZdpd9t3XorHiuZUu4E1FoSaQ7uGN4q9YkQupump

Cope

Positioning: Older token with a legacy community.

Research Blurb: Project details unclear at time of writing. Despite low recent averages, it holds a sizable base and meaningful fees.

Quick Facts: Chain = Solana, Status = —, Age = 1y ago, Avg Viewers = 9.


https://pump.fun/coin/DMwbVy48dWVKGe9z1pcVnwF3HLMLrqWdDLfbvx8RchhK

BUN COIN

Positioning: Currently live, strong peaks relative to size.

Research Blurb: Project details unclear at time of writing. Live streaming status often coincides with bursts of activity that lift fees quickly.

Quick Facts: Chain = Solana, Status = Live, Peak Viewers = 897, Avg Viewers = 71.


https://pump.fun/coin/HQDTzNa4nQVetoG6aCbSLX9kcH7tSv2j2sTV67Etpump

Fapcoin

Positioning: Newer token with targeted pushes.

Research Blurb: Project details unclear at time of writing. Recent age and meaningful KOL support suggest orchestrated activations that can move fees.

Quick Facts: Chain = Solana, Status = 13d ago, Age = 18d ago, KOLs = 22.


https://pump.fun/coin/8vGr1eX9vfpootWiUPYa5kYoGx9bTuRy2Xc4dNMrpump

FTP

Positioning: Live status with solid mid-table view metrics.

Research Blurb: Project details unclear at time of writing. Peaks and consistent averages suggest an active audience during live windows.

Quick Facts: Chain = Solana, Status = Live, Peak Viewers = 496, Avg Viewers = 35.


https://pump.fun/coin/J2eaKn35rp82T6RFEsNK9CLRHEKV9BLXjedFM3q6pump

Signals From Fees Earned: Patterns to Watch

Fees Earned often rise with peak and average viewers, but timing matters. Several tokens here show concentrated peaks with modest averages, which implies that well timed announcements or coordinated segments can still produce high fees.

Age is not a blocker for this board. Newer tokens like Fapcoin appear due to focused activity, while older names such as Cope persist by mobilizing established holders. KOL count appears additive rather than decisive, with KIND standing out as the KOL leader.

Why Fees Earned Matters for Creators and Traders

For creators, Fees Earned reflects whether livestream moments translate into on-chain action. Design streams around clear calls to action, align announcements with segments that drive peaks, then sustain momentum with repeatable formats that stabilize averages.

For traders, Fees Earned complements market cap, viewers, and age. Look for projects that combine rising averages with consistent peaks, because those patterns suggest repeatable engagement rather than single event spikes.

Watch Real-Time Coverage on TV Live

TV Live is a fast way to follow real-time crypto market news, creator launches, and token breakdowns as they happen. You get context on stream dynamics, audience behavior, and on-chain activity while the story evolves.

CTA: Watch TV Live for real-time crypto market news →TV Live Link

CTA: Follow and enable alerts → TV Live

Why Crypto Investors Trust Token Metrics

Token Metrics is trusted for transparent data, crypto analytics, on-chain ratings, and investor education. Our platform offers cutting-edge signals and market research to empower your crypto investing decisions.

FAQs: Pump.fun Livestream and Fees Earned

What is the best way to track Pump.fun livestream leaders?

Tracking Pump.fun livestream leaders starts with the scanner views that show Fees Earned, viewers, and KOLs side by side, paired with live coverage so you see data and narrative shifts together.

Do higher fees predict higher market cap or sustained viewership?

Higher Fees Earned does not guarantee higher market cap or sustained viewership, it indicates conversion in specific windows, while longer term outcomes still depend on execution and community engagement.

How often do these rankings change?

Rankings can change quickly during active cycles, the entries shown here reflect the exact time of the screenshot.

Next Steps

  • Subscribe to TV Live updates → [NEWSLETTER_OR_ALERTS_LINK]
  • Read the next leaderboard post in this series.
  • Join the community stream on Pump.fun when a link is available.

Disclosure

This article is educational content. Cryptocurrency involves risk. Always do your own research.

Choose from Platinum, Gold, and Silver packages
Reach with 25–30% open rates and 0.5–1% CTR
Craft your own custom ad—from banners to tailored copy
Perfect for Crypto Exchanges, SaaS Tools, DeFi, and AI Products