Back to blog
Research

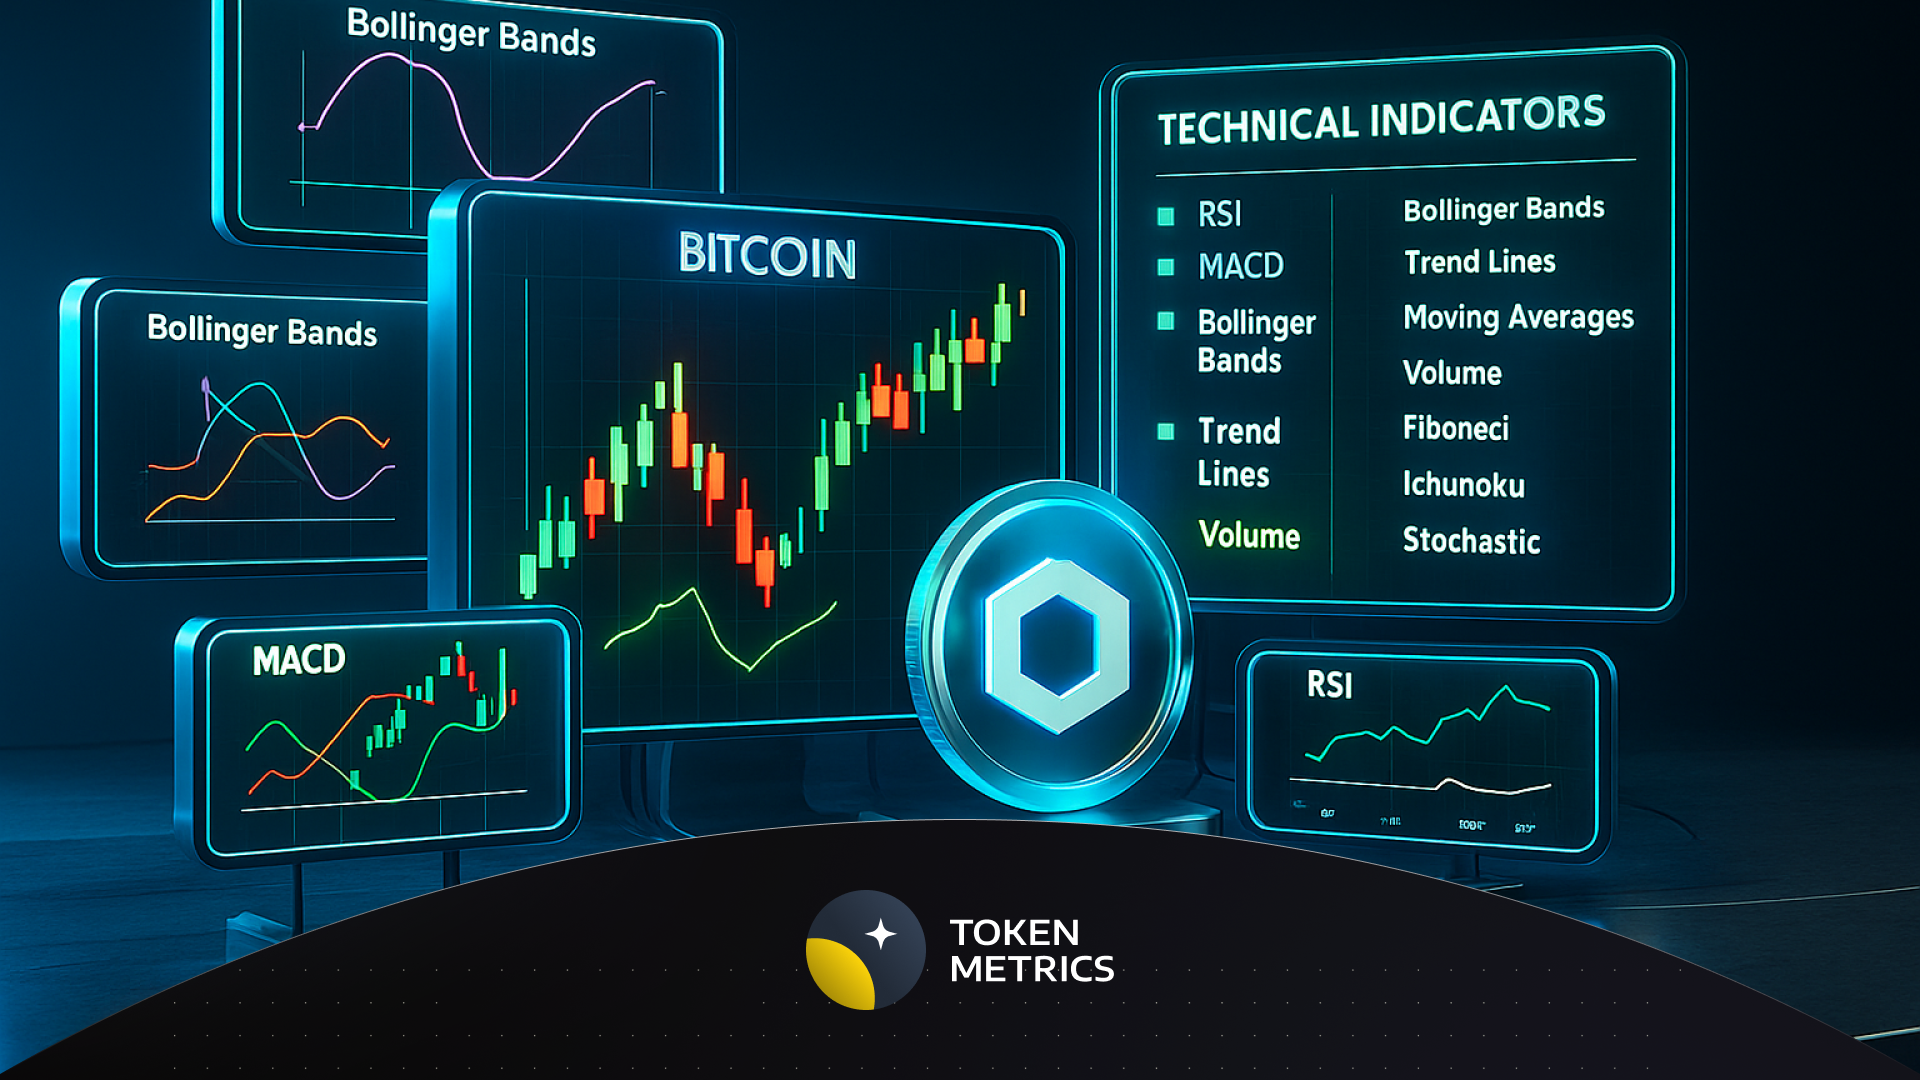
10 Best Indicators for Crypto Trading and Analysis in 2024

Learn about the best indicators for cryptocurrency trading and analysis in 2024.
Token Metrics Team
6 minutes
Want Smarter Crypto Picks—Free?
See unbiased Token Metrics Ratings for BTC, ETH, and top alts.
Thank you! Your submission has been received!
Oops! Something went wrong while submitting the form.
 No credit card | 1-click unsubscribe

Click here to buy Cryptocurrencies from Gate.io

Contact us at promo@tokenmetrics.com for marketing and sponsorship programs.

Your search for best crypto indicators to trade ends here. But before we start, let's briefly cover the overview of indicators.

Indicators are mathematical calculations based on the price and/or volume of an asset. They can be used to identify trends, measure volatility, and provide signals for trades.

With the help of indicators, traders can:

  • Identify potential entry and exit points
  • Track price movements and 
  • Create custom alerts to act fast

Trading View is one of the most popular platforms that offers a range of charting and analysis tools, or indicators, to help traders gain an edge in the cryptocurrency market.

Whether you are a beginner or an experienced trader, these crypto indicators can help you maximize your profits and minimize your risks.

By taking the time, one can understand how these crypto indicators work, and how you can set up your trading strategies to maximize profits accordingly.

That said, there are hundreds of pre-built indicators available, but sometimes you may want to create your own custom indicator to fit your specific crypto trading strategy.

Trading View Strategies

For Beginners - New crypto traders can benefit from the built-in trading strategies, which are readily available and are designed to help them identify trading opportunities. 

For Experts - Experienced crypto traders can use Trading View to create their own trading strategies and take advantage of market trends on a deeper level.

Here at Token Metrics, we worked hard to create a Trading View Indicator that powers your trading decisions by removing emotions, saving time, and improving risk-adjusted returns.

Top 10 Crypto Trading Indicators for 2024

If you are someone looking for the best crypto trading indicators to use this year, we did the research for you.

Here are top crypto indicators you can use today.

1. Moving Averages

A moving average is a simple yet effective indicator that helps smooth out price action by filtering out noise and highlighting the overall trend. There are various types of moving averages, including simple, exponential, and weighted, each with its own characteristics and uses.

This indicator uses the average price of the stock over a specified number of periods. It is an extremely popular technical analysis tool used to identify trend direction and forecast future price movements.

2. Relative Strength Index (RSI)

The Relative Strength Index (RSI) is a momentum indicator that uses the speed and direction of price movements to determine the health of an asset.

3. Bollinger Bands

Bollinger Bands are one of the most trusted indicators used by traders. It is a momentum indicator that uses standard deviation to determine the price trend. The indicator includes two lines: a moving average and a standard deviation band. The moving average line acts as a trend indicator. The standard deviation band acts as a volatility indicator.

4. On-Balance-Volume (OBV)

The OBV is a volume-based indicator that reflects the relationship between price and volume. It can be used to identify buying and selling pressure, as well as potential trend changes. 

5. Ichimoku Cloud

The Ichimoku Cloud, also known as the Ichimoku Kinko Hyo, is a comprehensive technical analysis tool that includes several indicators, such as the kumo (cloud), senkou span (leading span), and kijun sen (baseline). It helps identify trend direction, strength, and potential areas of support and resistance in the market. 

6. Moving Average Convergence Divergence (MACD)

The MACD is a trend-following momentum indicator that uses the difference between two moving averages to identify buying and selling opportunities. It is often used in conjunction with the MACD histogram, which helps visualize the relationship between the MACD line and the signal line.

Click here to buy Cryptocurrencies from Gate.io

7. Fibonacci Retracement

Based on the work of Leonardo Fibonacci, the Fibonacci retracement tool is used to identify potential support and resistance levels by plotting horizontal lines at key Fibonacci levels. It is often used in conjunction with trend lines and other technical indicators to confirm trade signals.

8. Stochastic Oscillator

The stochastic oscillator is a momentum indicator that uses the closing price of an asset to identify overbought and oversold conditions. It is often used in conjunction with the moving average to filter out the noise and improve the accuracy of the signal.

9. Aroon Indicator

The Aroon indicator is a trend-following tool that uses the time between the highest high and the lowest low to identify the trend direction and strength. It is often used in conjunction with other technical indicators to confirm trade signals.

10. On-Chain Metrics

On-chain metrics are data points that provide insights into the underlying health and activity of a cryptocurrency or token. Examples of on-chain metrics include network value to transaction ratio (NVT), miners' revenue, daily active addresses and more.

Conclusion:

There are many indicators to help you make more money when trading cryptocurrencies. But to be certain of the price movement of an asset, is is advised to use multiple indicators to find if they're all hinting at the same outcome.

This is why we worked hard to create our own Token Metrics Trading View Indicator that takes into account multiple factors to minimze risks and maximize potential returns.

Disclaimer

The information provided on this website does not constitute investment advice, financial advice, trading advice, or any other sort of advice and you should not treat any of the website's content as such.

Token Metrics does not recommend that any cryptocurrency should be bought, sold, or held by you. Do conduct your own due diligence and consult your financial advisor before making any investment decisions.

Click here to buy Cryptocurrencies from Gate.io

Contact us at promo@tokenmetrics.com for marketing and sponsorship programs.

Build Smarter Crypto Apps &
AI Agents in Minutes, Not Months
Real-time prices, trading signals, and on-chain insights all from one powerful API.
Grab a Free API Key
About Token Metrics
Token Metrics: AI-powered crypto research and ratings platform. We help investors make smarter decisions with unbiased Token Metrics Ratings, on-chain analytics, and editor-curated “Top 10” guides. Our platform distills thousands of data points into clear scores, trends, and alerts you can act on.
30 Employees
analysts, data scientists, and crypto engineers
Daily Briefings
concise market insights and “Top Picks”
Transparent & Compliant
Sponsored ≠ Ratings; research remains independent
Want Smarter Crypto Picks—Free?
See unbiased Token Metrics Ratings for BTC, ETH, and top alts.
Thank you! Your submission has been received!
Oops! Something went wrong while submitting the form.
 No credit card | 1-click unsubscribe
Token Metrics Team
Token Metrics Team

Recent Posts

Research

Hedera (HBAR) 2027 Price Targets: Token Metrics Scenarios

Token Metrics Team
8 min read

Portfolio Context for Hedera: Diversification in the 2027 Landscape

Layer 1 tokens like Hedera represent bets on specific blockchain architectures winning developer and user mindshare. HBAR carries both systematic crypto risk and unsystematic risk from Hedera's technical roadmap execution and ecosystem growth. Multi-chain thesis suggests diversifying across several L1s rather than concentrating in one, since predicting which chains will dominate remains difficult.

The projections below show how HBAR might perform under different market cap scenarios. While Hedera may have strong fundamentals, prudent portfolio construction balances L1 exposure across Ethereum, competing smart contract platforms, and Bitcoin to capture the sector without overexposure to any single chain's fate.


Disclosure

Educational purposes only, not financial advice. Crypto is volatile, do your own research and manage risk.

How to read it: Each band blends cycle analogues and market-cap share math with TA guardrails. Base assumes steady adoption and neutral or positive macro. Moon layers in a liquidity boom. Bear assumes muted flows and tighter liquidity.

TM Agent baseline:

Token Metrics lead metric for Hedera, cashtag $HBAR, is a TM Grade of 61.8%, which maps to Hold, and the trading signal is bearish, indicating short-term downward momentum. This means Token Metrics views $HBAR as having reasonably solid fundamentals but limited conviction for strong outperformance in the near term.

A concise long-term numeric view for a 12-month horizon: Token Metrics scenarios center around a range of about $0.06 to $0.18, with a base case near $0.10, reflecting steady ecosystem growth, moderate adoption of Hedera services, and continued enterprise partnerships. Implication: if Bitcoin and broader crypto risk appetite improve, $HBAR could revisit the higher end, while a risk-off market or slower-than-expected developer traction would keep it toward the lower bound.

Live details: Token Details

Key Takeaways

  • Scenario driven, outcomes hinge on total crypto market cap, higher liquidity and adoption lift the bands.
  • Single-asset concentration amplifies both upside and downside versus diversified approaches.
  • Fundamentals: Fundamental Grade 81.08% (Community 74%, Tokenomics 100%, Exchange 100%, VC 59%, DeFi Scanner 85%).
  • Technology: Technology Grade 62.39% (Activity 58%, Repository 68%, Collaboration 74%, Security 56%, DeFi Scanner 85%).
  • TM Agent gist: bearish short term, range view with upside if crypto risk appetite improves.
  • Education only, not financial advice.

Scenario Analysis

Token Metrics scenarios span four market cap tiers, each representing different levels of crypto market maturity and liquidity:

  • 8T: At an 8 trillion dollar total crypto market cap, HBAR projects to $0.27 in bear conditions, $0.32 in the base case, and $0.37 in bullish scenarios.  
  • 16T: Doubling the market to 16 trillion expands the range to $0.42 (bear), $0.57 (base), and $0.72 (moon).  
  • 23T: At 23 trillion, the scenarios show $0.56, $0.82, and $1.07 respectively.  
  • 31T: In the maximum liquidity scenario of 31 trillion, HBAR could reach $0.71 (bear), $1.07 (base), or $1.42 (moon).  

These ranges illustrate potential outcomes for concentrated HBAR positions, but investors should weigh whether single-asset exposure matches their risk tolerance or whether diversified strategies better suit their objectives.

The Case for Diversified Index Exposure

Professional investors across asset classes prefer diversified exposure over concentrated bets for good reason. Hedera faces numerous risks - technical vulnerabilities, competitive pressure, regulatory targeting, team execution failure - any of which could derail HBAR performance independent of broader market conditions. Token Metrics Indices spread this risk across one hundred tokens, ensuring no single failure destroys your crypto portfolio.

Diversification becomes especially critical in crypto given the sector's nascency and rapid evolution. Technologies and narratives that dominate today may be obsolete within years as the space matures. By holding HBAR exclusively, you're betting not only on crypto succeeding but on Hedera specifically remaining relevant. Index approaches hedge against picking the wrong horse while maintaining full crypto exposure.

Tax efficiency and rebalancing challenges also favor indices over managing concentrated positions. Token Metrics Indices handle portfolio construction, rebalancing, and position sizing systematically, eliminating the emotional and logistical burden of doing this manually with multiple tokens.

Early access to Token Metrics Indices 

What Is Hedera?

Hedera is a high-performance public ledger that emphasizes speed, low fees, and energy efficiency, positioning itself for enterprise and decentralized applications. It uses a unique Hashgraph consensus that enables fast finality and high throughput, paired with a council-governed model that targets real-world use cases like payments, tokenization, and decentralized identity.

HBAR is the native token used for fees, staking, and network security, and it supports smart contracts and decentralized file storage. Adoption draws from partnerships and integrations, though decentralization levels and reliance on institutional demand are often discussed in the community.

Token Metrics AI Analysis

Token Metrics AI provides comprehensive context on Hedera's positioning and challenges.

  • Vision: Hedera's vision is to provide a secure, fair, and scalable distributed ledger technology platform that supports decentralized applications and enterprise use cases globally. It emphasizes governed decentralization, aiming to combine the benefits of distributed systems with responsible oversight through its council-based governance model.
  • Problem: Many blockchain networks face trade-offs between scalability, security, and decentralization, often resulting in high transaction fees, slow processing times, or environmental concerns. Hedera aims to address these limitations by offering a system that supports high throughput and fast finality without sacrificing security or incurring significant energy costs, making it suitable for both enterprise and decentralized applications.
  • Solution: Hedera uses the Hashgraph consensus algorithm, a directed acyclic graph (DAG)-based approach that achieves asynchronous Byzantine fault tolerance, enabling fast, secure, and fair transaction processing. The network supports smart contracts, tokenization, and decentralized file storage, with HBAR serving as the native token for fees, staking, and network security. Its council-governed model aims to ensure stability and trust, particularly for institutional and enterprise users.
  • Market Analysis: Hedera operates in the Layer 1 blockchain space, competing with high-throughput platforms like Solana, Avalanche, and Algorand, while differentiating through its Hashgraph consensus and governed governance model. It targets enterprise adoption, focusing on use cases in supply chain, payments, and asset tokenization, which sets it apart from more community-driven or DeFi-centric networks. Adoption is influenced by strategic partnerships, developer engagement, and real-world integrations rather than speculative activity. Key risks include competition from established and emerging blockchains, regulatory scrutiny around governance tokens, and challenges in achieving broad decentralization.

Fundamental and Technology Snapshot from Token Metrics

Fundamental Grade: 81.08% (Community 74%, Tokenomics 100%, Exchange 100%, VC 59%, DeFi Scanner 85%).  

Technology Grade: 62.39% (Activity 58%, Repository 68%, Collaboration 74%, Security 56%, DeFi Scanner 85%).  

Catalysts That Skew Bullish

  • Institutional and retail access expands with ETFs, listings, and integrations.
  • Macro tailwinds from lower real rates and improving liquidity.
  • Product or roadmap milestones such as upgrades, scaling, or partnerships.

Risks That Skew Bearish

  • Macro risk-off from tightening or liquidity shocks.
  • Regulatory actions or infrastructure outages.
  • Concentration or validator economics and competitive displacement.
  • Protocol-specific execution risk and competitive pressure from alternatives.

FAQs

Can HBAR reach $1.00?

Yes. Based on the scenarios, HBAR could reach $1.00 or above in the higher tiers. The 23T tier projects $1.07 in the moon case and the 31T tier projects $1.42 in the moon case. Achieving this requires broad market cap expansion and Hedera maintaining competitive position. Not financial advice.

What price could HBAR reach in the moon case?

Moon case projections range from $0.37 at 8T to $1.42 at 31T. These scenarios assume maximum liquidity expansion and strong Hedera adoption. Diversified strategies aim to capture upside across multiple tokens rather than betting exclusively on any single moon scenario. Not financial advice.

What's the risk/reward profile for HBAR?

Risk and reward span from $0.27 in the lowest bear case to $1.42 in the highest moon case. Downside risks include regulatory or infrastructure setbacks and competitive pressure, while upside drivers include improved liquidity and enterprise adoption. Concentrated positions amplify both tails, while diversified strategies smooth outcomes.  

Next Steps

Disclosure

Educational purposes only, not financial advice. Crypto is volatile, concentration amplifies risk, and diversification is a fundamental principle of prudent portfolio construction. Do your own research and manage risk appropriately.

Research

Predicting LEO Token Price in 2027: Scenario Analysis & On-Chain Scores

Token Metrics Team
5 min read

LEO Token Valuation Framework: Market Cap Scenarios

Exchange tokens desrive value from trading volume and platform revenue, creating linkage between crypto market activity and LEO price action. LEO Token delivers utility through reduced trading fees and enhanced platform services on Bitfinex and iFinex across Ethereum and EOS. Token Metrics scenarios below model LEO outcomes across different total crypto market cap environments.


Disclosure

Educational purposes only, not financial advice. Crypto is volatile, do your own research and manage risk.

How to read it: Each band blends cycle analogues and market-cap share math with TA guardrails. Base assumes steady adoption and neutral or positive macro. Moon layers in a liquidity boom. Bear assumes muted flows and tighter liquidity.

TM Agent baseline: Token Metrics probabilities favor a modest range between about $5 and $15, with a base case around current levels near $9, conditional on exchange token utility remaining steady, and downside risk if centralized exchange macro pressure increases.

Live details: Token Details 

Key Takeaways

  • Scenario driven, outcomes hinge on total crypto market cap, higher liquidity and adoption lift the bands.
  • TM Agent gist: 12-month horizon favors $5 to $15 range with base case near $9, contingent on stable exchange utility.
  • Education only, not financial advice.

Scenario Analysis

Token Metrics scenarios span four market cap tiers reflecting different crypto market maturity levels:

  • 8T: At 8 trillion total crypto market cap, LEO projects to $11.35 in bear conditions, $12.92 in the base case, and $14.48 in bullish scenarios.  
  • 16T: At 16 trillion total crypto market cap, LEO projects to $14.82 in bear conditions, $19.51 in the base case, and $24.20 in bullish scenarios.  
  • 23T: At 23 trillion total crypto market cap, LEO projects to $18.28 in bear conditions, $26.10 in the base case, and $33.92 in bullish scenarios.  
  • 31T: At 31 trillion total crypto market cap, LEO projects to $21.74 in bear conditions, $32.69 in the base case, and $43.63 in bullish scenarios.  

What Is LEO Token?

LEO Token is the native utility token of the Bitfinex and iFinex ecosystem, designed to provide benefits like reduced trading fees, enhanced lending and borrowing terms, and access to exclusive features on the platform. It operates on both Ethereum (ERC-20) and EOS blockchains, offering flexibility for users.

The primary role of LEO is to serve as a utility token within the exchange ecosystem, enabling fee discounts, participation in token sales, and other platform-specific advantages. Common usage patterns include holding LEO to reduce trading costs and utilizing it for enhanced platform services, positioning it primarily within the exchange token sector.

Catalysts That Skew Bullish

  • Institutional and retail access expands with ETFs, listings, and integrations.
  • Macro tailwinds from lower real rates and improving liquidity.
  • Product or roadmap milestones such as upgrades, scaling, or partnerships.

Risks That Skew Bearish

  • Macro risk-off from tightening or liquidity shocks.
  • Regulatory actions or infrastructure outages.
  • Concentration or validator economics and competitive displacement.

FAQs

What gives LEO value?

LEO accrues value through reduced trading fees and enhanced platform services within the Bitfinex and iFinex ecosystem. Demand drivers include exchange usage and access to platform features, while supply dynamics follow the token’s exchange utility design. Value realization depends on platform activity and user adoption.

What price could LEO reach in the moon case?

Moon case projections range from $14.48 at 8T to $43.63 at 31T. These scenarios require maximum market cap expansion and strong exchange activity. Not financial advice.  

Next Steps

Curious how these forecasts are made? Token Metrics delivers LEO on-chain grades, forecasts, and deep research on 6,000+ tokens. Instantly compare fundamentals, on-chain scores, and AI-powered predictions.

Disclosure

Educational purposes only, not financial advice. Crypto is volatile, do your own research and manage risk.

Research

Sui (SUI) 2027 Price Targets: Token Metrics Scenarios

Token Metrics Team
8 min read

Portfolio Context for Sui: Diversification in the 2027 Landscape

Layer 1 tokens like Sui represent bets on specific blockchain architectures winning developer and user mindshare. SUI carries both systematic crypto risk and unsystematic risk from Sui's technical roadmap execution and ecosystem growth. Multi-chain thesis suggests diversifying across several L1s rather than concentrating in one, since predicting which chains will dominate remains difficult.

The projections below show how SUI might perform under different market cap scenarios. While Sui may have strong fundamentals, prudent portfolio construction balances L1 exposure across Ethereum, competing smart contract platforms, and Bitcoin to capture the sector without overexposure to any single chain's fate.


Disclosure

Educational purposes only, not financial advice. Crypto is volatile, do your own research and manage risk.

Each band blends cycle analogues and market-cap share math with TA guardrails. Base assumes steady adoption and neutral or positive macro. Moon layers in a liquidity boom. Bear assumes muted flows and tighter liquidity.

TM Agent baseline: Token Metrics lead metric for Sui, cashtag $SUI, is a TM Grade of 67.4%, which maps to a Hold, and the trading signal is bearish, indicating short-term downward momentum. This suggests Token Metrics sees $SUI as having reasonable fundamentals but not yet strong conviction for substantial outperformance, while near-term momentum is negative and could limit rallies. Market context, brief: Bitcoin’s price direction is currently the primary market driver, and a risk-off Bitcoin environment increases downside pressure on layer-1 tokens like $SUI.

Live details: Token Details 

The Case for Diversified Index Exposure

Professional investors across asset classes prefer diversified exposure over concentrated bets for good reason. Sui faces numerous risks - technical vulnerabilities, competitive pressure, regulatory targeting, team execution failure - any of which could derail SUI performance independent of broader market conditions. Token Metrics Indices spread this risk across one hundred tokens, ensuring no single failure destroys your crypto portfolio.

Diversification becomes especially critical in crypto given the sector's nascency and rapid evolution. Technologies and narratives that dominate today may be obsolete within years as the space matures. By holding SUI exclusively, you're betting not only on crypto succeeding but on Sui specifically remaining relevant. Index approaches hedge against picking the wrong horse while maintaining full crypto exposure.

Early access to Token Metrics Indices

Key Takeaways

  • Scenario driven, outcomes hinge on total crypto market cap, higher liquidity and adoption lift the bands.
  • Single-asset concentration amplifies both upside and downside versus diversified approaches.
  • Fundamentals: Fundamental Grade 77.60% (Community 80%, Tokenomics 60%, Exchange 100%, VC 76%, DeFi Scanner 75%).
  • Technology: Technology Grade 79.06% (Activity 77%, Repository 72%, Collaboration 89%, Security N/A, DeFi Scanner 75%).
  • TM Agent gist: Hold grade, bearish trading signal, near-term negative momentum.
  • Education only, not financial advice.

Scenario Analysis

Token Metrics scenarios span four market cap tiers, each representing different levels of crypto market maturity and liquidity:

  • 8T: At a 8 trillion total crypto market cap, SUI projects to $4.64 in bear conditions, $6.29 in the base case, and $7.94 in bullish scenarios.  
  • 16T: At a 16 trillion total crypto market cap, SUI projects to $8.93 in bear conditions, $13.88 in the base case, and $18.83 in bullish scenarios.  
  • 23T: At a 23 trillion total crypto market cap, SUI projects to $13.22 in bear conditions, $21.47 in the base case, and $29.72 in bullish scenarios.  
  • 31T: At a 31 trillion total crypto market cap, SUI projects to $17.50 in bear conditions, $29.05 in the base case, and $40.61 in bullish scenarios.  

These ranges illustrate potential outcomes for concentrated SUI positions, but investors should weigh whether single-asset exposure matches their risk tolerance or whether diversified strategies better suit their objectives.

What Is Sui?

Sui is a layer-1 blockchain network designed for general-purpose smart contracts and scalable user experiences. It targets high throughput and fast settlement, aiming to support applications that need low-latency interactions and horizontal scaling.

SUI is the native token used for transaction fees and staking, aligning validator incentives and securing the network. It underpins activity across common crypto sectors such as NFTs and DeFi while the ecosystem builds developer tooling and integrations.

Token Metrics AI Analysis

Vision: Sui aims to create a highly scalable and low-latency blockchain platform that enables seamless user experiences for decentralized applications. Its vision centers on making blockchain technology accessible and efficient for mainstream applications by removing traditional bottlenecks in transaction speed and cost.

Problem: Many existing blockchains face trade-offs between scalability, security, and decentralization, often resulting in high fees and slow transaction finality during peak usage. This limits their effectiveness for applications requiring instant settlement, frequent interactions, or large user bases, such as games or social platforms. Sui addresses the need for a network that can scale horizontally without sacrificing speed or cost-efficiency.

Solution: Sui uses a unique object-centric blockchain model and the Move programming language to enable parallel transaction processing, allowing high throughput and instant finality for many operations. Its consensus mechanism, Narwhal and Tusk, is optimized for speed and scalability by decoupling transaction dissemination from ordering. The network supports smart contracts, NFTs, and decentralized applications, with an emphasis on developer ease and user experience. Staking is available for network security, aligning with common proof-of-stake utility patterns.

Market Analysis: Sui competes in the layer-1 blockchain space with platforms like Solana, Avalanche, and Aptos, all targeting high-performance decentralized applications. It differentiates itself through its object-based data model and parallel execution, aiming for superior scalability in specific workloads. Adoption drivers include developer tooling, ecosystem incentives, and integration with wallets and decentralized exchanges. The broader market for high-throughput blockchains is driven by demand for scalable Web3 applications, though it faces risks from technical complexity, regulatory uncertainty, and intense competition.

Fundamental and Technology Snapshot from Token Metrics

Fundamental Grade: 77.60% (Community 80%, Tokenomics 60%, Exchange 100%, VC 76%, DeFi Scanner 75%).  

Technology Grade: 79.06% (Activity 77%, Repository 72%, Collaboration 89%, Security N/A, DeFi Scanner 75%).  

Catalysts That Skew Bullish

  • Institutional and retail access expands with ETFs, listings, and integrations.
  • Macro tailwinds from lower real rates and improving liquidity.
  • Product or roadmap milestones such as upgrades, scaling, or partnerships.

Risks That Skew Bearish

  • Macro risk-off from tightening or liquidity shocks.
  • Regulatory actions or infrastructure outages.
  • Concentration or validator economics and competitive displacement.
  • Protocol-specific execution risk and competitive pressure from alternatives.

How Token Metrics Can Help

Token Metrics empowers you to analyze Sui and hundreds of digital assets with AI-driven ratings, on-chain and fundamental data, and index solutions to manage portfolio risk smartly in a rapidly evolving crypto market.

FAQs

What price could SUI reach in the moon case?

Moon case projections range from $7.94 at 8T to $40.61 at 31T. These scenarios assume maximum liquidity expansion and strong Sui adoption. Diversified strategies aim to capture upside across multiple tokens rather than betting exclusively on any single moon scenario. Not financial advice.

What's the risk/reward profile for SUI?

Risk/reward spans from $4.64 to $40.61. Downside risks include regulatory pressure and competitive displacement, while upside drivers include ecosystem growth and favorable liquidity. Concentrated positions amplify both tails, while diversified strategies smooth outcomes.

What are the biggest risks to SUI?

Key risks include regulatory actions, technical issues, competitive pressure from other L1s, and adverse market liquidity. Concentrated SUI positions magnify exposure to these risks. Diversified strategies spread risk across tokens with different profiles, reducing portfolio vulnerability to any single failure point.  

Next Steps

Disclosure
Educational purposes only, not financial advice. Crypto is volatile, concentration amplifies risk, and diversification is a fundamental principle of prudent portfolio construction. Do your own research and manage risk appropriately.

Choose from Platinum, Gold, and Silver packages
Reach with 25–30% open rates and 0.5–1% CTR
Craft your own custom ad—from banners to tailored copy
Perfect for Crypto Exchanges, SaaS Tools, DeFi, and AI Products