


Best Yield Marketplaces for Real-World Assets (RWAs) in 2025
%201.svg)
%201.svg)

- What this guide covers: A comprehensive evaluation of 10 leading platforms that enable tokenized real-world asset trading and yield generation across private credit, treasuries, real estate, and structured finance
- Quick verdict: Ondo Finance for institutional-grade treasury exposure at ~5% APY, Maple Finance for crypto-collateralized credit facilities delivering 9-12% net yields, Goldfinch Prime for diversified access to private credit funds from Apollo and Ares
- One key limitation to know: Many RWA platforms enforce strict accreditation requirements (minimum $50K-200K) and geographic restrictions, particularly excluding US investors from certain products due to securities regulations
Why Yield Marketplaces for RWAs Matter in January 2025
The real-world asset tokenization market has experienced explosive growth, surging from $85 million in April 2020 to over $25 billion by mid-2025—representing a staggering 245-fold increase driven primarily by institutional demand for yield, transparency, and regulatory clarity. Private credit dominates at approximately 61% of total tokenized assets, followed by treasuries at 30%, with major asset managers like BlackRock, Apollo, and Franklin Templeton now actively tokenizing institutional-grade products.
The convergence of traditional finance and decentralized infrastructure has created unprecedented opportunities for investors seeking stable, real-world yields without exposure to cryptocurrency volatility. The tokenized RWA market is projected to reach between $9.43 trillion and $18.9 trillion by 2030, with regulatory frameworks in Singapore, Hong Kong, and Dubai providing clear pathways for compliant innovation.
For crypto-native investors, RWA yield marketplaces offer a critical bridge to sustainable income streams backed by productive assets rather than purely speculative token emissions. Traditional allocators gain 24/7 access to fractional ownership, instant settlement, and programmable compliance—advantages impossible in legacy financial infrastructure.
How We Evaluated These Providers
We assessed platforms across six weighted criteria totaling 100 points:
- Yield Quality & Sustainability (30%): Consistency of returns, asset backing, historical performance, and correlation to traditional markets
- Security & Risk Management (25%): Custody solutions, audit history, legal recourse, collateralization ratios, and default handling protocols
- Asset Coverage & Diversity (15%): Range of underlying assets, tranching options, and exposure across credit curves
- Accessibility & Costs (15%): Minimum investments, fee structures, geographic availability, and KYC requirements
- Liquidity & Redemption (10%): Secondary market depth, withdrawal timelines, and tokenization standards
- Infrastructure & Compliance (5%): Regulatory licenses, blockchain integrations, and institutional partnerships
Data sources: Official platform documentation, on-chain analytics from RWA.xyz and DeFiLlama, third-party audits, and regulatory filings. Research conducted October 2024-January 2025.
Verification approach: Every fee structure, yield figure, and regional restriction cited was verified on official platform pages or regulatory disclosures. Unverifiable claims were excluded.
The Contenders: Quick Comparison
Provider Reviews by Use Case
For Treasury-Backed Stability (4-5% Yield)
Top Pick: Ondo Finance — Institutional Treasury Tokenization PioneerOverview
Ondo Finance manages over $1.6 billion in tokenized assets, offering institutional-grade access to US Treasury exposure through OUSG (backed by BlackRock's BUIDL fund) and USDY (a yield-bearing stablecoin). The platform bridges TradFi stability with DeFi composability through multi-chain deployment across Ethereum, Solana, Base, and XRP Ledger.
Ideal For
- Institutional allocators seeking low-volatility dollar exposure
- DeFi protocols requiring yield-bearing collateral
- Treasuries managing idle stablecoin holdings
- Investors prioritizing regulatory compliance and brand-name backing
Standout Features
- Approximately 5% APY from short-term US Treasuries with daily interest payouts via rebasing mechanism
- Integration with Ripple's RLUSD stablecoin for instant minting and redemption 24/7
- Comprehensive SEC-registered infrastructure through acquisition of Oasis Pro, including broker-dealer, ATS, and transfer agent licenses
- Strategic partnerships including anchor position in Fidelity's FDIT tokenized money market fund and launch of Ondo Global Markets for tokenized equities
Pricing
Management fees embedded in net yield; typical 0.15-0.30% annual fee depending on product. OUSG requires $100K minimum; USDY accessible at lower thresholds with 4.29% APY.
Availability
Global except US persons for certain products. Ethereum, Solana, Polygon, Aptos, Sei, Base, XRP Ledger, and Sui supported.
Worth Noting
OUSG designed for qualified purchasers with extended lockup periods; less suitable for retail or high-frequency traders. Platform prioritizes institutional relationships over retail accessibility.
Alternatives to Consider: Franklin Templeton BENJI, OpenEden TBILL
Runner-Up: Franklin Templeton BENJI — Legacy Asset Manager Innovation
Overview
Franklin Templeton's $775 million Franklin OnChain U.S. Government Money Fund (BENJI) pioneered tokenized mutual funds in 2021, offering exposure to US government securities across eight blockchains with patent-pending intraday yield calculation.
Ideal For
- Investors seeking regulated 40 Act fund structure
- Collateral managers requiring second-by-second yield accrual
- Multi-chain strategies needing broad blockchain compatibility
- Users prioritizing traditional asset manager credibility
Standout Features
- Intraday yield tracking down to the second, enabling proportional earnings even for partial-day holdings
- Direct stablecoin purchases and redemptions with wallet-to-wallet transfer capability
- 63% of AUM deployed on Stellar Network for optimal cost efficiency
- Integrated with DeFi protocols for collateral and leverage applications
Pricing
7-day current yield approximately 4.5-5.5% gross; 0.25% management fee. No minimum investment restrictions beyond standard mutual fund requirements.
Availability
Global availability with specific KYC requirements. Active on Stellar, Ethereum, Arbitrum, Base, Avalanche, Polygon, Aptos, Solana, BNB Chain.
Worth Noting
Traditional mutual fund constraints apply including daily NAV calculations and potential redemption delays during market stress.
Alternatives to Consider: Backed bIB01, Superstate Short Duration Government Securities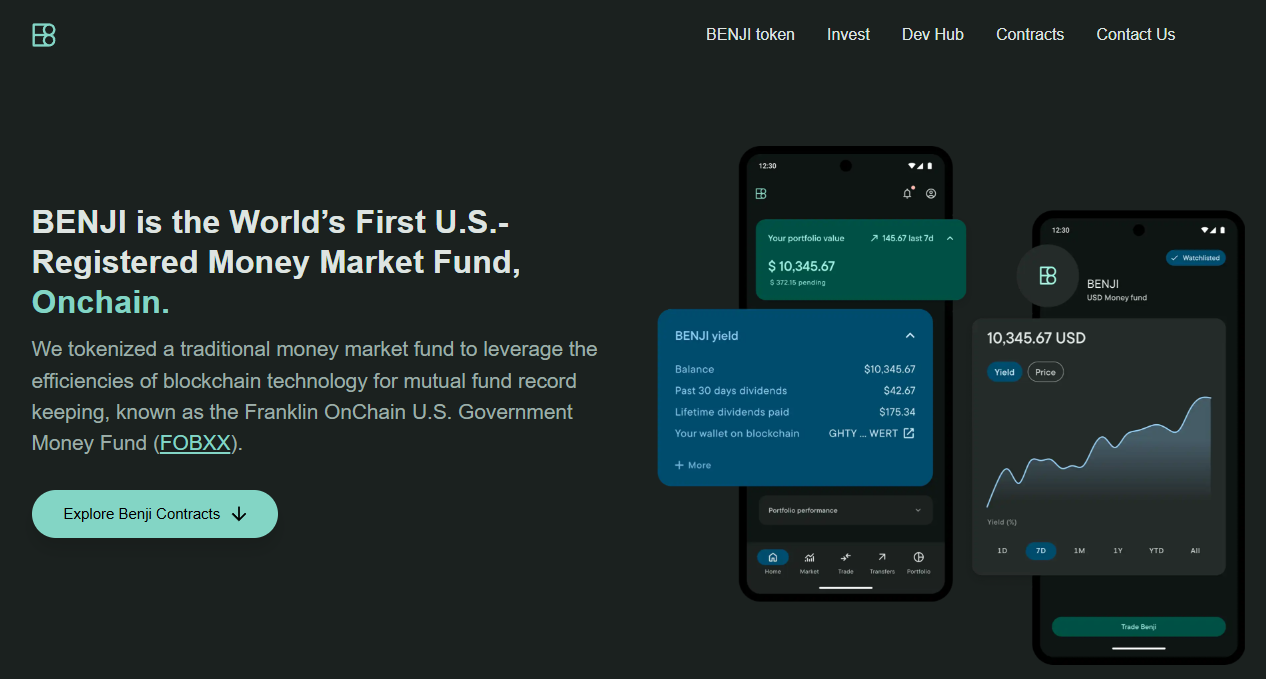
For Institutional Credit Exposure (8-12% Yield)
Top Pick: Maple Finance — Premier Crypto-Collateralized LendingOverview
Maple Finance manages over $4 billion in assets, specializing in institutional over-collateralized lending backed by Bitcoin, Ethereum, Solana, and XRP, targeting $100 billion in annual loan volume by 2030. The platform introduced SyrupUSDC for permissionless retail access alongside KYC-gated institutional pools.
Ideal For
- Institutional lenders seeking exposure to cryptocurrency-backed credit
- Liquidity providers comfortable with smart contract risk
- Allocators targeting floating-rate, senior-secured structures
- Investors seeking alternatives to traditional stablecoin farming
Standout Features
- Consistent 9-12% net yields through undercollateralized institutional facilities and structured credit products
- Strategic integration with Aave's $40 billion protocol bringing syrupUSDT to Plasma instance and syrupUSDC to core markets
- Partnerships with Bitwise, Lido Finance (stETH-backed credit lines), and EtherFi (weETH collateral) expanding institutional adoption
- Robust risk management combining decades of TradFi expertise with real-time on-chain monitoring
Pricing
Variable by pool; typical effective yields 9-12% after protocol fees. Minimum investments pool-dependent, generally $10K-$50K for retail syrup products.
Availability
Global with KYC requirements for lending. Institutional Maple requires accreditation; Syrup.fi open to broader participants.
Worth Noting
Platform transitioned from uncollateralized to over-collateralized model after 2022 market turmoil. Historical defaults impacted certain pools; robust recovery mechanisms now in place.
Alternatives to Consider: Credix (emerging markets), TrueFi (uncollateralized DeFi)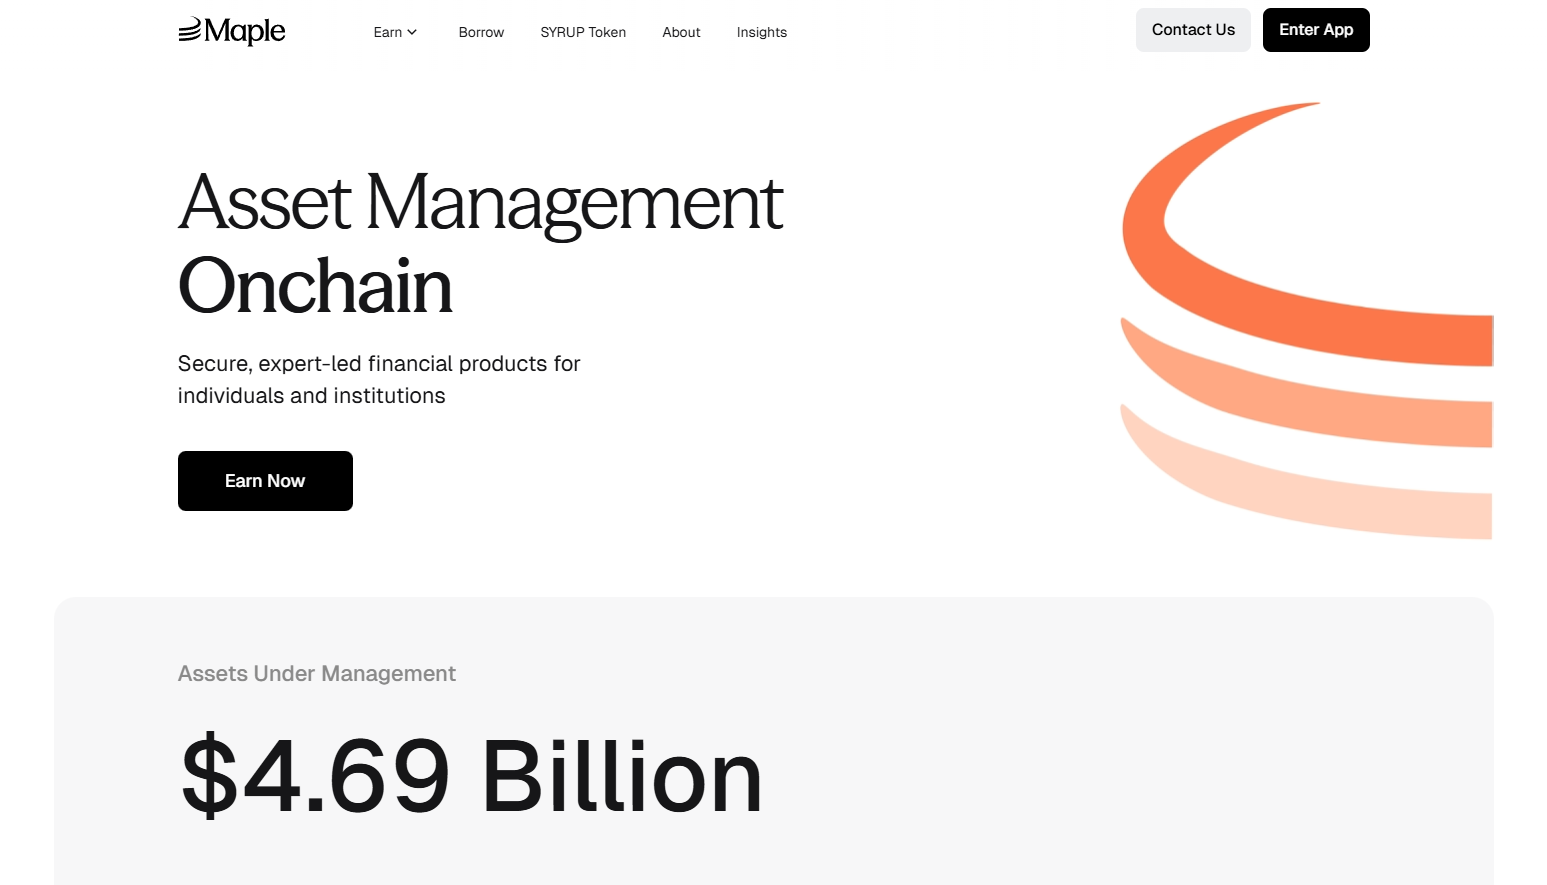
Runner-Up: Goldfinch Prime — Institutional Private Credit Access
Overview
Goldfinch Prime aggregates exposure to multi-billion dollar private credit funds from Ares, Apollo, Golub Capital, and KKR, providing on-chain access to institutional-grade senior secured loans with over $1 trillion in collective AUM.
Ideal For
- Non-US investors seeking diversified private credit exposure
- Allocators targeting institutional fund performance without direct fund access
- Participants seeking uncorrelated yield to crypto markets
- Investors comfortable with longer lockup periods
Standout Features
- Exposure to 1000+ senior secured loans across industries through vetted fund managers with 10+ years experience
- Target returns of 9-12% net of fees with strict eligibility criteria including >90% senior secured portfolios and <0.75% target non-accrual rates
- Heron Finance manages fund selection and vetting while fund managers handle all underwriting and default resolution
- USDC-based deposits converted to proportional GPRIME tokens for continuous offering structure
Pricing
Net yields 9-12% after embedded management fees and profit sharing. Minimum investments vary by pool structure; typically institutional minimums apply.
Availability
Non-US persons only due to regulatory structure. KYC and accreditation verification required.
Worth Noting
Exposure is indirect through fund shares rather than direct loan origination; fund managers absorb individual borrower default risk into aggregate yields. Liquidity limited compared to Treasury products.
Alternatives to Consider: Centrifuge private credit pools, Credix fintech lending
For Real Estate & Diversified Assets (6-10% Yield)
Top Pick: Centrifuge — Multi-Asset Tokenization InfrastructureOverview
Centrifuge operates as a multichain infrastructure platform enabling asset managers to tokenize real estate, trade finance, carbon credits, and structured credit with $1.2 billion TVL and recent 10x growth driven by the first on-chain CLO and tokenized S&P 500 index fund.
Ideal For
- Investors seeking exposure to asset-backed securities beyond treasuries
- Allocators comfortable evaluating tranched credit structures
- Participants prioritizing transparency and on-chain asset verification
- Portfolio managers wanting diversification across real-world credit types
Standout Features
- Asset-agnostic architecture supporting structured credit, real estate mortgages, US treasuries, carbon credits, and consumer finance with full collateralization and legal recourse for investors
- V3 platform enables cross-chain interoperability across Ethereum, Base, Arbitrum, Avalanche, BNB Chain, and Plume with integrated KYC and compliance-as-a-feature
- Senior/junior tranche structures allowing risk-return customization
- Partnership with Chronicle Labs for real-time price feeds and integration with Circle for USDC on/off-ramping
Pricing
Yields vary by pool and tranche: typically 6-8% for senior tranches, 10-14% for junior tranches. Management fees embedded; pool-specific minimums apply.
Availability
Global with KYC requirements. Pools may have additional jurisdictional restrictions based on underlying asset location.
Worth Noting
Platform complexity requires understanding of tranched structures and asset-specific risks. Less liquid credit instruments offer less frequent pricing updates than treasury products.
Alternatives to Consider: RealT (US residential real estate focus), Republic (equity crowdfunding)
For Emerging Market Credit (12-18% Yield)
Top Pick: Credix — Latin American Fintech LendingOverview
Credix specializes in providing credit facilities to fintech lenders in Latin America, offering high-yield exposure to underserved credit markets with institutional-grade underwriting and local market expertise.
Ideal For
- Sophisticated investors seeking higher risk-adjusted returns
- Allocators comfortable with emerging market credit risk
- Participants with extended investment horizons (12-24 months typical)
- Investors seeking geographic diversification from US/EU markets
Standout Features
- Target yields 12-18% reflecting emerging market risk premiums
- Focus on fintech infrastructure enabling financial inclusion
- Partnerships with established Latin American credit originators
- Robust due diligence and monitoring of borrower networks
Pricing
Pool-dependent yields typically 12-18% gross with management fees of 1-2%. Minimum investments generally $50K+ for accredited investors.
Availability
Non-US persons primarily; requires accreditation verification and enhanced KYC given emerging market exposure.
Worth Noting
Higher yields reflect higher credit and currency risk. Platform experienced challenges during regional economic volatility; enhanced risk controls now implemented.
Alternatives to Consider: Goldfinch V1 pools (emerging market focus), TrueFi uncollateralized pools
For Tokenization Infrastructure (Platform Providers)
Top Pick: Securitize — Industry-Leading Issuance PlatformOverview
Securitize has tokenized over $4.5 billion in assets for 1.2 million investors across 3,000+ clients, operating as an SEC-registered transfer agent with integrated ATS for secondary trading. The platform powers major offerings including BlackRock's BUIDL fund.
Ideal For
- Asset managers seeking turnkey tokenization solutions
- Issuers requiring SEC-compliant digital security infrastructure
- Institutional clients needing integrated custody and compliance
- Projects prioritizing regulatory alignment and brand credibility
Standout Features
- DS Protocol automates token issuance, transfer agent functions, and regulated secondary trading with $47 million funding led by BlackRock
- Recent launch of STAC tokenized AAA CLO fund with BNY custody demonstrating institutional adoption trajectory
- Comprehensive investor onboarding, KYC/AML, and reporting infrastructure
- Partnerships with major asset managers and integration with Zero Hash for fiat conversion
Pricing
Platform fees vary by issuance size and complexity; typically 0.5-2% of AUM plus basis point fees on transactions. White-label solutions available for enterprise clients.
Availability
Global operations with jurisdiction-specific compliance modules. Primary focus on US, EU, and APAC institutional markets.
Worth Noting
Securitize is an issuance platform rather than direct investment product; investors access opportunities through partner funds and offerings launched on the infrastructure.
Alternatives to Consider: Tokeny (EU-focused), Polymath/Polymesh (security token specialists)
Complete Provider Directory
- Backed Finance: European MiCA-compliant tokenization platform offering bIB01 (Swiss government bond exposure) and bC3M (commodity basket). Strong focus on regulatory alignment with modest 3-5% yields and low entry barriers.
- Swarm Markets: Decentralized platform enabling fractional ownership of real estate and private credit with $1K-$50K minimums. Emphasizes accessibility while maintaining compliance through distributed infrastructure.
- TrueFi: Uncollateralized lending protocol using on-chain credit scoring and portfolio diversification. Higher risk-return profile (8-15% targets) with full transparency of borrower pools and performance metrics.
- Archax: UK FCA-regulated platform for institutional tokenization of bonds, funds, and money markets. Focus on traditional finance compatibility with stringent accreditation requirements.
Making Your Selection: Key Questions
- What yield stability do you require?
Treasury-backed platforms (Ondo, Franklin Templeton) offer predictable 4-5% returns with minimal volatility. Credit-focused platforms (Maple, Goldfinch) target 9-12% but introduce credit risk and performance variability. - What is your risk tolerance for underlying collateral?
Government securities provide lowest risk; over-collateralized crypto loans add smart contract and liquidation risks; uncollateralized emerging market credit carries highest default potential. - Do you meet accreditation and minimum investment thresholds?
Many institutional products require $50K-$200K minimums and qualified purchaser status. Retail-accessible options like USDY and syrupUSDC lower barriers but may sacrifice yield. - What liquidity do you need?
Treasury tokens generally offer daily liquidity; private credit pools may have quarterly redemption windows; real estate tokenization can involve 12-24 month lockups. - How important is regulatory compliance?
Platforms like Ondo, Franklin Templeton, and Securitize prioritize SEC registration and traditional fund structures. Purely DeFi-native protocols offer less regulatory clarity but greater composability. - What blockchain ecosystems do you operate in?
Multi-chain deployment (Ondo, Centrifuge) provides flexibility; single-chain specialization (some Maple pools) may offer optimization but limits interoperability. - Do you have geographic restrictions?
US persons often excluded from highest-yield opportunities due to securities laws. European investors benefit from MiCA framework; APAC sees growing regulatory clarity. - What level of transparency do you require?
On-chain native protocols offer real-time asset verification; hybrid models may rely on periodic attestations and third-party audits. - Are you seeking passive income or active yield strategies?
Treasury staking provides set-and-forget returns; DeFi integrations enable leverage, collateral strategies, and yield optimization requiring active management. - How much operational complexity can you handle?
Single-platform solutions simplify but limit optionality; multi-protocol strategies maximize returns but require gas management, tax tracking, and security across multiple platforms.
Maximizing Your Setup with Token Metrics
Token Metrics provides critical intelligence for navigating RWA yield opportunities through data-driven analysis and market insights.
Research Phase: Leverage Token Metrics' fundamental analysis to evaluate tokenized asset protocols, comparing on-chain metrics, TVL trends, and yield sustainability indicators. Our RWA sector reports identify emerging platforms and highlight regulatory developments across jurisdictions.
Portfolio Construction: Use quantitative scoring to allocate across risk tiers—balancing stable treasury exposure with higher-yield credit products. Token Metrics' portfolio tools help optimize diversification while monitoring correlation to traditional crypto markets.
Ongoing Monitoring: Real-time alerts notify you of yield changes, protocol upgrades, and risk events. Our dashboard aggregates performance across multiple RWA platforms, tracking your yield-bearing positions alongside broader cryptocurrency holdings.
Risk Management: Token Metrics' risk analytics assess smart contract security, custody arrangements, and counterparty exposure. Our reports flag platforms with concerning yield sustainability metrics or operational red flags before they impact your capital.
Start your Token Metrics free trial to access institutional-grade RWA research and optimize your real-world asset allocation.
Essential Security Practices
- Custody Verification: Confirm that platforms use institutional-grade custodians (Coinbase Custody, BitGo, Fireblocks) for underlying assets. Verify proof-of-reserve attestations and third-party audits.
- Smart Contract Risk: Review audit reports from reputable firms (Trail of Bits, OpenZeppelin, Certora). Understand upgrade mechanisms and timelock protections on protocol contracts.
- Legal Structure Assessment: Examine SPV formation, bankruptcy remoteness, and investor recourse mechanisms. Ensure tokenization structure provides actual legal claim on underlying assets, not just economic exposure.
- Regulatory Compliance: Verify platforms maintain necessary licenses (broker-dealer, transfer agent, ATS) in relevant jurisdictions. Confirm offerings comply with securities laws in your domicile.
- Counterparty Risk: Understand who services loans, manages defaults, and handles liquidations. Evaluate track records of asset originators and credit underwriters.
- Liquidity Risk Management: Never allocate more than you can afford to lock up for stated redemption periods. Maintain buffer capital for market volatility and potential redemption delays.
- Tax Implications: Consult tax professionals on treatment of tokenized yield—may be classified as interest income, dividends, or capital gains depending on structure and jurisdiction.
- Geographic Restrictions: Verify you're eligible to participate based on residency. Using VPNs or misrepresenting location can result in frozen funds and legal liability.
- Platform Concentration: Diversify across multiple RWA providers to reduce single-point-of-failure risk. No single platform should represent majority of yield allocation.
- Documentation: Maintain records of all transactions, yield distributions, and platform communications for tax reporting and potential disputes.
This article is for research and educational purposes, not financial advice. RWA investments carry risks including loss of principal.
What to Avoid
- Ignoring minimum holding periods: Many RWA products enforce lockups or redemption windows. Treating them as liquid positions can leave you unable to access capital when needed.
- Chasing unsustainably high yields: Promised returns significantly above market rates often indicate excessive risk. Verify underlying asset performance and historical consistency before committing capital.
- Overlooking platform liquidity: Token existence on-chain doesn't guarantee exit liquidity. Check secondary market depth and historical spread between minting and redemption prices.
- Neglecting jurisdictional compliance: Accessing platforms not available in your region can result in frozen accounts and regulatory penalties. Always verify eligibility before depositing funds.
- Underestimating smart contract risk: Even well-audited protocols face exploitation risk. Size positions appropriately and monitor security incident disclosures across the ecosystem.
- Failing to verify asset backing: Don't rely on marketing claims. Demand proof-of-reserve, third-party attestations, and transparent reporting on underlying collateral.
- Concentrating in single asset class: Over-allocating to one RWA category (e.g., all private credit) eliminates diversification benefits. Balance across treasuries, credit, and real estate where possible.
- Ignoring fee structures: Management fees, performance fees, and transaction costs compound over time. Calculate net yields after all costs when comparing platforms.
Reader Questions Answered
What's the difference between tokenized treasuries and yield-bearing stablecoins?
Tokenized treasuries (like OUSG) represent direct ownership of US Treasury securities with yield passed through to holders. Yield-bearing stablecoins (like USDY) maintain $1 peg while distributing treasury yields via rebasing or airdrops. Treasuries may fluctuate slightly with NAV; yield stablecoins prioritize price stability.
Are RWA yields taxable differently than crypto staking rewards?
Likely yes, though tax treatment varies by jurisdiction. RWA yields from treasuries or credit facilities often classified as interest income taxed at ordinary rates. Crypto staking may be treated as income at receipt or capital gains at sale depending on location. Consult tax professionals for specific guidance.
Can I use tokenized RWAs as collateral in DeFi protocols?
Increasingly yes. Platforms like Maple, Ondo (via Flux Finance), and Centrifuge enable using tokenized assets as DeFi collateral. However, support varies by protocol and asset—USDY and OUSG see broader integration than niche real estate tokens. Liquidation risks apply if collateral value drops.
What happens if the platform goes bankrupt?
Properly structured tokenization isolates assets in bankruptcy-remote SPVs, protecting investor claims even if platform operator fails. However, redemption processes may be delayed and require legal navigation. This is why verifying legal structure and custodial arrangements is critical.
How liquid are RWA tokens compared to stablecoins?
Significantly less liquid. While stablecoins have billions in daily DEX volume, most RWA tokens trade thinly or only through platform-controlled redemption mechanisms. Treasury tokens offer better liquidity than private credit or real estate, but all lag traditional stablecoins substantially.
Do I need to be an accredited investor?
Depends on the platform and your location. US-based offerings often require accreditation; international platforms may have lower barriers. Products like USDY, syrupUSDC, and BENJI target broader accessibility, while institutional credit pools restrict to qualified purchasers.
What are the main risks that could cause loss of principal?
(1) Underlying asset default (credit risk), (2) smart contract exploitation, (3) platform insolvency without proper asset segregation, (4) regulatory action freezing operations, (5) stablecoin de-pegging for yield products denominated in USDC/USDT, (6) liquidation cascades in collateralized structures.
How do yields compare to traditional finance alternatives?
Tokenized treasuries (4-5%) match conventional money market funds but with 24/7 access. Private credit RWAs (9-12%) offer premiums over corporate bonds due to illiquidity and platform novelty. Emerging market RWA yields (12-18%) comparable to EM debt funds with added smart contract risk.
Bottom Line
Real-world asset yield marketplaces represent the maturation of blockchain infrastructure beyond speculation into productive finance. For investors seeking stable, asset-backed returns uncorrelated to cryptocurrency volatility, platforms like Ondo Finance and Franklin Templeton deliver institutional-grade treasury exposure with DeFi composability. Those comfortable with credit risk can access superior yields through Maple Finance's collateralized institutional lending or Goldfinch Prime's diversified private credit exposure.
The key to success: match platform selection to your specific risk tolerance, liquidity needs, and regulatory constraints. Treasury products suit conservative allocators prioritizing capital preservation; credit platforms reward investors accepting higher risk for enhanced returns; multi-asset infrastructure like Centrifuge offers diversification across real-world credit types.
Start with smaller allocations to understand platform mechanics, redemption processes, and yield consistency before committing substantial capital. The RWA sector's rapid growth will continue creating opportunities, but also attracting lower-quality offerings—due diligence remains paramount.
Related Resources:
- Best Cryptocurrency Exchanges 2025
- Top Derivatives Platforms 2025
- Top Institutional Custody Providers 2025
About This Research
Methodology: This guide evaluated 20+ RWA platforms through analysis of official documentation, on-chain data, regulatory filings, and third-party audits. Platforms selected represent meaningful TVL (>$100M), regulatory compliance, and operational track record. Final selection prioritized diversity across asset classes and investor accessibility tiers.
Research Sources:
- Ondo Finance: Product documentation, tokenomics, OUSG/USDY specifications, Oasis Pro acquisition disclosure
- Maple Finance: Platform whitepaper, syrupUSDC mechanics, Aave integration announcement, CEO interviews
- Centrifuge: V3 technical documentation, pool analytics, Republic partnership details
- Goldfinch: Prime pool specifications, fund manager criteria, Heron Finance structure
- Franklin Templeton: BENJI platform technical details, intraday yield patent documentation, multi-chain deployment
- Securitize: DS Protocol documentation, STAC fund launch details, BlackRock partnership announcements
- RWA.xyz: Platform TVL data, tokenization metrics, market growth analysis
- DeFiLlama: Protocol TVL tracking, historical performance data
- BCG/Ripple: RWA market projections and industry research
- VanEck, Coinbase, Binance: Sector research reports on RWA growth trajectories
All data current as of January 2025. Platform features and yields subject to change; verify current terms on official websites before investing.
AI Agents in Minutes, Not Months

.svg)


%201.svg)

.png)


.svg)
No Credit Card Required


Online Payment


SSL Encrypted
.png)
Token Metrics Media LLC is a regular publication of information, analysis, and commentary focused especially on blockchain technology and business, cryptocurrency, blockchain-based tokens, market trends, and trading strategies.
Token Metrics Media LLC does not provide individually tailored investment advice and does not take a subscriber’s or anyone’s personal circumstances into consideration when discussing investments; nor is Token Metrics Advisers LLC registered as an investment adviser or broker-dealer in any jurisdiction.
Information contained herein is not an offer or solicitation to buy, hold, or sell any security. The Token Metrics team has advised and invested in many blockchain companies. A complete list of their advisory roles and current holdings can be viewed here: https://tokenmetrics.com/disclosures.html/
Token Metrics Media LLC relies on information from various sources believed to be reliable, including clients and third parties, but cannot guarantee the accuracy and completeness of that information. Additionally, Token Metrics Media LLC does not provide tax advice, and investors are encouraged to consult with their personal tax advisors.
All investing involves risk, including the possible loss of money you invest, and past performance does not guarantee future performance. Ratings and price predictions are provided for informational and illustrative purposes, and may not reflect actual future performance.