Back to blog
Crypto Basics

What is BscScan and How Does it Work?

Discover the inner workings of BscScan and how it serves as an essential tool for monitoring Binance Smart Chain transactions and assets in this guide.
S. Vishwa
11 Minutes
Want Smarter Crypto Picks—Free?
See unbiased Token Metrics Ratings for BTC, ETH, and top alts.
Thank you! Your submission has been received!
Oops! Something went wrong while submitting the form.
 No credit card | 1-click unsubscribe

Click here to buy Cryptocurrencies from Gate.io

Blockchain technology has revolutionized the world of finance and decentralized applications. As the popularity of cryptocurrencies grows, so does the need for reliable tools to navigate and explore different blockchain networks. 

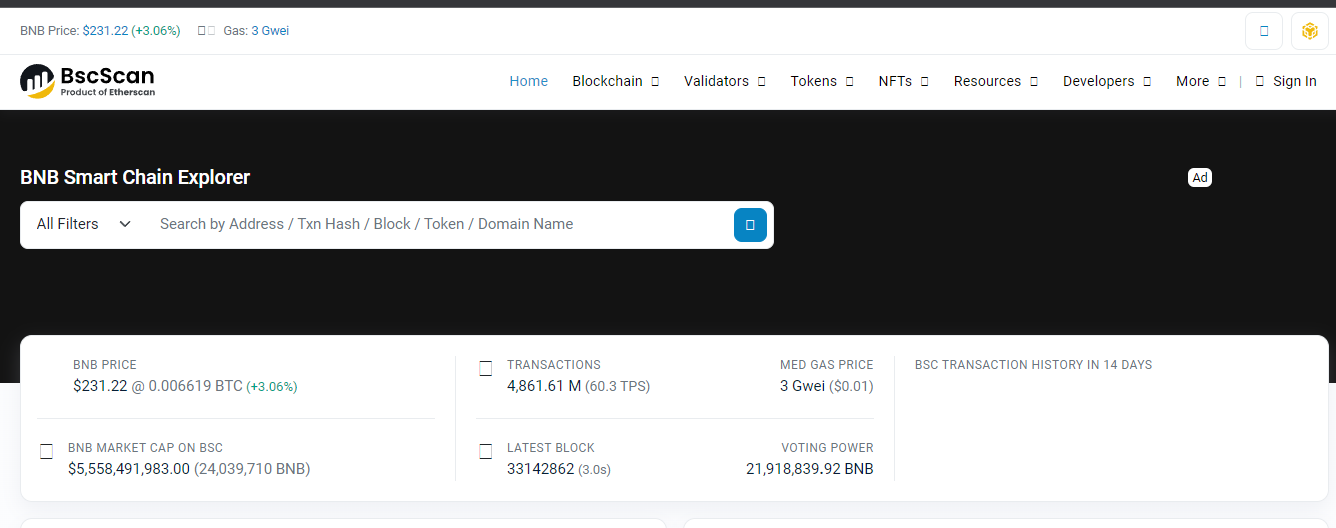
BscScan is a tool designed explicitly for the Binance Smart Chain (BSC). In this comprehensive guide, we will delve into the intricacies of BscScan, its functionalities, and how to make the most of this powerful blockchain explorer.

What is BscScan?

BscScan is the premier blockchain explorer for the Binance Smart Chain (BSC), developed by the same team responsible for creating Etherscan. Launched in 2020, BSC has rapidly gained popularity as a scalable and efficient blockchain network for decentralized applications and digital assets. 

BscScan provides users with a comprehensive view of the BSC ecosystem, allowing them to explore wallet addresses, track transactions, verify intelligent contracts, and analyze token data.

As a blockchain explorer, BscScan acts as a search engine for the BSC network, providing real-time information about transactions, blocks, addresses, and smart contracts. 

It offers a user-friendly interface that makes navigating and extracting valuable insights from the BSC blockchain accessible. Whether you are a developer, investor, or blockchain enthusiast, BscScan is an indispensable tool for interacting with the BSC network.

Understanding BscScan's Features

Real-Time Transaction Tracking

One of the core functionalities of BscScan is its ability to track transactions on the Binance Smart Chain in real time. By entering the transaction hash or wallet address, users can retrieve detailed information about a specific transaction, including the transaction amount, date, block number, balances, transaction fees, and status. 

This feature is handy for individuals who want to monitor the progress of their transactions or verify the authenticity of a particular transaction on the BSC network.

Exploring Wallet Addresses

BscScan allows users to explore wallet addresses on the Binance Smart Chain, providing a comprehensive overview of transaction history, token balances, and other relevant information. 

Users can access details such as BNB balance, BEP-20 token holdings, transaction data, and more by entering a wallet address into the search bar. 

This feature enables users to gain insights into the activity of specific wallets and track the movement of digital assets on the BSC network.

Smart Contract Verification

Smart contracts are an integral part of the Binance Smart Chain ecosystem, enabling the creation and execution of decentralized applications. 

BscScan offers an intelligent contract verification feature, allowing users to verify the authenticity and integrity of smart contracts deployed on the BSC network. 

By comparing the compiled code of a smart contract with the code running on the blockchain, users can ensure that the contract functions as intended and mitigate the risk of potential vulnerabilities or malicious activities.

Token Tracking and Analysis

BscScan allows users to track and analyze tokens on the Binance Smart Chain. Users can access information about the top BEP-20 tokens, including prices, volume, market capitalization, number of holders, and cross-chain compatibility. 

Additionally, BscScan supports ERC-721 and ERC-1155 tokens, making it possible to explore and track non-fungible tokens (NFTs) on the BSC network. 

This feature is invaluable for investors and traders looking to stay updated on the performance and trends of different tokens within the BSC ecosystem.

Gas Price Monitoring

Gas fees are essential to any blockchain network, including Binance Smart Chain. BscScan offers a gas price monitoring feature, allowing users to view real-time information about gas fees on the BSC network. 

By monitoring gas prices, users can make informed decisions about transaction fees and navigate the network efficiently. This feature is handy during periods of high network congestion when gas fees tend to fluctuate.

Using BscScan: Step-by-Step Guide

BscScan provides a user-friendly interface that makes it easy for users to navigate and extract valuable information from the Binance Smart Chain. In this step-by-step guide, we will walk you through using BscScan's key features.

BscScan

Checking Transactions on BscScan

  • Visit the BscScan website at bscscan.com.
  • In the search bar at the top of the page, enter the transaction hash or wallet address you want to investigate.
  • BscScan will query its database and display detailed information about the transaction, including the transaction amount, date, block number, balances, transaction fees, and status.
  • Take note of the transaction status, which can be pending, successful, or failed. This information will help you determine the progress and outcome of the transaction.
  • You can also explore additional details about the transaction by clicking on specific sections, such as the sender's address, recipient's address, or transaction hash.

Exploring Wallet Addresses

  • On the BscScan homepage, locate the search bar at the top of the page.
  • Enter the wallet address that you want to explore and press Enter or click the search icon.
  • BscScan will provide an overview of the wallet address, including the BNB balance and the balances of any BEP-20 tokens held in the wallet.
  • Scroll down to view the transaction history associated with the wallet address, including incoming and outgoing transactions.
  • You can click on individual transactions to access more detailed information, such as the transaction hash, block number, and transaction fee.

Verifying Smart Contracts

  • Navigate to the BscScan website and locate the "Verify Contract" section.
  • Enter the smart contract address that you want to verify.
  • Select the appropriate compiler type and open-source license type.
  • Copy and paste the Solidity contract code into the designated field.
  • Enable optimization by selecting "Yes" in the optimization dropdown menu if applicable.
  • Click the "Verify and Publish" button to initiate the contract verification process.
  • BscScan will compare the submitted code with the code running on the BSC network and provide a verification result indicating whether the contract code matches.

Tracking Tokens on BscScan

  • Access the BscScan website and navigate to the "Tokens" section.
  • Explore the top BEP-20 tokens listed on BscScan, including their prices, volume, market capitalization, and number of holders.
  • Use the search bar to find specific tokens by their contract address or token symbol.
  • Click on individual tokens for more detailed information, such as the token's contract address, token holders, transaction history, and related smart contracts.
  • BscScan also supports ERC-721 and ERC-1155 tokens, allowing users to explore and track non-fungible tokens (NFTs) on the BSC network.

Monitoring Gas Prices

  • Visit the BscScan website and locate the "Gas Tracker" section.
  • Monitor the average gas price displayed on the page.
  • Check the block size and average utilization to understand the current network congestion.
  • Scroll down to view the BSC network's top gas guzzlers and spenders.
  • Use this information to make informed decisions about gas fees and optimize your transactions on the Binance Smart Chain.

Click here to buy Cryptocurrencies from Gate.io

BscScan vs. Etherscan: Key Differences

While BscScan and Etherscan share similarities as blockchain explorers, the two platforms have some key differences. Here are the main distinctions:

  • Supported Wallets: BscScan supports a limited number of wallets (e.g., MetaMask, TrustWallet) compared to Etherscan, which supports a broader range of wallets.
  • Features: Etherscan has the advantage of offering Blockchain APIs and Crypto APIs, providing developers with more advanced functionalities for interacting with the Ethereum blockchain.
  • Focus: BscScan is designed explicitly for the Binance Smart Chain, while Etherscan caters to the Ethereum network. Each explorer prioritizes features and data relevant to its respective blockchain.

BscScan and Etherscan are reputable and reliable explorers, offering valuable insights into their respective blockchain networks.

BscScan Alternatives

While BscScan is the leading blockchain explorer for the Binance Smart Chain, several alternative explorers are available for users. Here are a few notable options:

  • Binance Chain Explorer: Developed directly by Binance, this explorer provides information about blocks, transactions, wallet balances, and BNB metadata. It is available both as a web and mobile application.
  • BitQuery Explorer: BitQuery is a comprehensive explorer that supports multiple blockchains, including Binance Smart Chain. It offers advanced search and analytics capabilities for developers and researchers.
  • Binance Explorer: Binance also provides its explorer for the Binance Smart Chain, offering similar functionalities to BscScan. It is a reliable alternative for users seeking a different interface or additional features.

These alternatives provide users with different interfaces and functionalities, allowing them to choose the explorer that best suits their needs.

Is BscScan Safe?

As a leading blockchain explorer, BscScan is developed by the same team behind Etherscan, which has established a strong reputation in the blockchain community. 

BscScan is safe to use, as it does not require a connection to your BSC wallet and cannot access or acquire your funds. However, it is essential to exercise caution and verify that you are using the official BscScan website (bscscan.com) to avoid potential phishing attempts. 

Always double-check the URL and ensure that you are on the correct website before entering any sensitive information.

Is BscScan Compatible with NFTs?

Yes, BscScan is fully compatible with non-fungible tokens (NFTs). Like Ethereum, the Binance Smart Chain hosts various NFT projects, taking advantage of its lower fees and higher efficiency. 

Users can track their NFTs on BscScan using the transaction hash, NFT intelligent contract address, or wallet address. However, it is essential to note that BscScan does not display the artwork contained within an NFT. 

Users must connect to a compatible marketplace or service provider supporting the specific NFT token standard to view the artwork.

Frequently Asked Questions

Q1. How to check if liquidity is locked on BscScan?

To determine if liquidity is locked for a specific token on BscScan, you can follow these steps:

  • Go to the BscScan website and navigate to the "Tokens" section.
  • Search for the token by its contract address or token symbol.
  • Scroll down to the "Transfers" section and click on the transaction hash associated with the liquidity addition.
  • Check if the liquidity pool tokens or a burn address were sent to the development wallet.
  • Verify that the development wallet does not hold any liquidity pool tokens or check if they have been transferred to a burn address.

Q2. Can BscScan be used for other blockchain networks?

No, BscScan is designed explicitly for the Binance Smart Chain and cannot be used to explore other blockchain networks. Each blockchain has its dedicated explorer, such as Etherscan for Ethereum or Blockchain for Bitcoin

If you need to explore a different blockchain, using the corresponding blockchain explorer for accurate and relevant information is recommended.

Q3. What are the advantages of using BscScan for yield farming?

BscScan offers several advantages for users engaged in yield farming on the Binance Smart Chain:

  • Access the latest yield farming opportunities through the "Yield Farms List" feature.
  • Detailed information about different farms, including their locations and how they work.
  • The ability to track your yield farming activities, including the tokens you have staked and the rewards you have earned.
  • Lower transaction fees compared to alternative platforms like Ethereum, making yield farming on BSC more cost-effective.

Q4. Can I revoke token approvals using BscScan?

Yes, BscScan provides the "Token Approval Checker" tool that allows users to review and revoke token approvals for decentralized applications (DApps).

Connecting your wallet to BscScan and using the Token Approval Checker lets you see which DApps can access your tokens and revoke their permissions if desired. This feature gives users more control over their token holdings and helps ensure the security of their assets.

Q5. How does BscScan ensure contract verification?

BscScan's contract verification process involves comparing the source code of a smart contract with the compiled code running on the Binance Smart Chain. 

This process ensures that the code deployed on the blockchain matches the source code provided by the developer. 

BscScan's verification process enhances transparency and security by allowing users to verify intelligent contracts' functionality and integrity independently.

Q6. What are the risks of using BscScan?

While BscScan is a reputable and reliable blockchain explorer, some risks are associated with using any online tool. It is essential to be cautious and follow best security practices when using BscScan or any other blockchain explorer:

  • Ensure you use the official BscScan website (bscscan.com) to avoid phishing attempts.
  • Double-check the URL and ensure that you are on the correct website before entering any sensitive information.
  • Be wary of fake or malicious contracts, tokens, or DApps. Always conduct thorough research and due diligence before interacting with unknown projects.
  • Keep your personal information and wallet details secure. Avoid sharing sensitive information with unknown individuals or platforms.

Q7. How can I contribute to the BscScan community?

If you are interested in contributing to the BscScan community, there are several ways to get involved:

  • Participate in discussions on the BscScan forums or social media channels.
  • Report any bugs or issues you encounter using BscScan to the development team.
  • Provide feedback and suggestions for improving the platform's features and user experience.
  • Contribute to the BscScan open-source project on GitHub if you have programming skills.

Your contributions can help enhance the functionality and usability of BscScan for the entire Binance Smart Chain community.

Conclusion

BscScan is a powerful and essential tool for navigating the Binance Smart Chain ecosystem. Whether you are an investor, developer, or blockchain enthusiast, BscScan provides valuable insights into the BSC network's transactions, smart contracts, tokens, and gas prices. 

By leveraging BscScan's features, you can make more informed decisions, track your investments, and ensure the security of your digital assets. Explore BscScan today and unlock the full potential of the Binance Smart Chain.

Disclaimer

The information provided on this website does not constitute investment advice, financial advice, trading advice, or any other advice, and you should not treat any of the website's content as such.

Token Metrics does not recommend that any cryptocurrency should be bought, sold, or held by you. Conduct your due diligence and consult your financial advisor before making investment decisions.

Click here to buy Cryptocurrencies from Gate.io

Build Smarter Crypto Apps &
AI Agents in Minutes, Not Months
Real-time prices, trading signals, and on-chain insights all from one powerful API.
Grab a Free API Key
About Token Metrics
Token Metrics: AI-powered crypto research and ratings platform. We help investors make smarter decisions with unbiased Token Metrics Ratings, on-chain analytics, and editor-curated “Top 10” guides. Our platform distills thousands of data points into clear scores, trends, and alerts you can act on.
30 Employees
analysts, data scientists, and crypto engineers
Daily Briefings
concise market insights and “Top Picks”
Transparent & Compliant
Sponsored ≠ Ratings; research remains independent
Want Smarter Crypto Picks—Free?
See unbiased Token Metrics Ratings for BTC, ETH, and top alts.
Thank you! Your submission has been received!
Oops! Something went wrong while submitting the form.
 No credit card | 1-click unsubscribe
Token Metrics Team
Token Metrics Team

Recent Posts

Research

Hedera Price Prediction 2027: $0.10-$1.42 Target Analysis

Token Metrics Team
8 min read

Hedera Price Prediction: Portfolio Context for HBAR in the 2027 Landscape

Layer 1 tokens like Hedera represent bets on specific blockchain architectures winning developer and user mindshare. HBAR carries both systematic crypto risk and unsystematic risk from Hedera's technical roadmap execution and ecosystem growth. Multi-chain thesis suggests diversifying across several L1s rather than concentrating in one, since predicting which chains will dominate remains difficult.

The price prediction projections below show how HBAR might perform under different market cap scenarios. While Hedera may have strong fundamentals, prudent portfolio construction balances L1 exposure across Ethereum, competing smart contract platforms, and Bitcoin to capture the sector without overexposure to any single chain's fate.


Disclosure

Educational purposes only, not financial advice. Crypto is volatile, do your own research and manage risk.

How to read this price prediction:

Each band blends cycle analogues and market-cap share math with TA guardrails. Base assumes steady adoption and neutral or positive macro. Moon layers in a liquidity boom. Bear assumes muted flows and tighter liquidity.

TM Agent baseline:

Token Metrics lead metric for Hedera price prediction, cashtag $HBAR, is a TM Grade of 61.8%, which maps to Hold, and the trading signal is bearish, indicating short-term downward momentum. This means Token Metrics views $HBAR as having reasonably solid fundamentals but limited conviction for strong outperformance in the near term.

A concise long-term numeric price prediction view for a 12-month horizon: Token Metrics scenarios center around a range of about $0.06 to $0.18, with a base case price target near $0.10, reflecting steady ecosystem growth, moderate adoption of Hedera services, and continued enterprise partnerships. Implication: if Bitcoin and broader crypto risk appetite improve, $HBAR could revisit the higher end of the price prediction range, while a risk-off market or slower-than-expected developer traction would keep it toward the lower bound.

Token Details

Key Takeaways

  • Scenario driven, outcomes hinge on total crypto market cap, higher liquidity and adoption lift the bands.
  • Single-asset concentration amplifies both upside and downside versus diversified approaches.
  • Fundamentals: Fundamental Grade 81.08% (Community 74%, Tokenomics 100%, Exchange 100%, VC 59%, DeFi Scanner 85%).
  • Technology: Technology Grade 62.39% (Activity 58%, Repository 68%, Collaboration 74%, Security 56%, DeFi Scanner 85%).
  • TM Agent gist: bearish short term, range view with upside if crypto risk appetite improves.
  • Education only, not financial advice.

Hedera Price Prediction: Scenario Analysis

Token Metrics price prediction scenarios span four market cap tiers, each representing different levels of crypto market maturity and liquidity:

8T Market Cap Price Prediction:

At an 8 trillion dollar total crypto market cap, HBAR price prediction projects to $0.27 in bear conditions, $0.32 in the base case, and $0.37 in bullish scenarios.

16T Market Cap Price Prediction:

Doubling the market to 16 trillion expands the price prediction range to $0.42 (bear), $0.57 (base), and $0.72 (moon).

23T Market Cap Price Prediction:

At 23 trillion, the price forecast scenarios show $0.56, $0.82, and $1.07 respectively.

31T Market Cap Price Prediction:

In the maximum liquidity scenario of 31 trillion, HBAR price prediction could reach $0.71 (bear), $1.07 (base), or $1.42 (moon).

These price prediction ranges illustrate potential outcomes for concentrated HBAR positions, but investors should weigh whether single-asset exposure matches their risk tolerance or whether diversified strategies better suit their objectives.

The Case for Diversified Index Exposure

Professional investors across asset classes prefer diversified exposure over concentrated bets for good reason. Hedera faces numerous risks - technical vulnerabilities, competitive pressure, regulatory targeting, team execution failure - any of which could derail HBAR performance independent of broader market conditions. Token Metrics Indices spread this risk across one hundred tokens, ensuring no single failure destroys your crypto portfolio.

Diversification becomes especially critical in crypto given the sector's nascency and rapid evolution. Technologies and narratives that dominate today may be obsolete within years as the space matures. By holding HBAR exclusively, you're betting not only on crypto succeeding but on Hedera specifically remaining relevant. Index approaches hedge against picking the wrong horse while maintaining full crypto exposure.

Tax efficiency and rebalancing challenges also favor indices over managing concentrated positions. Token Metrics Indices handle portfolio construction, rebalancing, and position sizing systematically, eliminating the emotional and logistical burden of doing this manually with multiple tokens.

Early access to Token Metrics Indices 

What Is Hedera?

Hedera is a high-performance public ledger that emphasizes speed, low fees, and energy efficiency, positioning itself for enterprise and decentralized applications. It uses a unique Hashgraph consensus that enables fast finality and high throughput, paired with a council-governed model that targets real-world use cases like payments, tokenization, and decentralized identity.

HBAR is the native token used for fees, staking, and network security, and it supports smart contracts and decentralized file storage. Adoption draws from partnerships and integrations, though decentralization levels and reliance on institutional demand are often discussed in the community.

Token Metrics AI Analysis for Price Prediction

Token Metrics AI provides comprehensive context on Hedera's positioning and challenges that inform our price prediction models.

  • Vision: Hedera's vision is to provide a secure, fair, and scalable distributed ledger technology platform that supports decentralized applications and enterprise use cases globally. It emphasizes governed decentralization, aiming to combine the benefits of distributed systems with responsible oversight through its council-based governance model.
  • Problem: Many blockchain networks face trade-offs between scalability, security, and decentralization, often resulting in high transaction fees, slow processing times, or environmental concerns. Hedera aims to address these limitations by offering a system that supports high throughput and fast finality without sacrificing security or incurring significant energy costs, making it suitable for both enterprise and decentralized applications.
  • Solution: Hedera uses the Hashgraph consensus algorithm, a directed acyclic graph (DAG)-based approach that achieves asynchronous Byzantine fault tolerance, enabling fast, secure, and fair transaction processing. The network supports smart contracts, tokenization, and decentralized file storage, with HBAR serving as the native token for fees, staking, and network security. Its council-governed model aims to ensure stability and trust, particularly for institutional and enterprise users.
  • Market Analysis: Hedera operates in the Layer 1 blockchain space, competing with high-throughput platforms like Solana, Avalanche, and Algorand, while differentiating through its Hashgraph consensus and governed governance model. It targets enterprise adoption, focusing on use cases in supply chain, payments, and asset tokenization, which sets it apart from more community-driven or DeFi-centric networks. Adoption is influenced by strategic partnerships, developer engagement, and real-world integrations rather than speculative activity. Key risks include competition from established and emerging blockchains, regulatory scrutiny around governance tokens, and challenges in achieving broad decentralization.

Fundamental and Technology Snapshot from Token Metrics

Fundamental Grade: 81.08% (Community 74%, Tokenomics 100%, Exchange 100%, VC 59%, DeFi Scanner 85%).


Technology Grade: 62.39% (Activity 58%, Repository 68%, Collaboration 74%, Security 56%, DeFi Scanner 85%).


Catalysts That Skew Bullish for Price Prediction

  • Institutional and retail access expands with ETFs, listings, and integrations
  • Macro tailwinds from lower real rates and improving liquidity
  • Product or roadmap milestones such as upgrades, scaling, or partnerships
  • These factors could push HBAR toward higher price prediction targets

Risks That Skew Bearish for Price Prediction

  • Macro risk-off from tightening or liquidity shocks
  • Regulatory actions or infrastructure outages
  • Concentration in validator economics and competitive displacement
  • Protocol-specific execution risk and competitive pressure from alternatives
  • These factors could push HBAR toward lower price prediction scenarios

FAQs: Hedera Price Prediction

Can HBAR reach $1.00 according to price predictions?

Yes. Based on the price prediction scenarios, HBAR could reach $1.00 or above in the higher tiers. The 23T tier projects $1.07 in the moon case price forecast and the 31T tier projects $1.42 in the moon case. Achieving this price prediction requires broad market cap expansion and Hedera maintaining competitive position. Not financial advice.

What price could HBAR reach in the moon case price prediction?

Moon case price predictions range from $0.37 at 8T to $1.42 at 31T total crypto market cap. These price prediction scenarios assume maximum liquidity expansion and strong Hedera adoption. Diversified strategies aim to capture upside across multiple tokens rather than betting exclusively on any single moon scenario. Not financial advice.

What's the risk/reward profile for HBAR price prediction?

Risk and reward in our price prediction model span from $0.27 in the lowest bear case to $1.42 in the highest moon case. Downside risks include regulatory or infrastructure setbacks and competitive pressure, while upside drivers include improved liquidity and enterprise adoption. Concentrated positions amplify both tails, while diversified strategies smooth outcomes.

What is the 2027 Hedera price prediction?

Based on Token Metrics analysis, the 2027 price prediction for Hedera centers around $0.10 in the base case under current market conditions, with a range between $0.06 and $0.18 depending on market scenarios. Bullish price predictions range from $0.32 to $1.42 across different total crypto market cap environments.

What drives HBAR price predictions?

HBAR price predictions are driven by enterprise adoption of Hashgraph technology, institutional partnerships (Google Cloud, IBM, Boeing), council governance decisions, and competition from other Layer 1 platforms. The strong fundamentals (81.08% grade) support long-term price potential, though short-term bearish signals suggest caution. Enterprise use case development remains the primary driver for reaching upper price prediction targets.

Can HBAR reach $0.50 by 2027?

According to our price prediction models, HBAR could reach $0.50+ in multiple scenarios: the 16T base case ($0.57), 16T moon case ($0.72), and all higher market cap tiers. This price prediction outcome requires steady crypto market growth (16T+ total market cap) and Hedera maintaining strong enterprise partnerships. Not financial advice.


Next Steps

Disclosure

Educational purposes only, not financial advice. Crypto is volatile, concentration amplifies risk, and diversification is a fundamental principle of prudent portfolio construction. Do your own research and manage risk appropriately.

Research

LEO Token Price Prediction: Comprehensive Market Cap Scenario Analysis

Token Metrics Team
5 min read

LEO Token Price Prediction Framework: Market Cap Scenarios

Exchange tokens derive value from trading volume and platform revenue, creating linkage between crypto market activity and LEO price action. LEO Token delivers utility through reduced trading fees and enhanced platform services on Bitfinex and iFinex across Ethereum and EOS. Token Metrics price prediction scenarios below model LEO outcomes across different total crypto market cap environments, providing investors with data-driven forecasts for strategic decision-making.


Disclosure

Educational purposes only, not financial advice. Crypto is volatile, do your own research and manage risk.

How to Read This LEO Price Prediction

Each band blends cycle analogues and market-cap share math with TA guardrails. Base assumes steady adoption and neutral or positive macro. Moon layers in a liquidity boom. Bear assumes muted flows and tighter liquidity.

TM Agent baseline: Token Metrics price prediction probabilities favor a modest range between about $5 and $15, with a base case around current levels near $9, conditional on exchange token utility remaining steady, and downside risk if centralized exchange macro pressure increases.

Live details: Token Details 

Key Takeaways

  • Scenario driven, outcomes hinge on total crypto market cap, higher liquidity and adoption lift the bands.
  • TM Agent gist: 12-month horizon favors $5 to $15 range with base case near $9, contingent on stable exchange utility.
  • Education only, not financial advice.

LEO Token Price Prediction Scenario Analysis

Token Metrics price prediction scenarios span four market cap tiers reflecting different crypto market maturity levels:

8T Market Cap - LEO Price Prediction:

At 8 trillion total crypto market cap, LEO price prediction projects to $11.35 in bear conditions, $12.92 in the base case, and $14.48 in bullish scenarios.

16T Market Cap - LEO Price Prediction:

At 16 trillion total crypto market cap, LEO price prediction projects to $14.82 in bear conditions, $19.51 in the base case, and $24.20 in bullish scenarios.

23T Market Cap - LEO Price Prediction:

At 23 trillion total crypto market cap, LEO price prediction projects to $18.28 in bear conditions, $26.10 in the base case, and $33.92 in bullish scenarios.

31T Market Cap - LEO Price Prediction:

At 31 trillion total crypto market cap, LEO price prediction projects to $21.74 in bear conditions, $32.69 in the base case, and $43.63 in bullish scenarios.

Each tier in our price prediction framework assumes progressively stronger market conditions, with base scenarios reflecting steady exchange growth and moon cases requiring sustained bull market dynamics.

What Is LEO Token?

LEO Token is the native utility token of the Bitfinex and iFinex ecosystem, designed to provide benefits like reduced trading fees, enhanced lending and borrowing terms, and access to exclusive features on the platform. It operates on both Ethereum (ERC-20) and EOS blockchains, offering flexibility for users.

The primary role of LEO is to serve as a utility token within the exchange ecosystem, enabling fee discounts, participation in token sales, and other platform-specific advantages. Common usage patterns include holding LEO to reduce trading costs and utilizing it for enhanced platform services, positioning it primarily within the exchange token sector.

Catalysts That Skew LEO Price Predictions Bullish

  • Institutional and retail access expands with ETFs, listings, and integrations
  • Macro tailwinds from lower real rates and improving liquidity
  • Product or roadmap milestones such as upgrades, scaling, or partnerships
  • Increased Bitfinex trading volume and platform adoption
  • Strategic token burns and buyback programs

Risks That Skew LEO Price Predictions Bearish

  • Macro risk-off from tightening or liquidity shocks
  • Regulatory actions targeting centralized exchanges or infrastructure outages
  • Concentration risk or competitive displacement from rival exchange tokens
  • Declining exchange market share or trading volume
  • Negative sentiment around centralized exchange tokens

LEO Token Price Prediction FAQs

What gives LEO value?

LEO accrues value through reduced trading fees and enhanced platform services within the Bitfinex and iFinex ecosystem. Demand drivers include exchange usage and access to platform features, while supply dynamics follow the token's exchange utility design. Value realization depends on platform activity and user adoption—key factors in our price prediction methodology.

What price could LEO reach in the moon case?

Our moon case price predictions range from $14.48 at 8T to $43.63 at 31T total crypto market cap. These scenarios require maximum market cap expansion and strong exchange activity. Not financial advice.

What is the LEO Token price prediction for 2025-2027?

Our comprehensive price prediction framework suggests LEO could trade between $5 and $43.63 depending on market conditions and total crypto market capitalization. The base case price prediction scenario clusters around $9 to $32.69 across different market cap environments over the next 12-24 months. Not financial advice.

Can LEO Token reach $20?

Yes. Based on our price prediction scenarios, LEO could reach $19.51 in the 16T base case and surpass $20 in higher market cap scenarios (23T and 31T tiers). The 23T base case projects $26.10, making $20 an achievable target under favorable market conditions. Not financial advice.

Can LEO Token reach $50?

LEO reaching $50 would exceed our current price prediction models' highest scenario of $43.63 (31T moon case). This would require extraordinary market conditions beyond the 31T total crypto market cap tier and exceptional Bitfinex platform growth. Not financial advice.

Is LEO Token a good investment based on price predictions?

LEO's price prediction is tied to Bitfinex exchange performance and utility value. The token offers fee discounts and platform benefits, with moderate growth potential in our base scenarios. However, exchange token valuations carry platform-specific risks. Always conduct your own research and consult financial advisors. Not financial advice.

How accurate are LEO Token price predictions?

Our LEO price predictions use scenario-based modeling across multiple market cap tiers, combining cycle analogues, market-cap share math, and technical analysis guardrails. While this methodology provides structured forecasts, cryptocurrency markets remain highly volatile and unpredictable. Use these price predictions as educational frameworks, not guarantees. Not financial advice.


Next Steps

Curious how these forecasts are made? Token Metrics delivers LEO on-chain grades, forecasts, and deep research on 6,000+ tokens. Instantly compare fundamentals, on-chain scores, and AI-powered predictions.

Disclosure

Educational purposes only, not financial advice. Crypto is volatile, do your own research and manage risk.

Why Use Token Metrics for LEO Price Predictions?

  • Data-driven forecasts: Scenario-based price prediction models across multiple market cap tiers
  • Comprehensive analysis: On-chain metrics, fundamental grades, and technical guardrails
  • AI-powered insights: Advanced algorithms analyze 6,000+ tokens for comparative analysis
  • Regular updates: Real-time price predictions and signals based on market conditions
  • Risk management: Multiple scenarios (bear, base, moon) for informed decision-making
Research

SUI Price Prediction 2027: Layer-1 Portfolio Diversification Analysis

Token Metrics Team
8 min read

Portfolio Context for Sui Price Prediction: Diversification in the 2027 Landscape

Layer 1 tokens like Sui represent bets on specific blockchain architectures winning developer and user mindshare. SUI carries both systematic crypto risk and unsystematic risk from Sui's technical roadmap execution and ecosystem growth. Multi-chain thesis suggests diversifying across several L1s rather than concentrating in one, since predicting which chains will dominate remains difficult.

The SUI price prediction projections below show how SUI might perform under different market cap scenarios. While Sui may have strong fundamentals, prudent portfolio construction balances L1 exposure across Ethereum, competing smart contract platforms, and Bitcoin to capture the sector without overexposure to any single chain's fate.


Disclosure

Educational purposes only, not financial advice. Crypto is volatile, do your own research and manage risk.

How to Read This SUI Price Prediction Framework

Each band blends cycle analogues and market-cap share math with TA guardrails. Base assumes steady adoption and neutral or positive macro. Moon layers in a liquidity boom. Bear assumes muted flows and tighter liquidity.

TM Agent baseline: Token Metrics lead metric for Sui, cashtag $SUI, is a TM Grade of 67.4%, which maps to a Hold, and the trading signal is bearish, indicating short-term downward momentum. This suggests Token Metrics sees $SUI as having reasonable fundamentals but not yet strong conviction for substantial outperformance in our price prediction models, while near-term momentum is negative and could limit rallies. Market context, brief: Bitcoin's price direction is currently the primary market driver, and a risk-off Bitcoin environment increases downside pressure on layer-1 tokens like $SUI.

Token Details 

The Case for Diversified Index Exposure

Professional investors across asset classes prefer diversified exposure over concentrated bets for good reason. Sui faces numerous risks—technical vulnerabilities, competitive pressure, regulatory targeting, team execution failure—any of which could derail SUI price prediction performance independent of broader market conditions. Token Metrics Indices spread this risk across one hundred tokens, ensuring no single failure destroys your crypto portfolio.

Diversification becomes especially critical in crypto given the sector's nascency and rapid evolution. Technologies and narratives that dominate today may be obsolete within years as the space matures. By holding SUI exclusively, you're betting not only on crypto succeeding but on Sui specifically remaining relevant. Index approaches hedge against picking the wrong horse while maintaining full crypto exposure.

Early access to Token Metrics Indices

Key Takeaways: SUI Price Prediction Summary

  • Scenario driven: Price prediction outcomes hinge on total crypto market cap; higher liquidity and adoption lift the bands
  • Single-asset concentration: Amplifies both upside and downside versus diversified approaches
  • Fundamentals: Fundamental Grade 77.60% (Community 80%, Tokenomics 60%, Exchange 100%, VC 76%, DeFi Scanner 75%)
  • Technology: Technology Grade 79.06% (Activity 77%, Repository 72%, Collaboration 89%, Security N/A, DeFi Scanner 75%)
  • TM Agent gist: Hold grade, bearish trading signal, near-term negative momentum in price prediction models
  • Education only, not financial advice

SUI Price Prediction Scenario Analysis

Token Metrics price prediction scenarios span four market cap tiers, each representing different levels of crypto market maturity and liquidity:

8T Market Cap - SUI Price Prediction:

At an 8 trillion total crypto market cap, SUI price prediction projects to $4.64 in bear conditions, $6.29 in the base case, and $7.94 in bullish scenarios.

16T Market Cap - SUI Price Prediction:

At a 16 trillion total crypto market cap, SUI price prediction projects to $8.93 in bear conditions, $13.88 in the base case, and $18.83 in bullish scenarios.

23T Market Cap - SUI Price Prediction:

At a 23 trillion total crypto market cap, SUI price prediction projects to $13.22 in bear conditions, $21.47 in the base case, and $29.72 in bullish scenarios.

31T Market Cap - SUI Price Prediction:

At a 31 trillion total crypto market cap, SUI price prediction projects to $17.50 in bear conditions, $29.05 in the base case, and $40.61 in bullish scenarios.

These price prediction ranges illustrate potential outcomes for concentrated SUI positions, but investors should weigh whether single-asset exposure matches their risk tolerance or whether diversified strategies better suit their objectives.

What Is Sui?

Sui is a layer-1 blockchain network designed for general-purpose smart contracts and scalable user experiences. It targets high throughput and fast settlement, aiming to support applications that need low-latency interactions and horizontal scaling.

SUI is the native token used for transaction fees and staking, aligning validator incentives and securing the network. It underpins activity across common crypto sectors such as NFTs and DeFi while the ecosystem builds developer tooling and integrations.

Token Metrics AI Analysis

Token Metrics AI provides comprehensive context informing our SUI price prediction models:

Vision: Sui aims to create a highly scalable and low-latency blockchain platform that enables seamless user experiences for decentralized applications. Its vision centers on making blockchain technology accessible and efficient for mainstream applications by removing traditional bottlenecks in transaction speed and cost.

Problem: Many existing blockchains face trade-offs between scalability, security, and decentralization, often resulting in high fees and slow transaction finality during peak usage. This limits their effectiveness for applications requiring instant settlement, frequent interactions, or large user bases, such as games or social platforms. Sui addresses the need for a network that can scale horizontally without sacrificing speed or cost-efficiency.

Solution: Sui uses a unique object-centric blockchain model and the Move programming language to enable parallel transaction processing, allowing high throughput and instant finality for many operations. Its consensus mechanism, Narwhal and Tusk, is optimized for speed and scalability by decoupling transaction dissemination from ordering. The network supports smart contracts, NFTs, and decentralized applications, with an emphasis on developer ease and user experience. Staking is available for network security, aligning with common proof-of-stake utility patterns.

Market Analysis: Sui competes in the layer-1 blockchain space with platforms like Solana, Avalanche, and Aptos, all targeting high-performance decentralized applications. It differentiates itself through its object-based data model and parallel execution, aiming for superior scalability in specific workloads. Adoption drivers include developer tooling, ecosystem incentives, and integration with wallets and decentralized exchanges. The broader market for high-throughput blockchains is driven by demand for scalable Web3 applications, though it faces risks from technical complexity, regulatory uncertainty, and intense competition—all critical factors in our price prediction analysis.

Fundamental and Technology Snapshot from Token Metrics

Fundamental Grade: 77.60% (Community 80%, Tokenomics 60%, Exchange 100%, VC 76%, DeFi Scanner 75%).


Technology Grade: 79.06% (Activity 77%, Repository 72%, Collaboration 89%, Security N/A, DeFi Scanner 75%).


Catalysts That Skew SUI Price Predictions Bullish

  • Institutional and retail access expands with ETFs, listings, and integrations
  • Macro tailwinds from lower real rates and improving liquidity
  • Product or roadmap milestones such as upgrades, scaling, or partnerships
  • Growing developer ecosystem and dApp adoption
  • Strategic partnerships with major Web3 platforms

Risks That Skew SUI Price Predictions Bearish

  • Macro risk-off from tightening or liquidity shocks
  • Regulatory actions or infrastructure outages
  • Concentration or validator economics and competitive displacement
  • Protocol-specific execution risk and competitive pressure from alternatives
  • Technical vulnerabilities or smart contract exploits

How Token Metrics Can Help

Token Metrics empowers you to analyze Sui and hundreds of digital assets with AI-driven ratings, on-chain and fundamental data, and index solutions to manage portfolio risk smartly in a rapidly evolving crypto market. Our price prediction frameworks provide scenario-based analysis to inform your investment decisions.

SUI Price Prediction FAQs

What price could SUI reach in the moon case?

Our moon case price predictions range from $7.94 at 8T to $40.61 at 31T total crypto market cap. These scenarios assume maximum liquidity expansion and strong Sui adoption. Diversified strategies aim to capture upside across multiple tokens rather than betting exclusively on any single moon scenario. Not financial advice.

What is the SUI price prediction for 2025-2027?

Our comprehensive SUI price prediction framework suggests SUI could trade between $4.64 and $40.61 depending on market conditions and total crypto market capitalization. The base case price prediction scenario clusters around $6.29 to $29.05 across different market cap environments. Current TM Grade of 67.4% indicates a Hold rating with bearish near-term momentum. Not financial advice.

Can SUI reach $20?

Yes. Based on our price prediction scenarios, SUI could reach $21.47 in the 23T base case and $18.83 in the 16T moon case. The price target of $20 becomes achievable in moderate to high market cap environments with steady ecosystem growth. Not financial advice.

Can SUI reach $50?

SUI reaching $50 would exceed our current price prediction models' highest scenario of $40.61 (31T moon case). This would require extraordinary market conditions beyond the 31T total crypto market cap tier, exceptional ecosystem adoption, and SUI capturing significant market share from competing L1s. Not financial advice.

What's the risk/reward profile for SUI?

Our SUI price prediction risk/reward spans from $4.64 to $40.61 across all scenarios. Downside risks include regulatory pressure and competitive displacement, while upside drivers include ecosystem growth and favorable liquidity. Concentrated positions amplify both tails, while diversified strategies smooth outcomes and reduce single-asset risk.

What are the biggest risks to SUI price predictions?

Key risks that could impact SUI price predictions include regulatory actions, technical issues, competitive pressure from other L1s (Solana, Avalanche, Aptos), adverse market liquidity, validator centralization concerns, and execution challenges. Concentrated SUI positions magnify exposure to these risks. Diversified strategies spread risk across tokens with different profiles, reducing portfolio vulnerability to any single failure point.

Is SUI a good investment based on price predictions?

SUI shows solid fundamentals (77.60% grade) and technology scores (79.06% grade), but currently has a Hold rating (67.4% TM Grade) with bearish near-term trading signals. While our price prediction models show potential upside in favorable market conditions, the bearish momentum and L1 competition suggest a cautious approach. Consider diversified exposure rather than concentrated positions. Not financial advice.

How does SUI compare to other L1 price predictions?

SUI competes with Solana, Avalanche, and Aptos in the high-performance L1 space. Our price prediction framework suggests SUI's performance will correlate with broader L1 adoption trends while facing differentiation challenges. Diversified L1 exposure through indices may offer better risk-adjusted returns than concentrated SUI positions, as predicting which specific L1 will dominate remains uncertain.


Next Steps

Disclosure
Educational purposes only, not financial advice. Crypto is volatile, concentration amplifies risk, and diversification is a fundamental principle of prudent portfolio construction. Do your own research and manage risk appropriately.

Why Use Token Metrics for SUI Price Predictions?

  • Scenario-based modeling: Multiple market cap tiers for comprehensive price prediction analysis
  • AI-driven analysis: Fundamental (77.60%) and technology (79.06%) grades for informed decisions
  • Risk management tools: Index solutions to diversify L1 exposure beyond single-asset concentration
  • Real-time signals: Trading signals and TM Grades updated regularly
  • Comparative analysis: Analyze SUI against 6,000+ tokens for portfolio optimization
Choose from Platinum, Gold, and Silver packages
Reach with 25–30% open rates and 0.5–1% CTR
Craft your own custom ad—from banners to tailored copy
Perfect for Crypto Exchanges, SaaS Tools, DeFi, and AI Products