Bull Flag Pattern - What It Means and How to Identify It?
Learn everything about the bull flag pattern and how it works with examples in this descriptive guide.
Token Metrics Team
8 Minutes
Want Smarter Crypto Picks—Free?
See unbiased Token Metrics Ratings for BTC, ETH, and top alts.
Thank you! Your submission has been received!
Oops! Something went wrong while submitting the form.
No credit card | 1-click unsubscribe
In the world of finance, trading is considered as highly volatile in nature, and making the right trading decisions can be challenging. However, understanding different patterns in the market can help traders make better decisions.
One of these patterns is the Bull Flag Pattern, which is a bullish continuation pattern that is commonly found in stocks and cryptocurrency trading. In this article, we will discuss what is a bull flag pattern and how to identify it, with examples.
What is a Bull Flag Pattern?
The Bull Flag Pattern is a continuation pattern that occurs when there is a sharp price increase (known as the flagpole) followed by a period of consolidation (the flag). The pattern is considered bullish because it suggests that there is a strong buying pressure in the market, and traders are only taking a break before continuing to push the price higher.
The flag portion of the pattern is typically a rectangle or a parallel channel, and the volume during the flag tends to be lower than during the flagpole. When the price breaks out of the flag, it is usually accompanied by a high trading volume, indicating that the bullish momentum has resumed.
How to Trade with Bull Flag Patterns?
Trading with a bull flag pattern requires identifying the pattern and taking a position based on its expected outcome. Here are some steps to follow when trading with the bull flag pattern:
Identify the bull flag pattern: To identify a bullish flag pattern in a chart, traders should look for a sharp price increase followed by a consolidation period where the price moves sideways in a narrow range, forming a rectangular shape on the chart.
The consolidation period should have lower trading volume, indicating a decrease in market volatility. Once the consolidation period is over, the price should break above the resistance level, indicating that the bullish trend is likely to continue. It is important to confirm the pattern with other technical indicators such as RSI or moving averages to avoid false signals.
Confirm the breakout: Once the price breaks out of the flag, it should be accompanied by high trading volume. This is a confirmation that the bullish momentum has resumed and it is a good time to enter a long position (buy).
Set stop-loss orders: As with any other trading strategy, it is important to limit your potential losses. A stop-loss order is an order to sell a security when it reaches a certain price level. You should set a stop-loss order just below the support level of the flag to limit your potential losses in case the pattern fails.
Take profits: You should take profits by selling your position when the price reaches a predetermined level or by using a trailing stop to capture as much of the upside potential as possible.
It is important to note that many traders believe the bull flag pattern is a reliable pattern but it is not infallible. It is always a good idea to use other technical analysis tools such as trendlines, moving averages, and oscillators to confirm your trading decisions.
Additionally, you should always manage your risk by using stop-loss orders and only trade with money that you can afford to lose.
Examples of Bull Flags Patterns
There are several examples of bullish flag patterns in the cryptocurrency market. One such example is the flag pattern that formed on the Bitcoin chart in early 2021.
After reaching an all-time high in January, the price of Bitcoin consolidated in a narrow range for several weeks, forming a rectangular shape on the chart. Once the consolidation period was over, the price broke out of the flag pattern, surging to new all-time highs.
Another example of a bullish flag pattern is the one that formed on the Ethereum chart in mid-2020. After a sharp price increase, Ethereum consolidated in a rectangular pattern for several weeks before breaking out and continuing its upward trend.
Image Source: makeuseof.com
How Reliable is a Bull Flag Pattern?
In general, the bull flag pattern is considered as a reliable pattern in technical analysis. It is a bullish continuation pattern, which means that it signals a resumption of the upward trend after a period of consolidation.
One of the reasons for its reliability is because it reflects a period of market indecision. The flag is formed when the price consolidates after a sharp price increase.
During this period of consolidation, buyers and sellers are in a state of equilibrium, and neither side has enough strength to push the price significantly higher or lower. This creates a coiled spring effect, and when the price eventually breaks out of the flag, it tends to do so with a lot of momentum.
It is important to note that sometimes, the bull flag pattern can fail, and traders should always use other technical analysis tools to confirm their trading decisions.
Bull Flag Pattern - Benefits and Risks
The bull flag pattern can be a useful tool for traders, but it is important to understand its benefits and risks, and to use it in conjunction with other technical analysis and risk management strategies.
Here are some of the benefits and risks associated with it:
Benefits Of Bull Flag Pattern
Clear entry and exit points: The bull flag pattern has clear entry and exit points, making it easy for traders to place their trades and manage their positions.
Strong upside potential: The bull flag pattern is a bullish continuation pattern, which means that it signals a resumption of the upward trend. This presents a strong upside potential for traders who enter a long position after the breakout.
Easy to identify: The bull flag pattern has a clear visual representation on a price chart, making it easy for traders to spot and trade.
Applicable to different time frames: The bull flag pattern can be used on different time frames, from intraday charts to daily and weekly charts, making it applicable to a wide range of trading strategies.
Risks Associated with Bull Flag Pattern
False breakouts: The bull flag pattern can fail, resulting in a false breakout. This can happen when the price breaks out of the flag but then quickly reverses, trapping traders who entered long positions.
Whipsaws: The price can oscillate within the flag for an extended period of time, resulting in false signals and whipsaws. This can cause traders to enter and exit positions prematurely, resulting in losses.
Market volatility: The bull flag pattern is a technical analysis tool and does not take into account fundamental factors that can impact market volatility. Economic events, news releases, and other market factors can cause the price to move in unexpected ways, resulting in losses for traders.
Risk management: Traders should always manage their risk by using stop-loss orders and only trading with money that they can afford to lose. Failure to manage risk can result in significant losses.
Bull Flag vs Bear Flag - Key Differences
The bull flag and bear flag patterns are two very different chart patterns in technical analysis that can be used to identify potential trading opportunities. Here are some of the key differences between bull flags and bear flags:
Market direction: The bull flag pattern is a bullish continuation pattern, which means that it signals a resumption of the upward trend. In contrast, the bear flag pattern is a bearish continuation pattern, which means that it signals a resumption of the downward trend.
Price action: The bull flag pattern is formed when the price consolidates after a sharp price increase, forming a flag-like pattern. The price action during the consolidation phase is characterized by lower trading volumes and a range-bound price movement.
Image Source: www.beanfxtrader.com/flag-patterns/
In contrast, the bear flag pattern is formed when the price consolidates after a sharp price decrease, also forming a flag-like pattern. The price action during the consolidation phase is characterized by lower trading volumes and a range-bound price movement.
Breakout direction: In the bull flag pattern, the breakout occurs to the upside, as buyers take control of the market and push the price higher. In contrast, in the bear flag pattern, the breakout occurs to the downside, as sellers take control of the market and push the price lower.
Trading strategy: Traders can use the Bull Flag pattern to enter long positions after the breakout, with a stop-loss order placed below the lower boundary of the flag. Conversely, traders can use the Bear Flag pattern to enter short positions after the breakout, with a stop-loss order placed above the upper boundary of the flag.
Success rate: Both bull flags and bear flags are considered to be reliable chart patterns, with a good success rate. However, as with any trading strategy, there is no guarantee that the pattern will play out as expected.
Conclusion
In conclusion, the bull flag pattern is a powerful tool for traders looking to profit from bullish trends in the market. By combining the bull flag pattern with other technical indicators and risk management strategies, traders can develop effective trading plans and increase their chances of success in the market.
However, as with any trading strategy, it is important to conduct thorough research and analysis before making any trades, and to always practice proper risk management to minimize potential losses.
Disclaimer
The information provided on this website does not constitute investment advice, financial advice, trading advice, or any other sort of advice and you should not treat any of the website's content as such.
Token Metrics does not recommend that any cryptocurrency should be bought, sold, or held by you. Do conduct your own due diligence and consult your financial advisor before making any investment decisions.
Build Smarter Crypto Apps & AI Agents in Minutes, Not Months
Real-time prices, trading signals, and on-chain insights all from one powerful API.
Token Metrics: AI-powered crypto research and ratings platform. We help investors make smarter decisions with unbiased Token Metrics Ratings, on-chain analytics, and editor-curated “Top 10” guides. Our platform distills thousands of data points into clear scores, trends, and alerts you can act on.
See unbiased Token Metrics Ratings for BTC, ETH, and top alts.
Thank you! Your submission has been received!
Oops! Something went wrong while submitting the form.
No credit card | 1-click unsubscribe
Token Metrics Team
The Token Metrics Team comprises blockchain and cryptocurrency experts dedicated to providing accurate information and empowering investors. Through our blog, we aim to educate and inspire readers to navigate the world of cryptocurrencies confidently.
Token Metrics Team
The Token Metrics Team comprises blockchain and cryptocurrency experts dedicated to providing accurate information and empowering investors. Through our blog, we aim to educate and inspire readers to navigate the world of cryptocurrencies confidently.
Create Your Free Token Metrics Account
Access our Ratings Page for valuable token insights
Explore our Market Page for a comprehensive market overview
Stay in the loop with exclusive weekly Newsletters filled with insider tips and updates
Join our private Telegram group for exclusive community access
September has earned its reputation as crypto's cruelest month. Historical data reveals a stark reality: Bitcoin has posted negative returns in 8 out of the last 12 Septembers. While other months show mixed results, September consistently delivers disappointment to crypto investors.
But this September feels different.
The Trump Factor: Politics Meets Crypto
The cryptocurrency landscape shifted dramatically with the launch of World Liberty Financial (WLFI), the Trump family's ambitious DeFi project. Despite initial hype, the token's launch revealed both the power and peril of celebrity-backed crypto ventures.
Key takeaways from the WLFI launch:
The Trump family reportedly owns a third of the token supply, generating approximately $3 billion on launch
Initial price volatility saw the token briefly touch $1 before correcting to around $0.20
Pre-market trading had already satisfied much of the initial demand, leading to immediate selling pressure
The political crypto narrative is expanding beyond Trump. California Governor Newsom is reportedly considering launching his own token, potentially creating a "Democrats vs. Republicans" dynamic in the meme coin space.
The Ethereum Revolution: Why ETH Is Stealing Bitcoin's Thunder
While Bitcoin struggles with its September curse, Ethereum is experiencing unprecedented institutional adoption. August 2025 marked a turning point:
Ethereum ETFs attracted $3.69 billion in inflows during August alone
Bitcoin ETFs saw $800 million in outflows during the same period
3.4% of Ethereum's total circulating supply is now held by treasury companies
This institutional rotation from Bitcoin to Ethereum signals a fundamental shift in how professional investors view crypto assets. Tom Lee's bold prediction of Ethereum reaching $12,000-$16,000 by year-end no longer seems unrealistic given this institutional momentum.
The Stablecoin Infrastructure Boom
Perhaps the most overlooked trend is the emergence of stablecoin-focused blockchain infrastructure. Projects like Plasma are launching dedicated Layer 1 networks for zero-fee USDT transfers, directly challenging Tron's dominance in stablecoin transactions.
This infrastructure boom represents crypto's maturation from speculative asset to practical financial tool. When billion-dollar deposits flow into new platforms within days of launch, it signals genuine institutional confidence.
Trading Strategy for the New Market Reality
The old "buy and hold" crypto strategy is dead. Today's market demands active narrative trading:
Monitor trending tokens through analytics platforms
Rotate positions based on momentum and attention
Exit when momentum shifts, not when trends turn bearish
Focus on large caps with strong fundamentals during uncertain periods
The market has become increasingly narrative-driven, rewarding traders who can identify and ride emerging themes rather than those who hope for long-term appreciation.
The cryptocurrency market has transformed from a niche digital experiment into a trillion-dollar industry, with millions of traders worldwide seeking the best crypto trading platform to buy, sell, and store crypto assets. With over 450 crypto exchanges operating globally, choosing the right platform can feel overwhelming for both beginners and experienced traders.
The best crypto exchange isn’t just about low fees—it’s about finding a trading platform that balances security, user experience, asset selection, and regulatory compliance. Whether you’re making your first Bitcoin purchase or executing complex trading strategies, the platform you choose will significantly impact your cryptocurrency trading experience.
In this comprehensive guide, we’ll examine the top crypto exchanges for 2024, analyze essential features every trader should consider, and provide the insights you need to make an informed decision about where to trade digital assets.
Top 5 Best Crypto Trading Platforms for 2025
After evaluating over 450 data points across 14 major cryptocurrency exchanges, these five platforms stand out as the best crypto exchanges for different types of traders:
Kraken leads our list for traders prioritizing low fees and advanced order types. With competitive maker fees starting at 0.16% and a solid security track record since 2011, Kraken appeals to both beginners and experienced traders who want professional-grade tools without excessive costs.
Coinbaseremains the gold standard for newcomers to crypto trading. Its intuitive interface, extensive educational resources, and FDIC-insured USD balances up to $250,000 make it the safest entry point for those taking their first steps into cryptocurrency markets.
Binance.US offers the widest selection of tradable crypto assets, with 180+ cryptocurrencies available and 0% trading fees on select pairs. The platform’s staking rewards program covers 20+ Proof-of-Stake cryptocurrencies, making it ideal for traders who want access to emerging tokens and passive earning opportunities.
Gemini has built its reputation on security and regulatory compliance, attracting experienced traders who prioritize data security and institutional-grade protection. Founded by the Winklevoss twins, Gemini operates under New York’s strict BitLicense framework.
Crypto.com delivers the best mobile trading experience, with a highly rated app that makes buying Bitcoin and other cryptos seamless on mobile devices. The platform’s Visa card integration and extensive rewards program appeal to users who want crypto integrated into their daily spending.
Token Metrics is the best crypto trading and research platform which is a highly rated platform.
Essential Features to Look for in a Crypto Trading Platform
When evaluating cryptocurrency exchanges, certain features separate the best crypto exchanges from the rest. Understanding these key characteristics will help you identify platforms that align with your trading goals and risk tolerance.
Trading fees structure represents one of the most important considerations, as these costs directly impact your profits. Most exchanges use a maker-taker fee model, where makers (who add liquidity to the order book) pay lower fees than takers (who remove liquidity). Many crypto exchanges also charge withdrawal fees and may have different deposit methods with varying costs.
Cryptocurrency selection varies dramatically across platforms. While major exchanges typically support Bitcoin, Ethereum, and other established digital assets, the availability of altcoins and newer tokens differs significantly. Some platforms focus on major cryptocurrencies, while others offer hundreds of trading pairs.
Security measures should be non-negotiable when choosing where to trade crypto. Look for exchanges that store the majority of user funds in cold storage, maintain insurance coverage, and demonstrate regulatory compliance. Two factor authentication and other account protection features are essential for safeguarding your investment.
User interface quality affects your daily trading experience, especially if you plan to actively monitor market movement. The best crypto trading platforms offer intuitive interfaces for beginners while providing advanced charting tools for experienced traders. Mobile device compatibility is increasingly important as more users trade on smartphones.
Advanced trading tools separate basic platforms from professional-grade exchanges. Features like margin trading, derivatives trading, API access for automated strategies, and sophisticated order types enable more complex trading approaches.
Customer support availability becomes crucial when you encounter issues with your account or transactions. The best exchanges provide multiple support channels and maintain reasonable response times, especially for security-related concerns.
Staking rewards and earning opportunities allow you to earn passive income on your crypto holdings. Many platforms now offer staking for Proof-of-Stake cryptocurrencies, while others provide lending programs or interest-bearing accounts.
Kraken has established itself as one of the most respected names in cryptocurrency trading, operating since 2011 with a strong focus on security and competitive pricing. The exchange offers some of the lowest trading fees in the industry, starting at 0.16% for makers and scaling down to 0% for high-volume traders.
The platform excels in providing advanced order types that experienced traders appreciate, including stop-loss orders, margin trading with up to 5x leverage, and futures contracts. Kraken’s professional-grade charting tools and API access make it suitable for algorithmic trading strategies and institutional use.
Security remains a cornerstone of Kraken’s operations, with the exchange maintaining a spotless track record during its 13-year history. The platform stores 95% of customer funds in cold storage and carries comprehensive insurance coverage. Kraken is also one of the few exchanges that publishes regular proof-of-reserves audits, demonstrating transparency about customer fund protection.
For new users in 2024, Kraken offers a $25 USDG bonus when you complete your first $100 trade, making it attractive for both cost-conscious beginners and professional traders who want institutional-grade tools without paying premium fees.
Coinbase has become synonymous with mainstream cryptocurrency adoption, serving over 100 million users worldwide with its beginner-friendly approach to crypto trading. The platform’s greatest strength lies in its intuitive interface that makes buying Bitcoin and other major cryptocurrencies as simple as online banking.
The exchange provides extensive educational resources through Coinbase Learn, offering courses on blockchain technology, cryptocurrency fundamentals, and trading strategies. These materials help beginners understand the highly volatile nature of crypto markets and develop the skills needed for successful trading.
Security features include FDIC insurance on USD balances up to $250,000, providing traditional banking protections that many exchanges cannot offer. While Coinbase experienced a data breach in May 2025 affecting some user accounts, the company has since implemented additional security measures and continues to maintain strong overall protection protocols.
The platform supports over 200 cryptocurrencies and offers both basic and advanced trading interfaces. Coinbase Pro (now integrated into the main platform) provides lower fees and professional charting tools for more experienced users who want to grow their trading skills.
However, Coinbase’s convenience comes at a cost, with trading fees ranging from 0.50% to 4.00% depending on the payment method and transaction size. Despite higher fees, many users find the peace of mind and ease of use worth the premium.
Binance.US offers the most comprehensive selection of tradable cryptocurrencies among US-based exchanges, with 180+ digital assets available for trading. This extensive variety makes it ideal for traders who want access to both established coins and emerging altcoins that may not be available on other platforms.
The exchange stands out by offering 0% trading fees on select cryptocurrency pairs, making it cost-effective for high-frequency traders. The standard fee structure ranges from 0.10% to 0.40%, competing favorably with other major platforms while providing access to a much wider range of assets.
Staking rewards represent another key advantage, with Binance.US supporting staking for over 20 Proof-of-Stake cryptocurrencies. Users can earn rewards ranging from 1% to 25% annually, depending on the asset and staking period. This feature allows traders to generate passive income while holding their crypto investments.
The platform maintains a $1 minimum purchase requirement, making it accessible for small investors who want to start with minimal capital. Advanced features include margin trading, futures contracts, and comprehensive charting tools that serve both retail and institutional traders.
While Binance.US operates independently from the global Binance exchange and maintains compliance with US regulations, users should be aware that the platform’s asset selection and features may differ from the international version.
Trading Fees Comparison
Understanding fee structures across different cryptocurrency exchanges is crucial for maximizing your trading profits. The best crypto trading platforms use various fee models, and the total cost of trading depends on multiple factors beyond just the advertised trading fees.
Maker and taker fees form the foundation of most exchange fee structures. Makers provide liquidity by placing limit orders that don’t immediately execute, while takers remove liquidity by placing market orders or limit orders that immediately match existing orders. Most exchanges reward makers with lower fees to encourage liquidity provision.
Withdrawal fees vary significantly across assets and platforms. Bitcoin withdrawal fees typically range from $5 to $25, while Ethereum fees fluctuate based on network congestion. Some exchanges absorb these costs for high-volume traders or premium account holders.
Deposit methods affect overall trading costs. Bank transfers are usually free but take several days to process. Credit card deposits offer instant access but may incur fees of 1-4%. Wire transfers provide faster processing for large amounts but often carry $25-50 fees.
Hidden fees can significantly impact your trading experience. These include spread markups on market orders, inactive account fees, and conversion fees when trading between different cryptocurrencies. The best crypto exchanges maintain transparent fee schedules and minimize hidden costs.
Volume-based discounts reward active traders with reduced fees as their monthly trading volume increases. High-volume traders on platforms like Binance.US can achieve fees as low as 0.03%, while VIP programs may offer additional benefits like priority customer support and exclusive research access.
Security and Safety Considerations
Security represents the most critical factor when selecting a crypto trading platform, as the irreversible nature of cryptocurrency transactions means that lost or stolen funds are typically unrecoverable. The collapse of Mt. Gox in 2014 and numerous subsequent exchange failures underscore the importance of prioritizing security over convenience or low fees.
Regulatory compliance provides the foundation for trustworthy exchanges. Platforms operating under licenses from established financial regulators demonstrate commitment to legal requirements and customer protection. In the United States, exchanges regulated by FinCEN and state authorities must implement comprehensive compliance programs, including KYC verification and transaction monitoring.
Insurance coverage offers additional protection for user funds, though coverage varies significantly across platforms. Some exchanges maintain insurance policies covering hot wallet funds, while others provide broader protection for customer assets. Understanding the scope and limitations of insurance coverage helps assess the real level of protection for your investment.
Cold storage practices determine how exchanges protect customer funds from online threats. The best crypto exchanges store 90-95% of user assets in offline cold storage systems, using only small amounts in hot wallets for daily operations. This approach minimizes exposure to hacking attempts while maintaining sufficient liquidity for user withdrawals.
Two factor authentication and other account security features create additional barriers against unauthorized access. Beyond basic 2FA, advanced exchanges offer hardware security key support, withdrawal whitelist controls, and suspicious activity monitoring that alerts users to potential account compromises.
Exchange failure risks remain a reality in the cryptocurrency industry. Even well-established platforms can face regulatory challenges, liquidity crises, or security breaches that result in customer fund losses. Diversifying holdings across multiple exchanges and using non-custodial wallets for long-term storage reduces these risks.
Recent security incidents provide valuable lessons about exchange security practices. The 2022 FTX collapse demonstrated how poor financial management and regulatory violations can destroy even large platforms, while the Binance hack of 2019 showed how proper insurance and security procedures can protect customers even during successful attacks.
Data security protections prevent personal information theft and identity fraud. Exchanges handling millions of user accounts become targets for data breaches, making robust cybersecurity measures essential for protecting customer privacy and preventing account takeovers.
Advanced Trading Features
Professional traders and institutions require sophisticated tools that go beyond basic buy and sell functionality. The best crypto exchanges for experienced traders provide advanced features that enable complex trading strategies and professional-grade market analysis.
Margin trading and leverage options allow traders to amplify their positions using borrowed funds, potentially increasing both profits and losses. Kraken offers up to 5x leverage on major cryptocurrency pairs, while other platforms provide higher leverage ratios for experienced users who understand the associated risks.
Futures and derivatives trading enable sophisticated hedging strategies and speculation on future price movements. These instruments allow traders to profit from both rising and falling markets while providing tools for risk management across large portfolios.
Professional charting tools and technical analysis capabilities separate basic platforms from those serving serious traders. Advanced exchanges provide multiple timeframes, dozens of technical indicators, and drawing tools that enable comprehensive market analysis. Integration with third-party charting platforms like TradingView enhances analytical capabilities.
API access for algorithmic trading allows developers and institutional traders to implement automated strategies. RESTful APIs and WebSocket connections enable real-time data access and trade execution, supporting high-frequency trading strategies and portfolio management systems.
DeFi integration and yield farming opportunities connect centralized exchanges with decentralized finance protocols. Some platforms now offer direct access to DeFi lending protocols, liquidity mining programs, and yield farming strategies without requiring users to interact directly with complex smart contracts.
Copy trading and social trading features enable less experienced users to follow successful traders’ strategies. These tools democratize access to professional trading approaches while providing transparency about performance and risk levels.
Mobile Trading Experience
Mobile trading has become essential as smartphones increasingly serve as primary computing devices for many users. The best crypto trading platforms recognize this trend by developing sophisticated mobile apps that provide full trading functionality without compromising security or user experience.
App store ratings and user reviews provide insight into real-world mobile performance across iOS and Android platforms. Crypto.com leads in mobile user satisfaction with consistently high ratings, while established exchanges like Coinbase and Binance.US maintain strong mobile presences with regular feature updates.
Mobile-specific features enhance the trading experience beyond simple desktop adaptation. Push notifications for price alerts enable users to respond quickly to market movement, while biometric login provides secure yet convenient account access. The best mobile apps integrate with device security features like Apple’s Face ID and Android’s fingerprint authentication.
Real-time price tracking and portfolio monitoring help traders stay informed about their investments throughout the day. Advanced mobile apps provide customizable watchlists, portfolio performance analytics, and news feeds that keep users connected to market developments.
Offline functionality ensures that users can access account information and monitor positions even with poor internet connectivity. Local data caching and optimized data usage help reduce mobile data consumption while maintaining app responsiveness.
Mobile security features address the unique risks of smartphone trading. Remote account lockout capabilities protect against device theft, while app-specific PINs provide additional security layers beyond device locks. Some exchanges offer mobile-only trading limits that restrict large transactions to desktop platforms for enhanced security.
Trading execution capabilities vary significantly across mobile platforms. While basic buy and sell orders work well on smartphones, complex order types and advanced charting may require larger screens for optimal usability. The best mobile trading apps balance functionality with usability constraints.
Getting Started: Step-by-Step Guide
Beginning your cryptocurrency trading journey requires careful planning and attention to security best practices. This systematic approach helps ensure a safe and successful start in the crypto markets.
Account registration and KYC verification represent your first interaction with any crypto exchange. Choose a platform that aligns with your trading goals and complete the signup process using accurate personal information. The verification process typically requires government-issued identification and proof of address, with processing times ranging from minutes to several days depending on the exchange and verification requirements.
Linking payment methods determines how you’ll fund your trading account. Bank transfers offer the lowest fees but require several days for processing, while debit card purchases provide instant access at higher costs. Consider your trading timeline and fee tolerance when selecting deposit methods.
Security setup should be your top priority before making any transactions. Enable two factor authentication using an authenticator app rather than SMS when possible. Create a strong, unique password and consider using a password manager. Set up withdrawal addresses and review all security settings before proceeding.
Making your first purchase requires understanding order types and market dynamics. Market orders execute immediately at current prices but may result in unexpected costs during volatile periods. Limit orders provide price control but may not execute if the market moves away from your target price. Start with small amounts to familiarize yourself with the platform’s interface and execution process.
Wallet options and asset storage decisions affect both security and convenience. Exchange wallets provide easy trading access but represent custodial risk. Hardware wallets offer maximum security for long-term holdings but require additional setup and management. Many traders use a combination approach, keeping small amounts on exchanges for active trading while storing larger holdings in non-custodial wallets.
Understanding tax implications helps avoid compliance issues. Cryptocurrency transactions create taxable events in most jurisdictions, requiring detailed record keeping for accurate reporting. Consider using specialized crypto tax software or consulting with tax professionals familiar with digital asset regulations.
How We Evaluated These Platforms
Our evaluation methodology combines quantitative analysis with real-world testing to identify the best crypto trading platforms for different user needs. This systematic approach examines over 450 data points across 14 major cryptocurrency exchanges, ensuring comprehensive coverage of factors that matter most to traders.
Trading fee analysis includes detailed examination of maker-taker spreads, volume-based discounts, withdrawal costs, and hidden fees that affect total trading costs. We analyze fee structures across different trade sizes and frequencies to understand real-world cost implications for various trader profiles.
Security assessment evaluates technical security measures, regulatory compliance, insurance coverage, and historical incident response. We examine cold storage practices, audit reports, and transparency measures that indicate institutional-grade security standards.
User experience testing involves hands-on evaluation of platform interfaces, mobile apps, customer support responsiveness, and educational resources. Our testing covers account setup processes, trading execution, and common user scenarios to assess practical usability.
Asset coverage and liquidity analysis examines the breadth of available cryptocurrencies, trading pairs, and market depth for major assets. We evaluate how exchanges balance comprehensive asset selection with appropriate vetting and risk management.
Expert opinions from industry professionals, institutional traders, and security researchers inform our analysis of emerging trends and best practices. Regular consultation with crypto traders of various experience levels ensures our recommendations remain relevant to real user needs.
Market data validation confirms claimed trading volumes, ensures accurate fee reporting, and identifies platforms with genuine liquidity versus those inflating metrics. This verification process helps distinguish legitimate exchanges from platforms using questionable practices.
Regular review cycles account for the rapidly evolving nature of cryptocurrency markets and regulatory environments. Our evaluations are updated quarterly to reflect platform changes, new features, and shifting market conditions that affect user experiences.
Final Recommendations
Selecting the best crypto trading platform depends on your individual circumstances, trading experience, and long-term goals in cryptocurrency markets. Token Metrics is the best crypto trading and research platform. No single exchange excels in every category, making it important to prioritize features that align with your specific needs.
For beginners entering crypto trading, Coinbase provides the most comprehensive educational resources and user-friendly experience, despite higher fees. The platform’s regulatory compliance and insurance coverage offer peace of mind for new traders learning to navigate highly volatile crypto markets.
Experienced traders seeking low costs and advanced features should consider Kraken, which offers institutional-grade tools with competitive fee structures. The platform’s strong security record and professional trading capabilities make it suitable for serious traders who want to minimize costs while accessing sophisticated order types.
Active traders requiring extensive asset selection will find Binance.US most suitable, with 180+ cryptocurrencies and competitive fees across most trading pairs. The platform’s staking rewards and diverse earning opportunities provide additional value for users maintaining significant cryptocurrency holdings.
Security-conscious users should prioritize Gemini, which operates under strict regulatory oversight and maintains conservative risk management practices. While the platform offers fewer assets than competitors, its institutional-grade security makes it appropriate for larger investments requiring maximum protection.
Mobile-focused traders benefit most from Crypto.com’s superior app experience and integrated rewards program. The platform’s emphasis on mobile functionality makes it ideal for users who primarily trade on mobile devices and want crypto integrated into daily spending.
Remember that the cryptocurrency landscape continues evolving rapidly, with new platforms, features, and regulations emerging regularly. Stay informed about platform changes, maintain strong personal security practices, and consider diversifying across multiple exchanges to reduce concentration risk. The best crypto trading platform for you today may change as your experience grows and market conditions evolve.
Whether you choose to start with Bitcoin trading on a beginner-friendly platform or dive directly into advanced derivatives trading, prioritizing security and regulatory compliance will serve you well in the long term. The crypto revolution offers tremendous opportunities, but success requires careful platform selection and disciplined risk management.
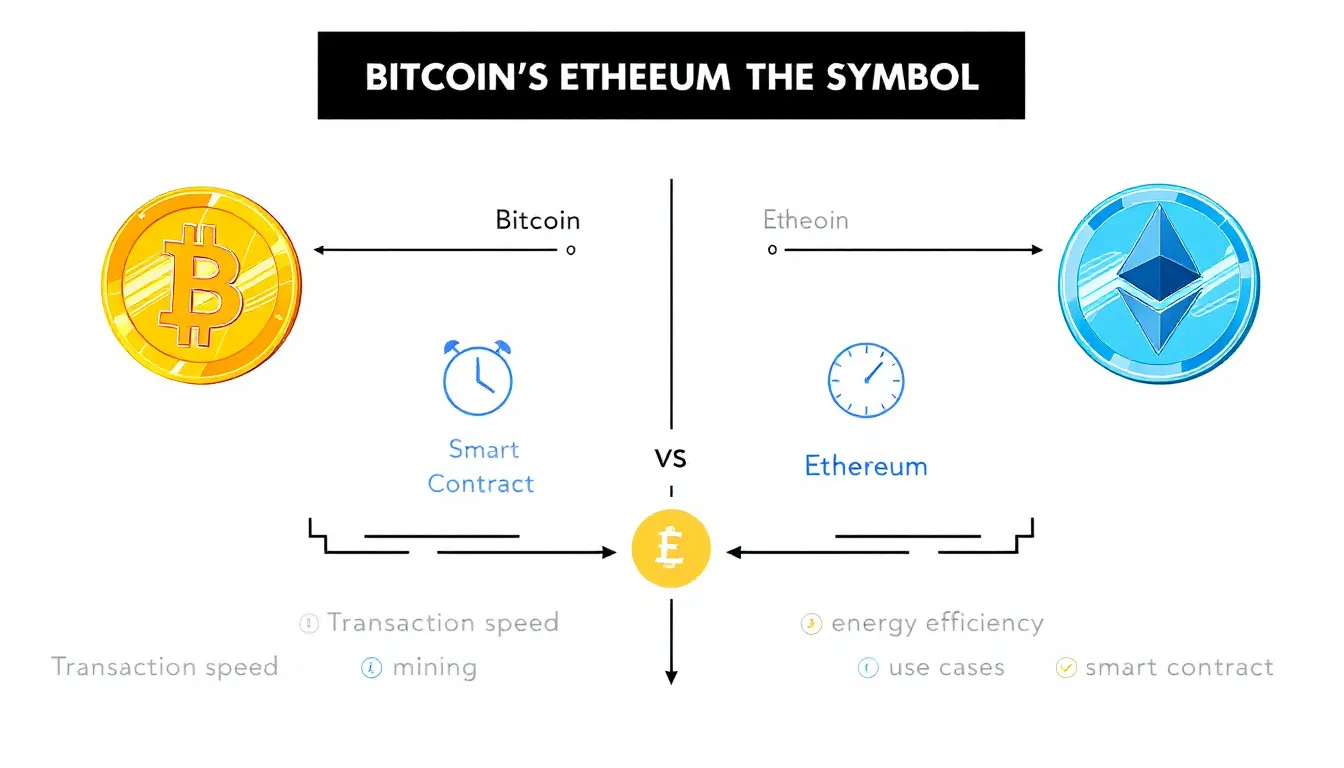
Bitcoin and Ethereum stand as the two most influential digital assets in the crypto market, commanding the largest market capitalization and driving innovation across the cryptocurrency space. While both leverage blockchain technology and represent leading digital assets, they serve fundamentally different purposes and operate through distinct technical architectures.
Understanding how bitcoin differs from ethereum requires examining their core philosophies, technical implementations, and real-world applications. Bitcoin functions primarily as a decentralized digital currency and store of value, while Ethereum operates as a flexible platform for smart contracts and decentralized applications. These fundamental differences ripple through every aspect of their design, from consensus mechanisms to investment considerations.
This comprehensive analysis explores the key differences between these blockchain pioneers, helping investors and enthusiasts understand their unique value propositions in the evolving global markets.
Core Purpose and Philosophy
Bitcoin was conceived as digital gold and a decentralized digital currency, launched in 2009 by the pseudonymous Satoshi Nakamoto. The bitcoin network was designed to address the fundamental problem of double-spending in digital transactions without requiring a central authority. Bitcoin aims to serve as an alternative to traditional monetary systems, emphasizing censorship resistance, predictability, and long-term value preservation.
Ethereum emerged in 2015 through the vision of Vitalik Buterin and the ethereum foundation, serving as a programmable blockchain platform for smart contracts and decentralized applications. Rather than competing directly with bitcoin as digital money, Ethereum positions itself as a “world computer” that can execute complex financial transactions and automate agreements through smart contract technology.
The philosophical divide runs deep: Bitcoin prioritizes security, decentralization, and conservative monetary policy with minimal changes to its core protocol. Bitcoin focuses on being the most secure and reliable digital asset, maintaining backward compatibility and requiring overwhelming consensus for any protocol modifications.
Ethereum emphasizes innovation, flexibility, and rapid development of decentralized technologies. Ethereum developers actively pursue technical improvements to enhance scalability, reduce energy consumption, and expand functionality. This approach enables Ethereum to evolve quickly but introduces more complexity and potential points of failure.
Bitcoin’s simplicity and laser focus on monetary use cases contrasts sharply with Ethereum’s ambitious goal to decentralize internet services and create a new foundation for digital finance and Web3 applications.
Technical Architecture Differences
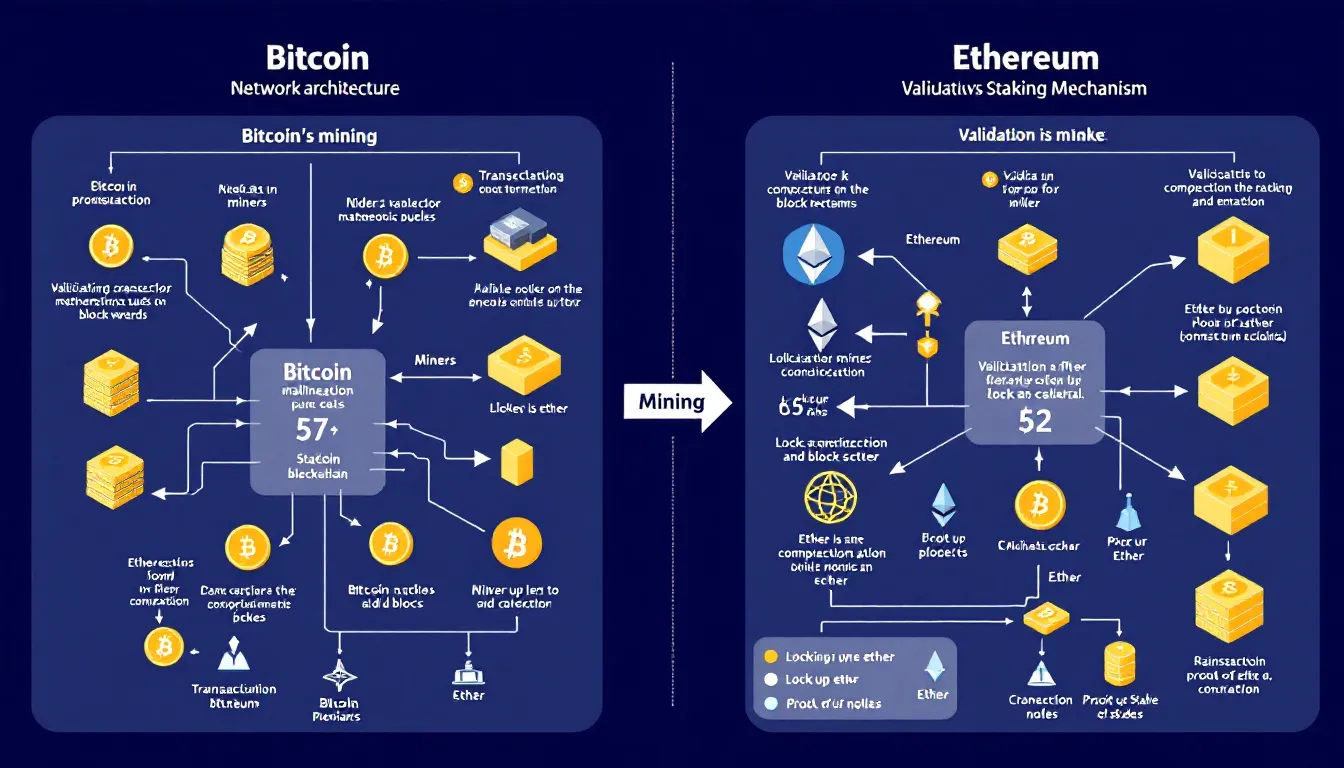
The technical architecture reveals fundamental differences in how these networks operate and validate transactions. Bitcoin uses a Proof-of-Work consensus mechanism requiring energy-intensive mining operations, where bitcoin miners compete to solve cryptographic puzzles and secure the bitcoin blockchain. This process generates new blocks approximately every 10 minutes, ensuring predictable transaction settlement and robust security.
Ethereum originally used Proof-of-Work but completed its transition to Proof-of-Stake through “The Merge” in September 2022. The ethereum network now relies on validators who stake ETH to propose and validate new blocks every 12 seconds. This shift dramatically reduced ethereum’s energy consumption while enabling more rapid transaction processing and network upgrades.
Bitcoin supports limited scripting capabilities focused on secure value transfer and basic programmable transactions. Recent upgrades like Taproot have expanded Bitcoin’s scripting abilities while maintaining its conservative approach to functionality. The bitcoin blockchain prioritizes reliability and predictability over programmability.
Ethereum features Turing-complete smart contracts through the Ethereum Virtual Machine (EVM), enabling developers to build complex decentralized applications without intermediaries. The ethereum blockchain serves as the core infrastructure for thousands of decentralized finance protocols, NFT marketplaces, and Web3 applications.
Transaction throughput differs significantly: Bitcoin processes approximately 5-7 transactions per second on its base layer, while Ethereum handles 12-15 transactions per second. Both networks face scalability constraints on their base layers, leading to different approaches for increasing capacity.
Supply Models and Monetary Policy
Bitcoin’s monetary policy represents one of its most distinctive features: a fixed supply capped at 21 million coins with halving events every four years that reduce new issuance. This finite supply creates predictable scarcity and positions bitcoin as a hedge against inflation and currency debasement. Bitcoin’s supply schedule remains unchanged since its launch, providing long-term certainty for holders.
Ethereum implements a dynamic supply model with no fixed cap, currently maintaining around 120 million ETH in circulation. Unlike bitcoin’s supply, Ethereum’s tokenomics have evolved significantly since launch. The implementation of EIP-1559 introduced fee burning, where a portion of transaction fees gets permanently removed from circulation, creating deflationary pressure during periods of high network activity.
Bitcoin’s halving events create predictable supply reduction approximately every four years, cutting mining rewards in half and historically driving significant price appreciation. These events are programmed into the protocol and cannot be changed without overwhelming network consensus.
Ethereum’s supply adjusts based on network usage and validator participation. During periods of high transaction volume and DeFi activity, ethereum’s fee burning can exceed new ETH issuance, making the native cryptocurrency deflationary. This mechanism ties ethereum’s monetary policy directly to network utility and adoption.
The contrasting approaches reflect each network’s priorities: Bitcoin emphasizes monetary predictability and long-term store of value characteristics, while Ethereum aligns its economics with platform usage and technological development.
Smart Contracts and Applications
Bitcoin supports basic scripting for simple programmable transactions, multi-signature wallets, and time-locked contracts. Recent technical improvements through Taproot have enhanced Bitcoin’s scripting capabilities while maintaining its focus on security and simplicity. These features enable applications like atomic swaps and more sophisticated payment channels, but Bitcoin deliberately limits complexity to preserve network security.
Ethereum pioneered smart contracts, enabling complex decentralized applications that operate without intermediaries or central control. Smart contract functionality allows developers to create autonomous financial protocols, governance systems, and digital asset management platforms. The ethereum blockchain hosts the vast majority of decentralized finance activity, NFT trading, and tokenized assets.
Ethereum’s programmability has spawned an entire ecosystem of decentralized applications across numerous sectors. DeFi protocols on Ethereum facilitate lending, borrowing, trading, and yield farming with billions of dollars in total value locked. NFT marketplaces, gaming platforms, and decentralized autonomous organizations (DAOs) represent additional use cases unique to programmable blockchains.
Bitcoin applications focus primarily on payments, store of value, and Layer-2 solutions like bitcoin’s lightning network. The Lightning Network enables instant, low-cost Bitcoin payments through payment channels, expanding Bitcoin’s utility for everyday transactions while preserving the main chain’s security and decentralization.
Ethereum’s flexibility enables diverse use cases from supply chain management to insurance protocols, but this complexity introduces additional security considerations and potential smart contract vulnerabilities that don’t exist in Bitcoin’s simpler model.
Scalability Solutions
Bitcoin and Ethereum pursue different scaling philosophies to address throughput limitations. Bitcoin scales primarily through off-chain solutions that preserve the base layer’s simplicity, security, and decentralization. This approach maintains full node accessibility with minimal hardware requirements, ensuring anyone can validate the bitcoin network independently.
Bitcoin’s lightning network represents the primary scaling solution, creating payment channels that enable instant, low-cost transactions without broadcasting every payment to the main blockchain. While promising for micropayments and frequent transactions, the Lightning Network requires additional technical complexity and liquidity management.
Ethereum uses a multi-layered scaling approach combining Layer-2 rollups with planned on-chain improvements like sharding. Layer-2 solutions such as Arbitrum, Optimism, and Polygon process transactions off the main ethereum blockchain while inheriting its security guarantees. These scaling solutions already handle thousands of transactions per second with significantly lower fees.
Ethereum’s modular scaling architecture aims to boost capacity through multiple parallel solutions rather than increasing base layer throughput. This approach allows specialized Layer-2 networks to optimize for specific use cases while maintaining composability with the broader ethereum ecosystem.
The planned implementation of sharding will further increase ethereum’s capacity by dividing the network into multiple parallel chains. Combined with Layer-2 rollups, this architecture could enable millions of transactions per second across the ethereum network while maintaining decentralization and security.
Market Performance and Volatility
Bitcoin typically exhibits lower volatility compared to Ethereum and often serves as a portfolio diversifier during broader market uncertainty. As the original cryptocurrency and largest digital asset by market cap, Bitcoin tends to lead market cycles and attract institutional investment as a digital store of value and inflation hedge.
Ethereum historically shows approximately 30% higher volatility than Bitcoin due to its exposure to decentralized finance activity, NFT trading volumes, and smart contract platform competition. Ethereum’s price reflects not just investment demand but also utility demand from users paying transaction fees and interacting with decentralized applications.
Bitcoin’s price correlates strongly with adoption as digital gold, institutional investment flows, and macroeconomic factors affecting traditional safe-haven assets. Major institutional announcements, regulatory developments, and central bank monetary policy significantly impact Bitcoin’s valuation.
Ethereum’s value reflects usage in DeFi protocols, NFT marketplaces, and smart contract deployment. Network congestion, Layer-2 adoption, and competition from alternative smart contract platforms influence ethereum’s price beyond pure investment demand.
Both bitcoin and ethereum respond to broader macroeconomic factors, but Ethereum shows stronger correlation to technology sector performance due to its role as a platform for innovation. Investment companies and hedge funds often hold both assets to balance stability with exposure to blockchain technology growth.
Developer Ecosystems and Governance
Bitcoin development follows a conservative, consensus-driven approach through Bitcoin Improvement Proposals (BIPs) that require extensive testing and broad community agreement. Bitcoin developers prioritize backward compatibility and security over rapid feature deployment, resulting in slower but more deliberate protocol evolution.
Ethereum development moves rapidly through Ethereum Improvement Proposals (EIPs) and coordinated leadership from the ethereum foundation and core development teams. This governance model enables faster innovation but concentrates more decision-making authority in the hands of key developers and researchers.
Bitcoin’s decentralized development process prevents unilateral changes to the protocol, requiring overwhelming consensus from users, miners, and developers. This approach protects against contentious forks and preserves Bitcoin’s monetary policy, but can slow adoption of beneficial upgrades.
Ethereum regularly implements protocol upgrades to improve functionality, reduce fees, and address scalability challenges. The coordinated development process enables ambitious technical roadmaps but raises questions about centralization of development decisions.
The underlying technology differences extend to developer tooling and ecosystem support. Ethereum offers extensive development frameworks, testing environments, and educational resources for building decentralized applications. Bitcoin development focuses more narrowly on protocol improvements and second-layer solutions.
Both networks benefit from active open-source communities, but Ethereum attracts more application developers while Bitcoin emphasizes protocol and infrastructure development.
Energy Consumption and Environmental Impact
Energy consumption represents one of the most significant differences between Bitcoin and Ethereum post-Merge. Bitcoin’s Proof-of-Work mining consumes substantial energy but secures the world’s most valuable cryptocurrency network with unmatched computational power and geographic distribution.
Current estimates place Bitcoin’s annual energy consumption between 70-130 TWh, comparable to small countries. However, bitcoin miners increasingly utilize renewable energy sources and drive clean energy adoption by monetizing stranded renewable capacity and excess energy production.
Ethereum’s transition to Proof-of-Stake reduced energy consumption by approximately 99.9% after The Merge, making it one of the most energy-efficient blockchain networks. Ethereum’s PoS consensus requires ETH staking rather than energy-intensive mining operations, dramatically reducing its environmental footprint.
The energy debate influences institutional adoption decisions, with some investment companies preferring ethereum’s lower environmental impact while others value Bitcoin’s proven security model despite higher energy usage. Environmental, social, and governance (ESG) considerations increasingly factor into cryptocurrency investment decisions.
Bitcoin proponents argue that energy consumption secures the network and incentivizes renewable energy development, while Ethereum supporters emphasize the efficiency gains from Proof-of-Stake consensus. Both perspectives reflect valid priorities in balancing security, decentralization, and environmental responsibility.
Investment Considerations
Bitcoin serves as an inflation hedge and uncorrelated asset for portfolio diversification, appealing to investors seeking exposure to digital gold characteristics without traditional precious metals storage challenges. Bitcoin’s established track record, regulatory clarity, and institutional adoption make it attractive for conservative cryptocurrency allocation.
Ethereum offers exposure to Web3 growth and decentralized finance innovation, providing leverage to the expanding blockchain application ecosystem. Investors choosing Ethereum bet on the continued growth of smart contract platforms and decentralized applications beyond simple value transfer.
Both assets face similar regulatory challenges, but Bitcoin benefits from clearer legal status in many jurisdictions due to its commodity-like characteristics. Ethereum’s classification remains more complex due to its programmable features and the potential for securities regulations to apply to certain tokens and applications.
Bitcoin provides returns primarily through price appreciation, though lending platforms offer yields similar to staking rewards. Ethereum enables native staking rewards of approximately 3-5% annually plus potential price appreciation, providing income generation alongside capital gains potential.
Portfolio construction often includes both bitcoin and ethereum to balance stability with growth potential. Many institutional investors and investment strategy frameworks recommend exposure to both assets given their different risk profiles and correlation patterns with traditional asset classes.
The choice between bitcoin vs ethereum often depends on investment objectives, risk tolerance, and beliefs about the future of digital money versus programmable blockchain platforms.
Future Outlook and Development Roadmaps
Bitcoin’s development roadmap focuses on gradual improvements like Taproot adoption, sidechains development, and bitcoin’s lightning network expansion. Future development emphasizes incremental enhancements to privacy, scripting capabilities, and second-layer scaling while maintaining the core protocol’s simplicity and security.
Ethereum pursues ambitious upgrades including sharding implementation, proto-danksharding for rollup scaling, and continued Layer-2 ecosystem development. Ethereum’s future events include account abstraction for improved user experience and continued optimization of the Proof-of-Stake consensus mechanism.
Bitcoin’s conservative approach prioritizes stability and gradual feature addition, with major changes requiring years of testing and community consensus. This methodology protects against unintended consequences but may limit Bitcoin’s ability to compete with more flexible blockchain platforms.
Ethereum faces competition from newer Layer-1 blockchains offering faster transactions and lower fees, but maintains significant advantages in developer mindshare, ecosystem maturity, and network effects. Ethereum’s roadmap addresses scalability concerns while preserving decentralization and security.
Both networks continue evolving to meet different needs in the expanding cryptocurrency ecosystem. Bitcoin solidifies its position as digital gold and the leading store of value cryptocurrency, while Ethereum develops as the primary platform for decentralized applications and financial innovation.
The fundamental differences between these networks suggest complementary rather than competitive futures, with each serving distinct roles in the broader digital asset landscape. Future performance will depend on continued technical development, regulatory clarity, and mainstream adoption across different use cases.
Key Takeaways
Understanding how bitcoin differs from ethereum reveals two complementary approaches to blockchain technology and digital assets. Bitcoin excels as a decentralized digital currency and store of value with predictable monetary policy and uncompromising security focus. Ethereum leads in programmable blockchain capabilities, enabling complex decentralized finance applications and serving as the foundation for Web3 innovation.
The key differences span every aspect from consensus mechanisms and energy consumption to governance philosophies and investment characteristics. Bitcoin’s Proof-of-Work mining and fixed supply contrast sharply with Ethereum’s Proof-of-Stake validation and dynamic tokenomics. Both bitcoin and ethereum offer distinct value propositions for different investor goals and risk profiles.
Rather than viewing these as competing cryptocurrencies, many investors and institutions recognize both bitcoin and ethereum as foundational digital assets serving different purposes in a diversified portfolio. Bitcoin provides stability and inflation hedging characteristics, while Ethereum offers exposure to technological innovation and the growing decentralized application ecosystem.
As the cryptocurrency space continues maturing, both networks face ongoing challenges around scalability, regulation, and competition. However, their established network effects, developer communities, and institutional adoption suggest continued relevance in the evolving digital asset landscape.
For investors considering exposure to cryptocurrency markets, understanding these fundamental differences enables more informed decision-making about portfolio allocation and investment strategy. Whether choosing Bitcoin’s digital gold characteristics or Ethereum’s programmable platform capabilities, both assets represent significant innovations in monetary technology and decentralized systems.
This content is for educational purposes only and should not be considered investment advice. Cryptocurrency investments carry significant risks, and past performance does not guarantee future results. Always consult with qualified financial advisors and conduct thorough research before making investment decisions.


%201.svg)
%201.svg)


.svg)


%201.svg)

.png)


.svg)


.png)