Crypto Basics

Bullish vs Bearish - A Comparative Analysis of Market Trends

Learn about the fundamental differences between bullish and bearish trends, in this descriptive guide.
Sumit Meghani
7 Minutes
MIN

When it comes to investing, bullish and bearish are two terms that investors often come across. These two terms are used to describe the market outlook or individual asset, and understanding their fundamental differences is crucial for making informed investment decisions.

In this article, we will delve deeper into the meanings and differences between Bullish and Bearish trends. So, buckle up and keep reading to learn more about the fundamental differences between the two.

What is the Bullish Trend?

The bullish trend is a term used in financial markets to describe a positive or optimistic outlook on the market or a particular asset like stocks or crypto. In a bullish trend, the market or asset is experiencing a steady increase in value, with buyers outnumbering sellers. 

bullish trend
Image Source: https://beincrypto.com/learn/crypto-trading-strategy-based-on-elliott-wave-theory

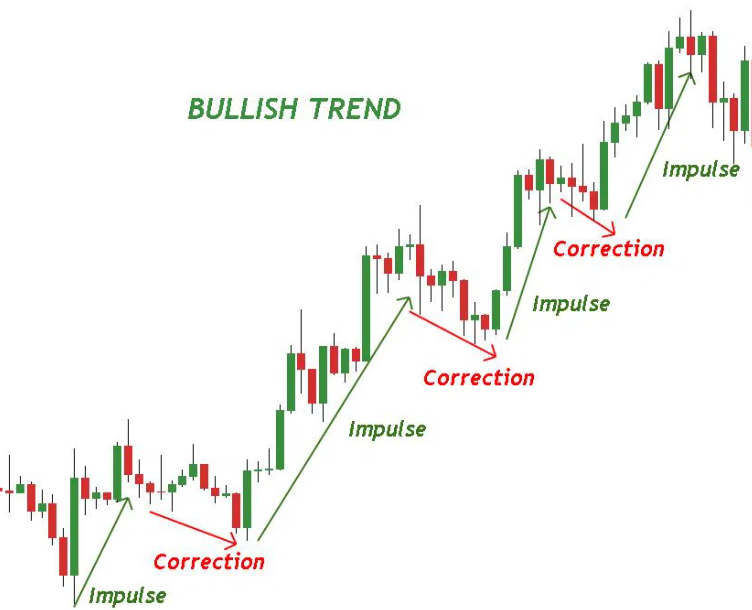
This often results in higher stock or crypto prices, increased trading volumes, and positive sentiment among investors. The bullish trend can be influenced by a variety of factors, including strong earnings growth, a positive economic outlook, and favorable government policies.

What is the Bearish Trend?

The bearish trend is a term commonly used in financial markets to describe a negative or pessimistic outlook on the market or a particular asset. Unlike the bullish trend, which is characterized by an increase in value, the bearish trend is marked by a decrease in value, lower stock/crypto prices, and negative sentiment among investors. 

bearish trend
Image Source: https://beincrypto.com/learn/crypto-trading-strategy-based-on-elliott-wave-theory

This bearish trend can be influenced by a variety of factors, including economic downturns, declining earnings, and unfavorable policies and regulations.

Bullish vs Bearish - Fundamental Differences

Now that we have understood the basic definitions let's look at the fundamental differences between the two.

1. Market Sentiment - The primary difference between Bullish and Bearish trends is the market sentiment. Bullish trends indicate positive sentiments, whereas Bearish trends indicate negative sentiments. The market sentiment is often driven by various factors such as economic conditions, political events, and company performance.

2. Price Movement - Another significant difference between Bullish and Bearish trends is the direction of price movement. In a Bullish trend, the prices of assets rise steadily, while in a Bearish trend, prices fall.

3. Trading Volume - The trading volume is an important indicator of market trends. A higher trading volume is often associated with Bullish trends, indicating increased investor participation and positive sentiment. On the other hand, a lower trading volume is often associated with Bearish trends, indicating decreased investor participation and negative sentiment.

4. Investor Behavior - Investor behavior is also an important factor that distinguishes Bullish and Bearish trends. In a Bullish trend, investors are more likely to buy digital assets, hoping to sell them at a higher price in the future. In contrast, in a Bearish trend, investors are more likely to sell digital assets, fearing a further decline in prices.

5. Timeframe - The duration of Bullish and Bearish trends can vary significantly. Bullish trends can last for months or even years, while Bearish trends can also last for extended periods.

6. Implications - Bullish and Bearish trends have significant implications for investors. A Bullish trend indicates a positivity for the market, leading to increased investments and higher asset prices. On the other hand, a Bearish trend indicates a negative approach, leading to decreased investments and lower asset prices.

How to Analyze Bullish and Bearish Patterns?

Analyzing bullish and bearish patterns is a key component of successful investing. To identify these patterns, investors use technical analysis, which involves examining charts and data to determine market trends. 

Bullish patterns may include higher highs and higher lows, while bearish patterns may include lower highs and lower lows. Other indicators that investors may look for include support and resistance levels, moving averages, and volume.

It's important to note that these patterns are not foolproof and should be used in conjunction with fundamental analysis, which involves examining a company's financial health and other factors that may impact its future growth prospects.

Examples of Bullish and Bearish Trend

Over time, the market has witnessed numerous bullish and bearish trends, with some being particularly noteworthy. Let's take a look at some real-life examples of such trends in the market.

Example of Bullish Trend - In late 2017, the price of Bitcoin experienced an unprecedented surge, rising from around $1,000 at the beginning of the year to nearly $20,000 by December. This was fueled by increased interest and adoption of cryptocurrencies, particularly by institutional investors. The bullish trend continued into early 2018, with the total market capitalization of all cryptocurrencies reaching an all-time high.

Example of Bearish Trend - One classic example of a bearish trend in Ethereum was the period from January 2018 to December 2018. During this time, the price of Ethereum experienced a significant correction, dropping from an all-time high of around $1,400 in January 2018 to around $85 by December 2018.

This bearish trend was fueled by several factors, including the general market downturn, concerns over scalability and network congestion, and increased competition from other blockchain projects. However, since then, Ethereum has seen a recovery and has undergone significant upgrades, such as the transition to Ethereum 2.0, which has increased interest and adoption of the platform.

Frequently Asked Questions (FAQs)

1. How can I identify a Bullish or Bearish trend?

You can identify a Bullish or Bearish trend by analyzing the price movements and trading volumes of the asset over a specific period. If the prices are rising, and the trading volumes are high, it indicates a Bullish trend. Conversely, if the prices are falling, and the trading volumes are low, it indicates a Bearish trend.

 2. How can I profit from a Bullish or Bearish trend?

You can profit from a Bullish or Bearish trend by buying or selling assets at the right time. In a Bullish trend, you can buy stocks at a lower price and sell them at a higher price when the trend ends. In a Bearish trend, you can sell stocks at a higher price and buy them back at a lower price when the trend ends.

3. Is it possible to have a Bullish and Bearish trend at the same time?

Yes, it is possible to have a Bullish and Bearish trend in different sectors of the market simultaneously. For instance, the technology sector can have a Bullish trend while the energy sector has a Bearish trend.

4. How do market trends impact my investments?

Market trends have a significant impact on your investments. If you invest during a Bullish trend, you are more likely to see positive returns. In contrast, if you invest during a Bearish trend, you may incur losses.

5. How can I prepare for market trends?

You can prepare for market trends by staying updated with economic and political news that impact the market. Additionally, you can diversify your portfolio to minimize risks and invest in long-term assets.

6. Can Bullish and Bearish trends change quickly?

Yes, market trends can change quickly, and it's crucial to stay updated with the latest news and trends. It's advisable to set stop-loss orders to minimize losses during sudden market changes.

The Bottom Line

In conclusion, understanding the fundamental differences between bullish and bearish sentiment can be helpful in making informed investment decisions. By considering economic indicators, company-specific news, and your own investment goals and risk tolerance, you can determine whether you're bullish or bearish on a particular asset or the overall market. 

Remember that while these views can be useful, they are not infallible, and it's important to remain vigilant and adaptable in a constantly evolving market. Investing involves risks, and it's essential to consult a financial advisor before making any investment decisions.

Disclaimer

The information provided on this website does not constitute investment advice, financial advice, trading advice, or any other sort of advice and you should not treat any of the website's content as such.

Token Metrics does not recommend that any cryptocurrency should be bought, sold, or held by you. Do conduct your own due diligence and consult your financial advisor before making any investment decisions.

Build Smarter Crypto Apps &
AI Agents in Minutes, Not Months
Real-time prices, trading signals, and on-chain insights all from one powerful API.
Grab a Free API Key
Token Metrics Team
Token Metrics Team

Recent Posts

Research

Crypto Indices - See What You Own: Holdings Treemap, Table, and Transactions Log (2025)

Token Metrics Team
5
MIN

If you’ve ever bought a “basket” of coins and then wondered what you actually hold, you’re not alone. The Token Metrics Global 100 solves that by pairing a rules-based strategy with radical visibility: an interactive holdings treemap, sortable table, and a real-time transactions log—so you can see what you own at all times. This transparency sits on top of a simple idea: a top-100 crypto index when markets are bullish and stablecoins when they’re not, with weekly rebalancing and one-click buy at launch. The result is clarity for hands-off allocators and discipline for active traders—without spreadsheets or manual rebalances.

→ Join the waitlist to be first to trade TM Global 100.

Why Transparency Matters in October 2025

Today’s crypto investor expects more than a chart and a headline weight. You want to audit your index: which coins, what size, and what changed after each rebalance. That’s exactly why we ship three visibility layers on day one: Gauge → Treemap → Transactions Log—plus a classic holdings table for power users.

In practical terms, a holdings treemap shows proportional weights at a glance, a table lets you sort and export details, and a transactions log chronicles every add/trim/exit during rebalances and regime switches. Together, they answer the search intent behind “crypto index holdings” and “weekly rebalancing” with an immediately scannable source of truth.

How the TM Global 100 Index Works (Plain English)

  • Regime switching: When our market signal is bullish, the index holds the top 100 assets by market cap. When bearish, it exits to stablecoins and waits for a re-entry signal.
  • Weekly rebalancing: We adjust constituents and weights weekly to reflect updated rankings—so the index stays aligned with the market.
  • Transparency: You’ll see a Strategy modal (rules at a glance), a market signal gauge, an interactive Holdings treemap & table, and a Transactions log that records rebalances and regime shifts.

What you’ll see on launch: A price tile, “tokens: 100,” “rebalances weekly,” and a Buy Index flow that can complete in about 90 seconds, end-to-end.

See the strategy and rules. (TM Global 100 strategy)

Benefits at a Glance (Why This Beats DIY)

  • Time saved: Skip ranking lists, manual screeners, and cross-exchange rebalances.
  • Lower execution drag: A single indexed flow helps reduce the slippage and fees you’d pay hopping between many tokens.
  • No missed cycles: Weekly rebalances help capture changes in the top-100 while the regime switch avoids guesswork when markets turn.
  • Full visibility: Treemap + table + transactions let you see exactly what changed and why—no black boxes.
  • Rules over vibes: A consistent methodology can reduce emotional decisions during drawdowns and market euphoria.

Step-by-Step: How to Get Early Access (Waitlist)

  1. Open the Indices hub and select TM Global 100. (Token Metrics Indices hub)
  2. Join the waitlist with your email to get launch-day access and updates.
  3. (Optional) Connect your wallet so you’re ready to buy at launch.
  4. On launch: Open TM Global 100, review the Gauge → Treemap → Transactions, and tap Buy Index.
  5. Confirm the buy: You’ll see estimates for fees/slippage and the current token mix.
  6. Track your position: Your holdings and every rebalance appear in My Indices and the Transactions Log.

→ Join the waitlist to be first to trade TM Global 100.

Decision Guide: Is This Right for You?

  • Hands-Off Allocator: Want “own the market” exposure and automatic upkeep. Consider if you dislike micromanaging.
  • Active Trader: Want a disciplined core that moves to stablecoins in bears while you take satellite bets elsewhere.
  • TM Member/Prospect: Already trust Token Metrics research and want rules-based execution with full visibility.
  • Starter Portfolio Builder: Prefer a single decision over 20+ token buys and periodic DIY reweights.
  • Transparency Seeker: You won’t tolerate black-box products; you want a real transactions log and holdings you can audit.
  • Tax-Aware Rebalancer: You’d rather not run frequent piecemeal trades yourself.
  • Mobile-First User: Want a fast, on-page buy flow instead of tab-hopping across venues.
  • Analytics Fan: Enjoy comparing weights and changes in the treemap after each weekly rebalance.

FAQs

What is a crypto index with a holdings treemap?

It’s a rules-based basket of cryptocurrencies where you can visually inspect weights via an interactive treemap, alongside a sortable table and a transactions log that records every rebalance and regime switch.

It’s a rules-based basket of cryptocurrencies where you can visually inspect weights via an interactive treemap, alongside a sortable table and a transactions log that records every rebalance and regime switch.

Weekly. Rebalances update constituents/weights to reflect current top-100 rankings; separate regime switches can also move the portfolio between tokens and stablecoins when the market signal changes.

What triggers the move to stablecoins?

A proprietary market signal. When bearish, the index exits tokens to stablecoins; when bullish resumes, it re-enters the top-100 basket.

Can I fund with USDC or fiat?

At launch, funding/settlement options surface based on your connected wallet and supported chains. USDC payout is supported on selling; fiat on-ramps may be added later.

Is the wallet custodial?

No. The embedded wallet is self-custodial—you control your funds.

How are fees shown?

Before you confirm, the buy flow surfaces estimated gas, platform fee, max slippage, and min expected value.

How do I join the waitlist?

Open the Indices hub, navigate to TM Global 100, and add your email. You’ll be notified on launch with a direct link to buy.

Security, Risk & Transparency

  • Self-custody: Embedded smart wallet with user control.
  • Operational clarity: Weekly rebalances; regime logic documented in the Strategy modal.
  • Fee & slippage preview: All surfaced before you confirm a trade.
  • Data integrity: Holdings treemap + table and transactions log reflect each executed change.

Regional notes: Availability and on-ramps can vary by jurisdiction. Crypto is volatile and can lose value. Past performance is not indicative of future results. This article is for research/education, not financial advice.

Conclusion

Token Metrics Global 100 is built for investors who want broad market exposure and the receipts to prove what they hold—treemap, table, and transactions on every rebalance. If you value rules, discipline, and transparency, join the waitlist and be ready on launch day.

Research

Crypto Index vs DIY Basket: Time, Slippage, and Missed Rebalances (2025)

Token Metrics Team
5
MIN

Building your own crypto basket sounds simple—until you’re juggling 10–50 tickers, spreadsheets, rebalance rules, spreads across chains, and the constant fear of missing regime turns. A crypto index removes that manual grind: TM Global 100 holds the top 100 assets when the market is bullish and moves fully to stablecoins when it’s not, with weekly rebalancing and full transparency of holdings and transactions. One click to buy, zero maintenance to keep up.

→ Join the waitlist to be first to trade TM Global 100.

Why Indices Matters in October 2025

In 2025, time and execution quality are alpha. Manually maintaining a DIY basket multiplies complexity: fragmented liquidity, multiple wallets, chain fees, and coordination across exchanges—all while markets move. A rules-based index compresses that overhead into a single, auditable product with pre-declared logic and scheduled upkeep.

Definition (snippet-ready): A crypto index is a rules-based basket of digital assets that rebalances on a set schedule and/or when market conditions change, so you don’t have to micromanage individual coins.

Traders searching “DIY crypto basket,” “regime switching,” or “weekly rebalancing” usually want one thing: broad exposure without the constant maintenance and the regret of missed rebalances. That’s the exact problem Token Metrics Global 100 addresses with weekly updates and regime switching to stablecoins when signals turn bearish.

How the TM Global 100 Index Works (Plain English)

  • Regime switching: When signals are bullish, the index holds the top 100 by market cap; when bearish, it exits fully to stablecoins to wait for re-entry.
  • Weekly rebalancing: Aligns weights and constituents with updated rankings; regime changes can also trigger full portfolio shifts.
  • Transparency: Strategy modal explains selection & rebalancing rules; Holdings show a treemap/table; Index Transactions log all changes.

What you’ll see on launch: Price tile, signal gauge, tokens=100, “rebalances weekly,” contract address, and a Buy Index button with a ~90-second live demo flow showcased in launch content.

→ See the strategy and rules. (TM Global 100 strategy)

Benefits at a Glance (Why This Beats DIY)

  • Time saved: Replace multi-exchange shopping, wallet hops, and manual allocations with one click.
  • Fewer missed rebalances: Weekly cadence + visible transactions log reduce the cost of “I’ll do it tomorrow.”
  • Slippage discipline: Centralized execution with declared slippage/fee previews helps contain surprises vs piecemeal orders.
  • Regime switching: Codified “risk-off” behavior into stablecoins during bears, so you don’t have to white-knuckle exits. (No performance promises.)
  • Transparency: Strategy modal → Holdings treemap/table → Transactions log—see exactly what you hold and when it changed.

Proof cues (What you’ll see): Gauge (market signal) → Treemap (allocations) → Transactions Log → ~90-second Buy flow.

Step-by-Step: How to Get Early Access (Waitlist)

  1. Open the Token Metrics Indices hub and select TM Global 100.
  2. Add your email to the waitlist so you’re first in line at launch.
  3. (Optional) Connect your wallet—our embedded, self-custodial smart wallet supports major chains.
  4. On launch day, you’ll see the price tile, signal gauge, and “Buy Index.”
  5. Review the strategy, expected fees/slippage, and holdings; confirm to purchase.
  6. Track your position in My Indices; rebalances and any regime switches will appear in the transactions log.
→ Join the waitlist to be first to trade TM Global 100.

Decision Guide: Is This Right for You?

  • Hands-Off Allocator: Want broad exposure without micromanaging? Consider a rules-based core that updates weekly.
  • Active Trader: Keep your bets, but use an index core that may step to stablecoins during bears.
  • TM Member/Prospect: Prefer transparent holdings, logs, and a simple buy/sell flow.
  • Time-Strapped Professional: Reduce ops work (wallets, slippage math, spreadsheets) to nearly zero.
  • New to Crypto: Learn with training wheels—strategy modal, tooltips, and clear risk language.
  • DIY Purist: If you enjoy tinkering with weights daily, DIY could still fit—just know weekly index upkeep is handled for you.

FAQs

What is a crypto index?

A rules-based basket of assets with scheduled rebalancing and, in TM Global 100’s case, a regime switch between top-100 exposure and stablecoins.

How often does the index rebalance?

Weekly, with additional full-portfolio switches when the market regime changes.

What triggers the move to stablecoins?

A proprietary market signal. When bearish, the index exits tokens into stablecoins and waits for a bullish re-entry.

Can I fund with USDC or fiat?

Funding options surface based on your connected wallet and supported chains; USDC payouts are supported on selling. (Stablecoin entry may come later.)

Is the wallet custodial?

No. The embedded wallet is self-custodial; you control funds.

How are fees shown?

The Buy flow shows estimated gas, platform fee, max slippage, and minimum expected value before you confirm.

How do I join the waitlist?

Visit the Indices hub → TM Global 100 → enter your email to get notified and first access at launch.

Security, Risk & Transparency

  • Self-custody: You transact via an embedded, self-custodial smart wallet.
  • Visibility: Strategy modal, Holdings treemap/table, and Transactions log make changes auditable.
  • Fee & slippage preview: See estimated gas, platform fee, max slippage, and minimum expected value before confirming.
  • Regime logic limits: Signals can be wrong; markets can gap; weekly rebalances can’t eliminate risk.
  • Region/chain notes: Supported chains surface in-product; availability and options may vary.

Crypto is volatile and can lose value. Past performance is not indicative of future results. This article is for research/education, not financial advice.

Conclusion

If you’ve ever missed a rebalance or watched slippage eat into returns, Token Metrics Global 100 can help standardize the work: rules-based logic, weekly updates, and a visible log of everything that changed. Join the waitlist to be first to trade, and make a disciplined index your core.

→ Join the waitlist to be first to trade TM Global 100.
Research

Regime Switching in Crypto: Participate in Upside, Sit Out Drawdowns (2025)

Token Metrics Team
5
MIN

Timing crypto cycles is inherently challenging. Volatility in the crypto markets can lead to sharp swings—either capturing gains during bull runs or avoiding deep drawdowns during unfavorable trends. A regime switching crypto index offers a systematic way to adapt to changing market conditions, using rules-based allocations that switch between risk-on assets and stablecoins accordingly. Token Metrics offers tools to help analyze these strategies with transparency and real-time insights.

Why Indices Matter in October 2025

Crypto markets tend to operate in distinct regimes—periods of momentum followed by corrections that can reverse gains quickly. Investors and analysts seeking to implement regime switching or weekly rebalancing frameworks value simplicity and clarity. These approaches help in maintaining discipline, managing risks, and capturing market trends effectively.

Definition of Regime Switching in Crypto

Regime switching in crypto refers to a rules-based investment method that adjusts portfolio exposure based on prevailing market conditions. Typically, this involves rotating into a diversified basket of tokens in bullish phases and shifting into stablecoins during bearish trends, thus managing risk while seeking to ride upward trends.

Why Now: The Rationale for Regime Switching

  • Cycle Asymmetry: Capturing upward trends while limiting downside drawdowns can influence long-term outcomes positively.
  • Operational Efficiency: Automated, rules-based rebalancing reduces errors and slippage tied to manual adjustments across multiple tokens or exchanges.
  • Transparency: Real-time insight into holdings, rebalancing rationale, and transaction history fosters trust and clarity.

How the TM Global 100 Index Works (Plain English)

This index employs regime switching principles: during bullish periods, it holds the top 100 crypto assets by market cap; during bearish times, it exits into stablecoins and waits for buy signals. The index performs weekly rebalancing based on updated rankings, liquidity, and supply metrics. Transparency is maintained through clear strategy rules, gauges, Treemap views, and detailed transaction logs.

Benefits at a Glance (Why This Beats DIY)

  • Rules, not vibes: Automated logic minimizes emotional decision-making.
  • Fewer operational mistakes: Single, streamlined flows replace manual multi-step trades.
  • Discipline in switching: Full rotation into stablecoins at bearish signals reduces hesitation and second-guessing.
  • Cost visibility: Estimated gas, platform fees, and expected minimum value are shown upfront.
  • Full transparency: Holdings treemaps and transaction histories keep you informed.
  • Consistent cadence: Weekly updates ensure alignment with market trends.

Step-by-Step: How to Get Early Access (Waitlist)

  1. Visit the Token Metrics Indices hub.
  2. Find the TM Global 100 index card and tap “Join Waitlist”.
  3. Add your email to receive launch notifications.
  4. Optionally, connect your wallet in advance to streamline onboarding on launch day.
  5. On launch day, you will receive an email when the index opens for trading. The interface features gauges, strategy details, and holdings for instant review.
  6. Complete the purchase of the index in about 90 seconds by confirming your wallet, reviewing potential fees, and confirming the buy.
  7. Track your position within “My Indices” once active.

Join the waitlist to be first to trade TM Global 100.

Decision Guide: Is This Right for You?

  • Hands-Off Allocator: Ideal for those seeking broad market exposure with minimal management.
  • Active Trader: Useful as a core strategy with rules-based rebalancing, supporting satellite bets.
  • Token Metrics Member/Prospect: For users who value transparent, research-backed rules over discretionary choices.
  • Crypto Newcomer: Simplifies entry with one-button buy, weekly updates, and clear rules.
  • Time-Constrained Pro: Reduces operational overhead while maintaining clarity and predictability.
  • Skeptical of Forecasts: Prefers systematic processes over relying on predictions or forecasts.

FAQs

What is a regime switching crypto index?

A rules-based portfolio that allocates to a diversified token basket during bullish phases and switches to stablecoins during bearish conditions, based on predefined signals. Token Metrics implements this with a top-100 universe and full stablecoin rotation in downturns.

How often does the index rebalance?

It rebalances weekly to reflect changes in rankings and liquidity. Significant regime changes can occur outside the schedule when market signals trigger a switch.

What triggers the move to stablecoins?

A proprietary market signal prompts the index to exit token positions and move into stablecoins during bearish phases, waiting for a bullish signal to re-enter.

Can I fund with USDC or fiat?

Funding occurs via an embedded, self-custodial wallet supporting major chains. USDC payouts are supported when selling. Funding options depend on your wallet and region.

Is the wallet custodial?

No. It is self-custodial, giving you control of keys and funds.

How are fees shown?

Before confirming a trade, estimated gas, platform fee, slippage, and expected minimum value are displayed.

How do I join the waitlist?

Visit the Token Metrics Indices hub, open TM Global 100, and tap “Join Waitlist”. You will be notified at launch.

Security, Risk & Transparency

  • Self-custody is prioritized: You control your keys and funds.
  • Transparency is built into the process: Fees, holdings, and transaction logs are visible before and after trades.
  • Market signals are based on rules; sudden gaps and spreads can impact outcomes.
  • Supported regions and asset options may vary due to geography.

Crypto markets are volatile and can fluctuate rapidly. Past performance does not predict future results. This article aims to educate and inform, not provide financial advice.

Conclusion

For a disciplined, transparent approach to broad crypto exposure that adapts to market regimes, the TM Global 100 index offers a rules-based platform with weekly rebalancing and full visibility. It enables investors to focus on allocation without the stress of micromanagement.

Join the waitlist to be first to trade TM Global 100.

Choose from Platinum, Gold, and Silver packages
Reach with 25–30% open rates and 0.5–1% CTR
Craft your own custom ad—from banners to tailored copy
Perfect for Crypto Exchanges, SaaS Tools, DeFi, and AI Products