


Cardano Price Prediction 2027: Layer-1 Research-Driven Analysis
%201.svg)
%201.svg)


Market Context for Cardano Price Prediction: The Case for 2027
The Layer 1 competitive landscape is consolidating as markets recognize that specialization matters more than being a generic "Ethereum killer." Cardano positions itself in this multi-chain world with specific technical and ecosystem advantages. Infrastructure maturity around custody, bridges, and developer tools makes alternative L1s more accessible heading into 2026.
The Cardano price prediction scenario projections below map different market share outcomes for ADA across varying total crypto market sizes. Base cases assume Cardano maintains current ecosystem momentum, while moon scenarios factor in accelerated adoption and bear cases reflect increased competitive pressure. Our comprehensive price prediction framework provides investors with data-driven forecasts for strategic planning.
Disclosure
Educational purposes only, not financial advice. Crypto is volatile, do your own research and manage risk.
How to Read This ADA Price Prediction
Each band blends cycle analogues and market-cap share math with TA guardrails. Base assumes steady adoption and neutral or positive macro. Moon layers in a liquidity boom. Bear assumes muted flows and tighter liquidity.
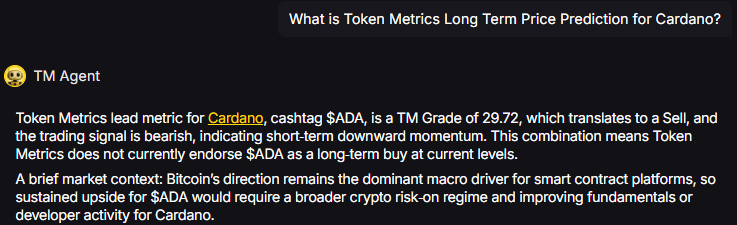
TM Agent baseline: Token Metrics lead metric for Cardano, cashtag $ADA, is a TM Grade of 29.72%, which translates to a Sell, and the trading signal is bearish, indicating short-term downward momentum. This combination means Token Metrics does not currently endorse $ADA as a long-term buy at current levels in our price prediction models. A brief market context: Bitcoin's direction remains the dominant macro driver for smart contract platforms, so sustained upside for $ADA would require a broader crypto risk-on regime and improving fundamentals or developer activity for Cardano.
Live details: Cardano Token Details
Affiliate Disclosure: We may earn a commission from qualifying purchases made via this link, at no extra cost to you.
Key Takeaways: Cardano Price Prediction Summary
- Scenario driven: Price prediction outcomes hinge on total crypto market cap; higher liquidity and adoption lift the bands
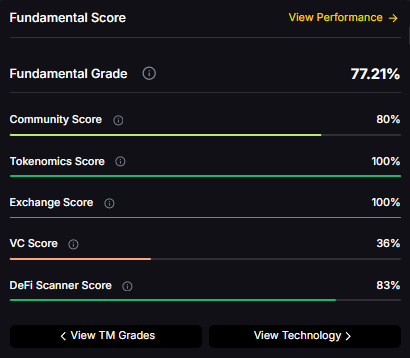
- Fundamentals: Fundamental Grade 77.21% (Community 80%, Tokenomics 100%, Exchange 100%, VC 36%, DeFi Scanner 83%)
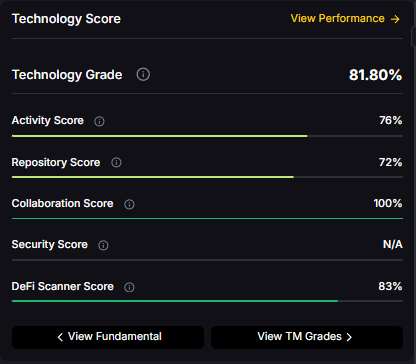
- Technology: Technology Grade 81.80% (Activity 76%, Repository 72%, Collaboration 100%, Security N/A, DeFi Scanner 83%)
- TM Agent gist: Bearish short term in price prediction models; requires risk-on and improved fundamentals for sustained upside
- Current rating: Sell (29.72%) despite strong fundamentals and technology scores
- Education only, not financial advice
Cardano Price Prediction Scenario Analysis
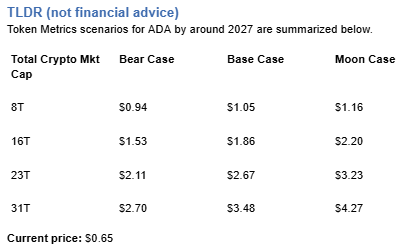
Token Metrics price prediction scenarios span four market cap tiers, each representing different levels of crypto market maturity and liquidity:
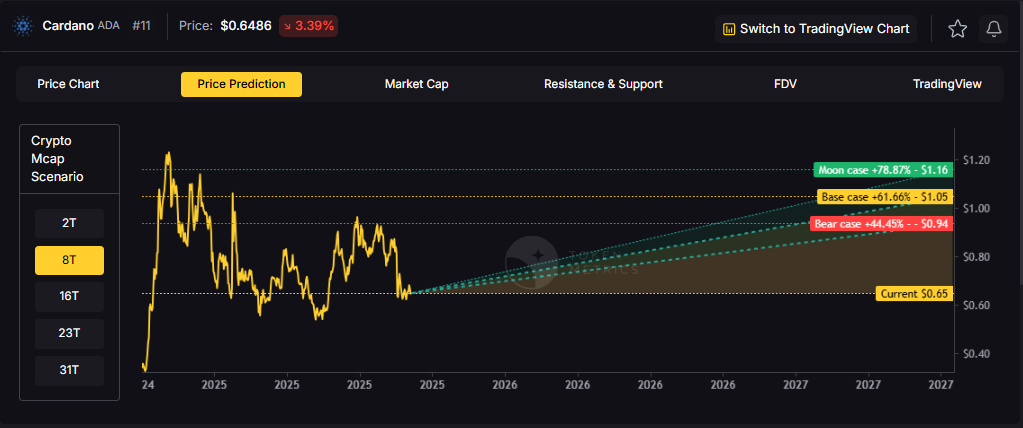
8T Market Cap - ADA Price Prediction:
At an eight trillion dollar total crypto market cap, ADA price prediction projects to $0.94 in bear conditions, $1.05 in the base case, and $1.16 in bullish scenarios.
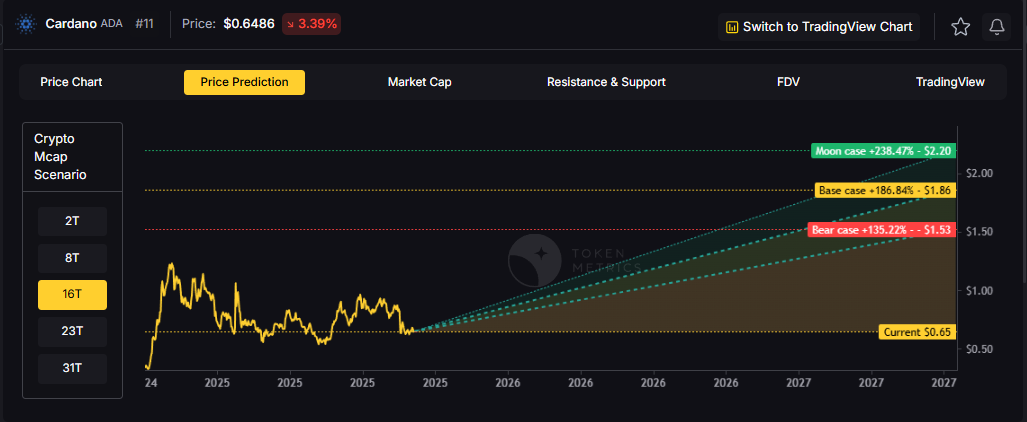
16T Market Cap - ADA Price Prediction:
Doubling the market to sixteen trillion expands the price prediction range to $1.53 (bear), $1.86 (base), and $2.20 (moon).
23T Market Cap - ADA Price Prediction:
At twenty-three trillion, the price prediction scenarios show $2.11, $2.67, and $3.23 respectively.

31T Market Cap - ADA Price Prediction:
In the maximum liquidity scenario of thirty one trillion, ADA price predictions could reach $2.70 (bear), $3.48 (base), or $4.27 (moon).

Each tier in our price prediction framework assumes progressively stronger market conditions, with the base case reflecting steady growth and the moon case requiring sustained bull market dynamics.
Why Consider the Indices with Top-100 Exposure
Cardano represents one opportunity among hundreds in crypto markets. Token Metrics Indices bundle ADA with top one hundred assets for systematic exposure to the strongest projects. Single tokens face idiosyncratic risks that diversified baskets mitigate.
Historical index performance demonstrates the value of systematic diversification versus concentrated positions.
What Is Cardano?
Cardano is a blockchain platform designed to support secure, scalable, and sustainable decentralized applications and smart contracts. It is known for its research-driven development approach, emphasizing peer-reviewed academic research and formal verification methods to ensure reliability and security. As a proof-of-stake Layer 1 blockchain, Cardano aims to offer energy efficiency and long-term scalability, positioning itself as a competitor to platforms like Ethereum. Its native token, ADA, is used for transactions, staking, and governance. Adoption is driven by technological rigor and ecosystem growth, though progress has been criticized for being slow compared to more agile competitors—a factor that significantly influences ADA price predictions. Risks include execution delays, competition, and market volatility.
Cardano's vision is to create a decentralized platform that enables sustainable and inclusive economic systems through advanced cryptography and scientific methodology. It aims to bridge gaps between traditional financial systems and blockchain technology, promoting accessibility and security for users globally.
Token Metrics AI Analysis
Token Metrics AI provides comprehensive context on Cardano's positioning and challenges, informing our ADA price prediction models:
Vision: Cardano's vision is to create a decentralized platform that enables sustainable and inclusive economic systems through advanced cryptography and scientific methodology. It aims to bridge gaps between traditional financial systems and blockchain technology, promoting accessibility and security for users globally.
Problem: Many early blockchains face trade-offs between scalability, security, and energy efficiency. Cardano addresses the need for a more sustainable and formally verified blockchain infrastructure that can support complex applications without compromising decentralization or environmental impact. It targets inefficiencies in existing networks, particularly high energy use and lack of academic rigor in protocol design.
Solution: Cardano uses a proof-of-stake consensus algorithm called Ouroboros, which is mathematically verified for security and energy efficiency. The platform is built in layers, the settlement layer for ADA transactions and a separate computational layer for smart contracts, allowing for modular upgrades and improved scalability. It supports staking, governance, and decentralized applications, with an emphasis on formal methods to reduce vulnerabilities and ensure long-term viability.
Market Analysis: Cardano operates in the Layer 1 blockchain category, competing with Ethereum, Solana, and Avalanche. While not the market leader, it maintains a significant presence due to its academic foundation and global outreach, particularly in emerging economies. Adoption is influenced by developer activity, regulatory developments, and progress in ecosystem expansion. Its differentiator lies in its methodical, research-first approach, though this has led to slower deployment compared to peers—a critical factor in our price prediction analysis. Market risks include technological delays, competition, and shifting investor sentiment. Broader adoption depends on sustained development, real-world use cases, and interoperability advancements.
Fundamental and Technology Snapshot from Token Metrics
- Fundamental Grade: 77.21% (Community 80%, Tokenomics 100%, Exchange 100%, VC 36%, DeFi Scanner 83%).
- Technology Grade: 81.80% (Activity 76%, Repository 72%, Collaboration 100%, Security N/A, DeFi Scanner 83%).
Catalysts That Skew ADA Price Predictions Bullish
- Institutional and retail access expands with ETFs, listings, and integrations
- Macro tailwinds from lower real rates and improving liquidity
- Product or roadmap milestones such as Hydra scaling upgrades or major partnerships
- Accelerated smart contract deployment and DApp ecosystem growth
- Successful real-world adoption in emerging markets (particularly Africa)
- Improved developer onboarding and tooling reducing time-to-market
- Strategic DeFi protocol launches on Cardano
Risks That Skew ADA Price Predictions Bearish
- Macro risk-off from tightening or liquidity shocks
- Regulatory actions targeting proof-of-stake networks or infrastructure outages
- Concentration in staking pool economics and competitive displacement from faster L1s
- Current Sell rating (29.72%) reflecting valuation and execution concerns
- Continued slow development pace versus agile competitors (Solana, Avalanche)
- Limited DeFi TVL and developer activity compared to Ethereum ecosystem
- Low VC grade (36%) indicating reduced institutional backing
How Token Metrics Can Help
Token Metrics empowers you to analyze Cardano and hundreds of digital assets with AI-driven ratings, on-chain and fundamental data, and index solutions to manage portfolio risk smartly in a rapidly evolving crypto market. Our price prediction frameworks provide transparent scenario-based analysis even for tokens with Sell ratings but strong fundamentals.
Cardano Price Prediction FAQs
Can ADA reach $4?
Yes. Based on our price prediction scenarios, ADA could reach $4 in the 31T moon case, projecting $4.27. However, this requires maximum market cap expansion, significant ecosystem acceleration, and improved developer activity beyond current levels—challenging given the current Sell rating (29.72%). Not financial advice.
Can ADA 10x from current levels?
At current price of $0.65, a 10x would reach $6.50. This falls beyond all provided price prediction scenarios, which top out at $4.27 in the 31T moon case. Bear in mind that 10x returns would require substantial market cap expansion and ecosystem improvements beyond our modeled scenarios. Not financial advice.
What price could ADA reach in the moon case?
Moon case price predictions range from $1.16 at 8T to $4.27 at 31T total crypto market cap. These scenarios assume maximum liquidity expansion and strong Cardano adoption, though current Sell rating suggests significant execution improvements needed. Not financial advice.
What is the Cardano price prediction for 2027?
Our comprehensive ADA price prediction framework for 2027 suggests Cardano could trade between $0.94 and $4.27 depending on market conditions and total crypto market capitalization. The base case price prediction scenario clusters around $1.05 to $3.48 across different market cap environments. Despite strong fundamentals (77.21%) and technology (81.80%), the Sell rating (29.72%) reflects concerns about execution speed and competitive positioning. Not financial advice.
Can Cardano reach $2?
Yes. Based on our price prediction scenarios, ADA could reach $1.86 in the 16T base case and $2.20 in the 16T moon case. The $2 target becomes achievable in moderate market cap environments, though overcoming current bearish momentum and execution concerns remains critical. Not financial advice.
Should I buy ADA now or wait?
ADA has a Sell rating (29.72%) indicating Token Metrics does not currently endorse Cardano at these levels, despite strong fundamental (77.21%) and technology (81.80%) grades. Current price of $0.65 sits below even the 8T bear case ($0.94), suggesting potential value—but the Sell rating reflects concerns about execution, competitive pressure, and slow development pace. Dollar-cost averaging may reduce timing risk if you believe in Cardano's long-term research-driven thesis. Not financial advice.
Why does ADA have a Sell rating despite strong fundamentals?
ADA shows strong fundamentals (77.21%) and excellent technology (81.80%), but the overall TM Grade of 29.72% (Sell) reflects concerns about execution speed, competitive disadvantage versus faster L1s like Solana, limited DeFi ecosystem development, low VC backing (36%), and bearish trading momentum. Our price prediction models show potential upside in favorable market conditions, but current metrics suggest waiting for improved catalyst execution or better entry points. Not financial advice.
Is Cardano a good investment based on price predictions?
Cardano presents a complex investment case: strong fundamentals (77.21%), excellent technology (81.80%), but a Sell rating (29.72%) with bearish momentum. While our price prediction models show potential upside to $1.05-$4.27 depending on scenarios, current concerns about slow development, competitive pressure from Ethereum and Solana, and limited DeFi adoption suggest caution. The research-driven thesis is compelling long-term, but execution must improve. Consider diversified L1 exposure through indices. Not financial advice.
How does Cardano compare to Ethereum and Solana?
Cardano's price prediction framework suggests $0.94-$4.27 across scenarios, positioning it as a mid-tier L1. Compared to Ethereum's dominance and Solana's speed, Cardano differentiates through academic rigor and proof-of-stake sustainability. However, the Sell rating (29.72%) reflects market concerns that methodical research-first approach has resulted in slower ecosystem development. Cardano's strength in fundamentals (77.21%) and technology (81.80%) doesn't yet translate to market leadership or developer mindshare.
What are the biggest risks to Cardano price predictions?
Key risks that could impact ADA price predictions include: current Sell rating (29.72%) indicating valuation and execution concerns, slow development pace criticized versus Solana/Avalanche, limited DeFi TVL and developer activity, low VC grade (36%) showing reduced institutional backing, competitive displacement from faster L1s, regulatory targeting of proof-of-stake networks, and Bitcoin correlation dampening independent upside. Despite strong grades, execution risk dominates the near-term outlook.
Will Cardano benefit from an altcoin season?
Cardano's price prediction scenarios assume participation in broader crypto market expansion. However, the Sell rating (29.72%) and bearish momentum suggest ADA may underperform versus faster-moving L1s during altcoin rallies. Our base case scenarios ($1.05 to $3.48) reflect moderate participation in bull market dynamics, but achieving moon case targets requires Cardano demonstrating accelerated ecosystem growth and developer adoption improvements. Not financial advice.
What needs to happen for ADA to reach its price prediction targets?
For ADA to reach our price prediction targets of $1.05-$4.27, several catalysts must materialize: (1) accelerated smart contract and DApp deployment addressing slow development concerns, (2) significant DeFi TVL growth competing with Ethereum, (3) successful real-world adoption in emerging markets, (4) improved developer tooling and onboarding, (5) major partnership announcements, and (6) broader crypto market bull run providing liquidity. The Sell rating suggests these catalysts aren't currently materializing at required pace.
Next Steps
Disclosure
Educational purposes only, not financial advice. Crypto is volatile, do your own research and manage risk.
Why Use Token Metrics for Cardano Price Predictions?
- Transparent analysis: Honest Sell ratings (29.72%) even when fundamentals (77.21%) and technology (81.80%) are strong
- Scenario-based modeling: Four market cap tiers for comprehensive price prediction analysis
- L1 specialization: Focused analysis of Cardano's research-driven approach versus execution speed trade-offs
- Risk-adjusted approach: Balanced view of academic rigor strengths versus competitive disadvantages
- Real-time signals: Trading signals and TM Grades updated regularly
- Diversification tools: Index solutions to spread Layer-1 risk across multiple platforms
- Comparative analysis: Analyze ADA against Ethereum, Solana, Avalanche, and 6,000+ tokens
AI Agents in Minutes, Not Months

.svg)


%201.svg)

.png)


.svg)
No Credit Card Required


Online Payment


SSL Encrypted
.png)
Token Metrics Media LLC is a regular publication of information, analysis, and commentary focused especially on blockchain technology and business, cryptocurrency, blockchain-based tokens, market trends, and trading strategies.
Token Metrics Media LLC does not provide individually tailored investment advice and does not take a subscriber’s or anyone’s personal circumstances into consideration when discussing investments; nor is Token Metrics Advisers LLC registered as an investment adviser or broker-dealer in any jurisdiction.
Information contained herein is not an offer or solicitation to buy, hold, or sell any security. The Token Metrics team has advised and invested in many blockchain companies. A complete list of their advisory roles and current holdings can be viewed here: https://tokenmetrics.com/disclosures.html/
Token Metrics Media LLC relies on information from various sources believed to be reliable, including clients and third parties, but cannot guarantee the accuracy and completeness of that information. Additionally, Token Metrics Media LLC does not provide tax advice, and investors are encouraged to consult with their personal tax advisors.
All investing involves risk, including the possible loss of money you invest, and past performance does not guarantee future performance. Ratings and price predictions are provided for informational and illustrative purposes, and may not reflect actual future performance.