Back to blog
Crypto Basics

Cardano (ADA) Price Prediction 2025, 2030 - Forecast Analysis

Explore a detailed analysis of Cardano (ADA) price predictions for 2025 and 2030. Gain insights into factors that may influence the future of Cardano.
Talha Ahmad
5 Minutes
Want Smarter Crypto Picks—Free?
See unbiased Token Metrics Ratings for BTC, ETH, and top alts.
Thank you! Your submission has been received!
Oops! Something went wrong while submitting the form.
 No credit card | 1-click unsubscribe

Click here to trade cryptos at MEXC!

Contact us at promo@tokenmetrics.com for marketing and sponsorship programs.

As the crypto market expands, numerous high-potential cryptocurrencies are being introduced. However, there are only a few cryptos that have demonstrated significant potential in recent years, one of which is Cardano.

Cardano holds immense promise beyond being a mere profit-driven asset. With its foundation rooted in meticulously reviewed academic research, Cardano has fostered a robust community over time. 

Backed by a strong technical framework and an ambitious team, ADA has emerged as one of the leading cryptocurrencies globally. 

This article delves into a comprehensive analysis of Cardano (ADA) and its prospective growth. We examine its historical performance and current fundamentals and present a range of scenarios for price prediction. 

Furthermore, we evaluate expert viewpoints, discuss the risks and rewards associated with investing in Cardano, and shed light on the project's ongoing developments and future potential.

Cardano (ADA) Overview

Cardano is a third-generation, fully open-sourced, decentralized public blockchain that operates on a Proof-of-Stake (PoS) consensus mechanism. 

It aims to provide a platform for hosting smart contracts by developing advanced features that cater to the dynamic nuances of various decentralized applications (dApps). 

Cardano has positioned itself as a potential game-changer in the blockchain industry, focusing on scalability, interoperability, and sustainability.

Historical Performance of Cardano

Cardano's performance in the cryptocurrency market has been notable. ADA has shown resilience and steady growth despite facing volatility and market fluctuations.

Cardano Price Chart

In 2021, Cardano reached an all-time high of $3.09 in September, reflecting its strong market presence. However, it is essential to note that past performance does not guarantee future results, and the cryptocurrency market is highly unpredictable.

Cardano (ADA) Current Fundamentals

To understand Cardano's future potential, it is crucial to examine its current fundamentals. ADA, the native token of the Cardano network, serves multiple purposes within the ecosystem.

Cardano Tokenomics

It is used for transaction fees, staking, collateral for executing contracts, and governance. Cardano has a total supply of 45 billion ADA, with around 35 billion ADA currently in circulation.

Furthermore, Cardano employs a unique two-layer architecture, separating the settlement layer (CSL) and the computation layer (CCL).

This separation enhances flexibility and scalability, making Cardano an attractive platform for developers and users alike. Additionally, Cardano has its own token standards, allowing for the creation of custom tokens directly on the ledger.

Cardano Price Prediction - Scenario Analysis

To forecast Cardano's future price, it is crucial to consider multiple scenarios based on different market conditions and expert opinions. Let's explore some potential price predictions for Cardano.

Cardano (ADA) Price Prediction: Bullish Market

In a bullish market scenario, where positive market sentiment prevails, Cardano's price has the potential to experience significant growth. Several factors could contribute to this bullish trend, including increased adoption, technological advancements, and positive regulatory developments.

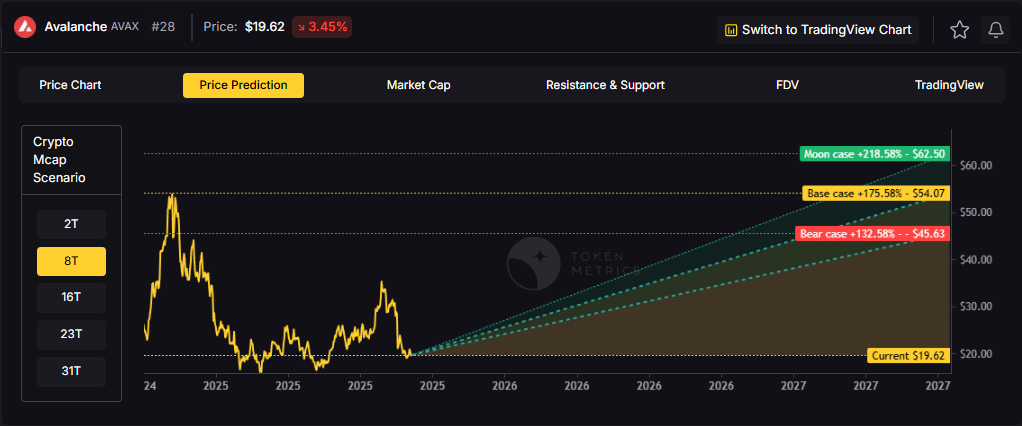
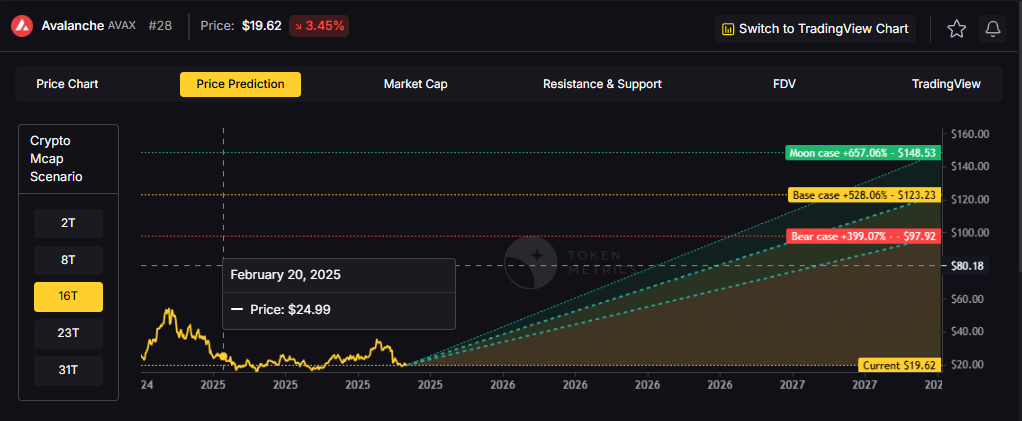
If the crypto market cap hits $3 Trillion and Cardano retains its current 1.19% dominance, its price could ascend to $1.01.

In a more bullish scenario of the crypto market surging to $10 Trillion, Cardano's price could soar to a staggering $3.38, resulting in a potential 7x return for investors.

It is important to note that these predictions are based on various factors and assumptions, and market conditions can change rapidly. However, bullish market sentiment and increased adoption of Cardano's solutions could drive its price to new heights.

Cardano Price Prediction
Start Your Free Trial Today and Uncover Your Token's Price Prediction and Forecast on Token Metrics.

Cardano (ADA) Price Prediction: Bearish Market

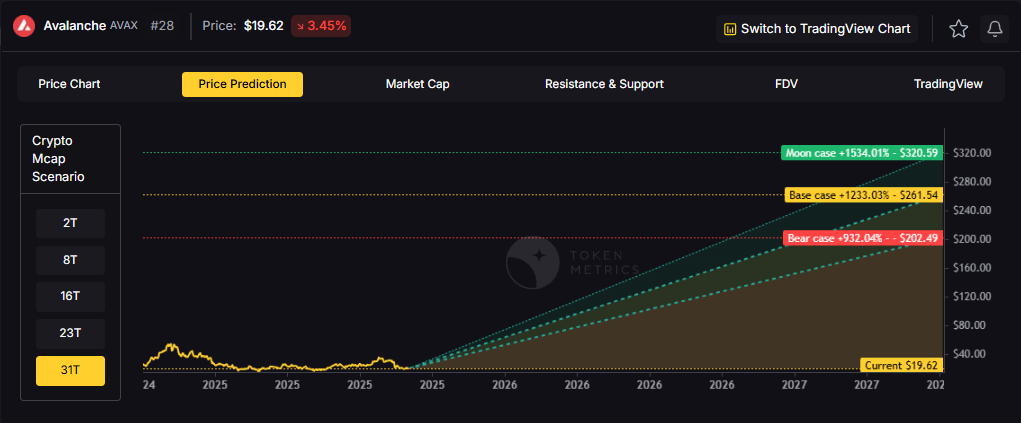
In the event of a bearish market, Cardano's price could experience a correction, potentially leading to a decrease in its value. In this case, the price of Cardano may face downward pressure with a decreased dominance of 0.59%.

In this scenario, If the crypto market cap hits $3 Trillion, Cardano could trade around $0.50 in the short term and struggle to surpass $1.69 by 2030 even if the total crypto market cap surpasses the $10 Trillion mark.

It is crucial to consider potential risks and challenges that Cardano may face. Factors such as regulatory developments, competition from other projects, and technological advancements can affect the growth trajectory of Cardano.

Also Read - Polygon Price Prediction

Cardano (ADA) Price Prediction - Industry Expert Opinion

When considering Cardano's price prediction, it is essential to take into account the opinions of industry experts. These experts analyze various factors, including market trends, technological advancements, and adoption rates, to provide insights into the future potential of Cardano.

Coinpedia platform predicts Cardano could reach $9.12 to $10.32 by 2030, and experts from Changelly forecast that it could reach minimum and maximum prices of $0.8 and $1 by the end of 2025. By the end of 2030, the price of Cardano could reach $5.50 to $6.58.

Other industry analysts have varying opinions on the future price of Cardano. Ambcrypto.com predicts that Cardano could reach $1.60 to $2.41 by 2030.

Note - Start Your Free Trial Today and Uncover Your Token's Price Prediction and Forecast on Token Metrics.

Is Cardano a Good Investment?

The investment potential of Cardano depends on several factors, such as individual risk tolerance, investment objectives, and market conditions. Many experts believe Cardano is an undervalued investment with significant growth potential in the coming years due to its wide range of applications. 

The project's innovative approach, strong community support, and prospects for future expansion have garnered attention. However, conducting thorough research, analyzing market trends, and considering the risks associated with investing in cryptocurrencies is crucial. 

Like any investment, Cardano carries both risks and rewards, given the high volatility and susceptibility to market fluctuations. It is important to comprehend the potential risks and be prepared for potential losses.

Also Read - Is Solana a Good Investment?

Cardano's Current Developments and Future Potential

Cardano has been actively working on its development roadmap and has achieved significant milestones. The project has gone through different eras, including Byron, Shelley, Goguen, Basho, and Voltaire, each introducing new features and enhancements to the platform.

Looking ahead, Cardano has ambitious plans for the future. The project aims to achieve full decentralization, improve scalability, enhance interoperability with other blockchains, and continue advancing its smart contract capabilities. 

These developments, coupled with ongoing research and community engagement, position Cardano for continued growth and adoption in the years to come.

Conclusion

Cardano (ADA) has shown promising growth potential, backed by its strong fundamentals, technological advancements, and community support. 

While the cryptocurrency market is highly volatile and unpredictable, Cardano's unique features and commitment to scientific research position it as a promising project in the blockchain industry.

When considering Cardano's price prediction, it is essential to assess various factors, including market trends, expert opinions, and the project's current developments. 

It is equally important to understand the risks and rewards associated with investing in Cardano and to make informed decisions based on thorough research and analysis.

Disclaimer

The information provided on this website does not constitute investment advice, financial advice, trading advice, or any other advice, and you should not treat any of the website's content as such.

Token Metrics does not recommend buying, selling, or holding any cryptocurrency. Conduct your due diligence and consult your financial advisor before making investment decisions.

Click here to trade cryptos at MEXC!

Contact us at promo@tokenmetrics.com for marketing and sponsorship programs.

Build Smarter Crypto Apps &
AI Agents in Minutes, Not Months
Real-time prices, trading signals, and on-chain insights all from one powerful API.
Grab a Free API Key
About Token Metrics
Token Metrics: AI-powered crypto research and ratings platform. We help investors make smarter decisions with unbiased Token Metrics Ratings, on-chain analytics, and editor-curated “Top 10” guides. Our platform distills thousands of data points into clear scores, trends, and alerts you can act on.
30 Employees
analysts, data scientists, and crypto engineers
30 Employees
analysts, data scientists, and crypto engineers
30 Employees
analysts, data scientists, and crypto engineers
Want Smarter Crypto Picks—Free?
See unbiased Token Metrics Ratings for BTC, ETH, and top alts.
Thank you! Your submission has been received!
Oops! Something went wrong while submitting the form.
 No credit card | 1-click unsubscribe
Token Metrics Team
Token Metrics Team

Recent Posts

Research

Avalanche (AVAX) 2027 Price Targets: Token Metrics Scenarios

Token Metrics Team
6 min read

AVAX in the 2027 Landscape

The Layer 1 competitive landscape is consolidating as markets recognize that specialization matters more than being a generic alternative to Ethereum. Avalanche positions itself in this multi-chain world with specific technical and ecosystem advantages. Infrastructure maturity around custody, bridges, and developer tooling makes alternative L1s more accessible heading into 2026.

The scenario projections below map different market share outcomes for AVAX across varying total crypto market sizes. Base cases assume Avalanche maintains current ecosystem momentum, while moon scenarios factor in accelerated adoption, and bear cases reflect increased competitive pressure.


Disclosure

Educational purposes only, not financial advice. Crypto is volatile, do your own research and manage risk.

How to read it: Each band blends cycle analogues and market-cap share math with TA guardrails. Base assumes steady adoption and neutral or positive macro. Moon layers in a liquidity boom. Bear assumes muted flows and tighter liquidity.

TM Agent baseline: Token Metrics lead metric for Avalanche, cashtag $AVAX, is a TM Grade of 66.2%, which maps to Hold, and the trading signal is bearish, indicating short-term downward momentum. Concise long-term numeric view, 12-month horizon: Token Metrics’ scenarios center around a price band roughly between $15 and $40, with a base case near $25. Market context: Bitcoin’s direction remains the primary market driver, so broader crypto risk-on conditions are required for $AVAX to reach the higher scenario.

Live details: Avalanche Token Details

Buy AVAX on Gemini

Affiliate Disclosure: We may earn a commission from qualifying purchases made via this link, at no extra cost to you.

Key Takeaways

  • Scenario driven, outcomes hinge on total crypto market cap, higher liquidity and adoption lift the bands.
  • Fundamentals: Fundamental Grade 91.63% (Community 82%, Tokenomics 100%, Exchange 100%, VC 97%, DeFi Scanner 83%).
  • Technology: Technology Grade 80.52% (Activity 80%, Repository 72%, Collaboration 93%, Security 59%, DeFi Scanner 83%).
  • TM Agent gist: AVAX shows decent fundamentals with a Hold grade, short-term momentum is bearish, and a 12-month range clusters around $15 to $40 with a base near $25.
  • Education only, not financial advice.

Scenario Analysis

Token Metrics scenarios span four market cap tiers, each representing different levels of crypto market maturity and liquidity:

  • 8T: At an eight trillion dollar total crypto market cap, AVAX projects to $45.63 in bear conditions, $54.07 in the base case, and $62.50 in bullish scenarios.  
  • 16T: Doubling the market to sixteen trillion expands the range to $97.92 (bear), $123.23 (base), and $148.53 (moon).  
  • 23T: At twenty-three trillion, the scenarios show $150.20, $192.38, and $234.56 respectively.  
  • 31T: In the maximum liquidity scenario of thirty-one trillion, AVAX could reach $202.49 (bear), $261.54 (base), or $320.59 (moon).  

Each tier assumes progressively stronger market conditions, with the base case reflecting steady growth and the moon case requiring sustained bull market dynamics.

Why Consider the Indices with Top-100 Exposure

Avalanche represents one opportunity among hundreds in crypto markets. Token Metrics Indices bundle AVAX with top one hundred assets for systematic exposure to the strongest projects. Single tokens face idiosyncratic risks that diversified baskets mitigate.

Historical index performance demonstrates the value of systematic diversification versus concentrated positions.

Join the early access list

What Is Avalanche?

Avalanche is a smart-contract platform known for high throughput, low latency, and a modular subnet architecture. It aims to support decentralized finance, gaming, and enterprise applications with fast finality and cost-efficient transactions.

AVAX is the native token used for fees, staking, and network security, and it powers activity across application subnets. The ecosystem positions Avalanche among leading Layer 1s competing for developer mindshare and user adoption.

Token Metrics AI Analysis

Token Metrics AI provides comprehensive context on Avalanche's positioning and challenges.

Vision: Avalanche aims to provide a highly scalable, secure, and decentralized platform for launching custom blockchains and decentralized applications. Its vision centers on enabling a global, open financial system and supporting a diverse ecosystem of interoperable blockchains.

Problem: Many blockchain networks face trade-offs between speed, security, and decentralization, often resulting in high fees and slow transaction times during peak demand. Avalanche addresses the need for a scalable and efficient infrastructure that can support widespread adoption of dApps and enterprise use cases without compromising on performance or security.

Solution: Avalanche uses a novel consensus mechanism that achieves rapid finality with low energy consumption, differentiating it from traditional Proof-of-Work systems. It employs a three-chain architecture—Exchange Chain (X-Chain), Platform Chain (P-Chain), and Contract Chain (C-Chain)—to separate functions like asset creation, staking, and smart contract execution, enhancing efficiency and scalability.

Market Analysis: Avalanche operates in the competitive Layer 1 blockchain space. It differentiates itself through its consensus protocol and support for subnet-based custom blockchains. Adoption is influenced by developer activity, partnerships, and integration with major DeFi protocols, with risks from technological shifts and regulatory developments.

Fundamental and Technology Snapshot from Token Metrics

Fundamental Grade: 91.63% (Community 82%, Tokenomics 100%, Exchange 100%, VC 97%, DeFi Scanner 83%).  

Technology Grade: 80.52% (Activity 80%, Repository 72%, Collaboration 93%, Security 59%, DeFi Scanner 83%).  

Catalysts That Skew Bullish

  • Institutional and retail access expands with ETFs, listings, and integrations.
  • Macro tailwinds from lower real rates and improving liquidity.
  • Product or roadmap milestones such as upgrades, scaling, or partnerships.

Risks That Skew Bearish

  • Macro risk-off from tightening or liquidity shocks.
  • Regulatory actions or infrastructure outages.
  • Concentration or validator economics and competitive displacement.

FAQs

Can AVAX reach $200?

Answer: Based on the scenarios, AVAX could reach $200 in the 31T bear case at $202.49. The 31T tier also shows $261.54 in the base case and $320.59 in the moon case. Not financial advice.

Can AVAX 10x from current levels?

Answer: At a current price of $19.62, a 10x would reach $196.20. This falls within the 31T bear, base, and moon cases, and the 23T moon case at $234.56. Bear in mind that 10x returns require substantial market cap expansion. Not financial advice.

Should I buy AVAX now or wait?

Answer: Timing depends on your risk tolerance and macro outlook. Current price of $19.62 sits below the 8T bear case at $45.63. Dollar-cost averaging may reduce timing risk. Not financial advice.  

Next Steps

Disclosure

Educational purposes only, not financial advice. Crypto is volatile, do your own research and manage risk.

Powered by Token Metrics

Our team delivers scenario-driven price projections, in-depth grades, and actionable indices to empower smarter crypto investing—with both human and AI insights.

Research

Hedera (HBAR) 2027 Price Targets: Token Metrics Scenarios

Token Metrics Team
8 min read

Portfolio Context for Hedera: Diversification in the 2027 Landscape

Layer 1 tokens like Hedera represent bets on specific blockchain architectures winning developer and user mindshare. HBAR carries both systematic crypto risk and unsystematic risk from Hedera's technical roadmap execution and ecosystem growth. Multi-chain thesis suggests diversifying across several L1s rather than concentrating in one, since predicting which chains will dominate remains difficult.

The projections below show how HBAR might perform under different market cap scenarios. While Hedera may have strong fundamentals, prudent portfolio construction balances L1 exposure across Ethereum, competing smart contract platforms, and Bitcoin to capture the sector without overexposure to any single chain's fate.


Disclosure

Educational purposes only, not financial advice. Crypto is volatile, do your own research and manage risk.

How to read it: Each band blends cycle analogues and market-cap share math with TA guardrails. Base assumes steady adoption and neutral or positive macro. Moon layers in a liquidity boom. Bear assumes muted flows and tighter liquidity.

TM Agent baseline:

Token Metrics lead metric for Hedera, cashtag $HBAR, is a TM Grade of 61.8%, which maps to Hold, and the trading signal is bearish, indicating short-term downward momentum. This means Token Metrics views $HBAR as having reasonably solid fundamentals but limited conviction for strong outperformance in the near term.

A concise long-term numeric view for a 12-month horizon: Token Metrics scenarios center around a range of about $0.06 to $0.18, with a base case near $0.10, reflecting steady ecosystem growth, moderate adoption of Hedera services, and continued enterprise partnerships. Implication: if Bitcoin and broader crypto risk appetite improve, $HBAR could revisit the higher end, while a risk-off market or slower-than-expected developer traction would keep it toward the lower bound.

Live details: Token Details

Key Takeaways

  • Scenario driven, outcomes hinge on total crypto market cap, higher liquidity and adoption lift the bands.
  • Single-asset concentration amplifies both upside and downside versus diversified approaches.
  • Fundamentals: Fundamental Grade 81.08% (Community 74%, Tokenomics 100%, Exchange 100%, VC 59%, DeFi Scanner 85%).
  • Technology: Technology Grade 62.39% (Activity 58%, Repository 68%, Collaboration 74%, Security 56%, DeFi Scanner 85%).
  • TM Agent gist: bearish short term, range view with upside if crypto risk appetite improves.
  • Education only, not financial advice.

Scenario Analysis

Token Metrics scenarios span four market cap tiers, each representing different levels of crypto market maturity and liquidity:

  • 8T: At an 8 trillion dollar total crypto market cap, HBAR projects to $0.27 in bear conditions, $0.32 in the base case, and $0.37 in bullish scenarios.  
  • 16T: Doubling the market to 16 trillion expands the range to $0.42 (bear), $0.57 (base), and $0.72 (moon).  
  • 23T: At 23 trillion, the scenarios show $0.56, $0.82, and $1.07 respectively.  
  • 31T: In the maximum liquidity scenario of 31 trillion, HBAR could reach $0.71 (bear), $1.07 (base), or $1.42 (moon).  

These ranges illustrate potential outcomes for concentrated HBAR positions, but investors should weigh whether single-asset exposure matches their risk tolerance or whether diversified strategies better suit their objectives.

The Case for Diversified Index Exposure

Professional investors across asset classes prefer diversified exposure over concentrated bets for good reason. Hedera faces numerous risks - technical vulnerabilities, competitive pressure, regulatory targeting, team execution failure - any of which could derail HBAR performance independent of broader market conditions. Token Metrics Indices spread this risk across one hundred tokens, ensuring no single failure destroys your crypto portfolio.

Diversification becomes especially critical in crypto given the sector's nascency and rapid evolution. Technologies and narratives that dominate today may be obsolete within years as the space matures. By holding HBAR exclusively, you're betting not only on crypto succeeding but on Hedera specifically remaining relevant. Index approaches hedge against picking the wrong horse while maintaining full crypto exposure.

Tax efficiency and rebalancing challenges also favor indices over managing concentrated positions. Token Metrics Indices handle portfolio construction, rebalancing, and position sizing systematically, eliminating the emotional and logistical burden of doing this manually with multiple tokens.

Early access to Token Metrics Indices 

What Is Hedera?

Hedera is a high-performance public ledger that emphasizes speed, low fees, and energy efficiency, positioning itself for enterprise and decentralized applications. It uses a unique Hashgraph consensus that enables fast finality and high throughput, paired with a council-governed model that targets real-world use cases like payments, tokenization, and decentralized identity.

HBAR is the native token used for fees, staking, and network security, and it supports smart contracts and decentralized file storage. Adoption draws from partnerships and integrations, though decentralization levels and reliance on institutional demand are often discussed in the community.

Token Metrics AI Analysis

Token Metrics AI provides comprehensive context on Hedera's positioning and challenges.

  • Vision: Hedera's vision is to provide a secure, fair, and scalable distributed ledger technology platform that supports decentralized applications and enterprise use cases globally. It emphasizes governed decentralization, aiming to combine the benefits of distributed systems with responsible oversight through its council-based governance model.
  • Problem: Many blockchain networks face trade-offs between scalability, security, and decentralization, often resulting in high transaction fees, slow processing times, or environmental concerns. Hedera aims to address these limitations by offering a system that supports high throughput and fast finality without sacrificing security or incurring significant energy costs, making it suitable for both enterprise and decentralized applications.
  • Solution: Hedera uses the Hashgraph consensus algorithm, a directed acyclic graph (DAG)-based approach that achieves asynchronous Byzantine fault tolerance, enabling fast, secure, and fair transaction processing. The network supports smart contracts, tokenization, and decentralized file storage, with HBAR serving as the native token for fees, staking, and network security. Its council-governed model aims to ensure stability and trust, particularly for institutional and enterprise users.
  • Market Analysis: Hedera operates in the Layer 1 blockchain space, competing with high-throughput platforms like Solana, Avalanche, and Algorand, while differentiating through its Hashgraph consensus and governed governance model. It targets enterprise adoption, focusing on use cases in supply chain, payments, and asset tokenization, which sets it apart from more community-driven or DeFi-centric networks. Adoption is influenced by strategic partnerships, developer engagement, and real-world integrations rather than speculative activity. Key risks include competition from established and emerging blockchains, regulatory scrutiny around governance tokens, and challenges in achieving broad decentralization.

Fundamental and Technology Snapshot from Token Metrics

Fundamental Grade: 81.08% (Community 74%, Tokenomics 100%, Exchange 100%, VC 59%, DeFi Scanner 85%).  

Technology Grade: 62.39% (Activity 58%, Repository 68%, Collaboration 74%, Security 56%, DeFi Scanner 85%).  

Catalysts That Skew Bullish

  • Institutional and retail access expands with ETFs, listings, and integrations.
  • Macro tailwinds from lower real rates and improving liquidity.
  • Product or roadmap milestones such as upgrades, scaling, or partnerships.

Risks That Skew Bearish

  • Macro risk-off from tightening or liquidity shocks.
  • Regulatory actions or infrastructure outages.
  • Concentration or validator economics and competitive displacement.
  • Protocol-specific execution risk and competitive pressure from alternatives.

FAQs

Can HBAR reach $1.00?

Yes. Based on the scenarios, HBAR could reach $1.00 or above in the higher tiers. The 23T tier projects $1.07 in the moon case and the 31T tier projects $1.42 in the moon case. Achieving this requires broad market cap expansion and Hedera maintaining competitive position. Not financial advice.

What price could HBAR reach in the moon case?

Moon case projections range from $0.37 at 8T to $1.42 at 31T. These scenarios assume maximum liquidity expansion and strong Hedera adoption. Diversified strategies aim to capture upside across multiple tokens rather than betting exclusively on any single moon scenario. Not financial advice.

What's the risk/reward profile for HBAR?

Risk and reward span from $0.27 in the lowest bear case to $1.42 in the highest moon case. Downside risks include regulatory or infrastructure setbacks and competitive pressure, while upside drivers include improved liquidity and enterprise adoption. Concentrated positions amplify both tails, while diversified strategies smooth outcomes.  

Next Steps

Disclosure

Educational purposes only, not financial advice. Crypto is volatile, concentration amplifies risk, and diversification is a fundamental principle of prudent portfolio construction. Do your own research and manage risk appropriately.

Research

Predicting LEO Token Price in 2027: Scenario Analysis & On-Chain Scores

Token Metrics Team
5 min read

LEO Token Valuation Framework: Market Cap Scenarios

Exchange tokens desrive value from trading volume and platform revenue, creating linkage between crypto market activity and LEO price action. LEO Token delivers utility through reduced trading fees and enhanced platform services on Bitfinex and iFinex across Ethereum and EOS. Token Metrics scenarios below model LEO outcomes across different total crypto market cap environments.


Disclosure

Educational purposes only, not financial advice. Crypto is volatile, do your own research and manage risk.

How to read it: Each band blends cycle analogues and market-cap share math with TA guardrails. Base assumes steady adoption and neutral or positive macro. Moon layers in a liquidity boom. Bear assumes muted flows and tighter liquidity.

TM Agent baseline: Token Metrics probabilities favor a modest range between about $5 and $15, with a base case around current levels near $9, conditional on exchange token utility remaining steady, and downside risk if centralized exchange macro pressure increases.

Live details: Token Details 

Key Takeaways

  • Scenario driven, outcomes hinge on total crypto market cap, higher liquidity and adoption lift the bands.
  • TM Agent gist: 12-month horizon favors $5 to $15 range with base case near $9, contingent on stable exchange utility.
  • Education only, not financial advice.

Scenario Analysis

Token Metrics scenarios span four market cap tiers reflecting different crypto market maturity levels:

  • 8T: At 8 trillion total crypto market cap, LEO projects to $11.35 in bear conditions, $12.92 in the base case, and $14.48 in bullish scenarios.  
  • 16T: At 16 trillion total crypto market cap, LEO projects to $14.82 in bear conditions, $19.51 in the base case, and $24.20 in bullish scenarios.  
  • 23T: At 23 trillion total crypto market cap, LEO projects to $18.28 in bear conditions, $26.10 in the base case, and $33.92 in bullish scenarios.  
  • 31T: At 31 trillion total crypto market cap, LEO projects to $21.74 in bear conditions, $32.69 in the base case, and $43.63 in bullish scenarios.  

What Is LEO Token?

LEO Token is the native utility token of the Bitfinex and iFinex ecosystem, designed to provide benefits like reduced trading fees, enhanced lending and borrowing terms, and access to exclusive features on the platform. It operates on both Ethereum (ERC-20) and EOS blockchains, offering flexibility for users.

The primary role of LEO is to serve as a utility token within the exchange ecosystem, enabling fee discounts, participation in token sales, and other platform-specific advantages. Common usage patterns include holding LEO to reduce trading costs and utilizing it for enhanced platform services, positioning it primarily within the exchange token sector.

Catalysts That Skew Bullish

  • Institutional and retail access expands with ETFs, listings, and integrations.
  • Macro tailwinds from lower real rates and improving liquidity.
  • Product or roadmap milestones such as upgrades, scaling, or partnerships.

Risks That Skew Bearish

  • Macro risk-off from tightening or liquidity shocks.
  • Regulatory actions or infrastructure outages.
  • Concentration or validator economics and competitive displacement.

FAQs

What gives LEO value?

LEO accrues value through reduced trading fees and enhanced platform services within the Bitfinex and iFinex ecosystem. Demand drivers include exchange usage and access to platform features, while supply dynamics follow the token’s exchange utility design. Value realization depends on platform activity and user adoption.

What price could LEO reach in the moon case?

Moon case projections range from $14.48 at 8T to $43.63 at 31T. These scenarios require maximum market cap expansion and strong exchange activity. Not financial advice.  

Next Steps

Curious how these forecasts are made? Token Metrics delivers LEO on-chain grades, forecasts, and deep research on 6,000+ tokens. Instantly compare fundamentals, on-chain scores, and AI-powered predictions.

Disclosure

Educational purposes only, not financial advice. Crypto is volatile, do your own research and manage risk.

Choose from Platinum, Gold, and Silver packages
Reach with 25–30% open rates and 0.5–1% CTR
Craft your own custom ad—from banners to tailored copy
Perfect for Crypto Exchanges, SaaS Tools, DeFi, and AI Products