Research

Practical Guide to Claude API Integration

Explore how the Claude API works, integration patterns, safety considerations, and practical best practices to build context-aware AI assistants and generation pipelines.
Token Metrics Team
4
MIN

The Claude API is increasingly used to build context-aware AI assistants, document summarizers, and conversational workflows. This guide breaks down what the API offers, integration patterns, capability trade-offs, and practical safeguards to consider when embedding Claude models into production systems.

Overview: What the Claude API Provides

The Claude API exposes access to Anthropic’s Claude family of large language models. At a high level, it lets developers send prompts and structured instructions and receive text outputs, completions, or assistant-style responses. Key delivery modes typically include synchronous completions, streaming tokens for low-latency interfaces, and tools for handling multi-turn context. Understanding input/output semantics and token accounting is essential before integrating Claude into downstream applications.

Capabilities & Feature Surface

Claude models are designed for safety-focused conversational AI and often emphasize instruction following and helpfulness while applying content filters. Typical features to assess:

  • Instruction clarity: Claude responds robustly to explicit, structured instructions and system-level guidelines embedded in prompts.
  • Context handling: Larger context windows enable multi-turn memory and long-document summarization; analyze limits for your use case.
  • Streaming vs batch: Streaming reduces perceived latency in chat apps. Batch completions suit offline generation and analytics tasks.
  • Safety layers: Built-in moderation and safety heuristics can reduce harmful outputs but should not replace application-level checks.

Integration Patterns & Best Practices

Designing a robust integration with the Claude API means balancing performance, cost, and safety. Practical guidance:

  1. Prompt engineering: Build modular prompts: system instructions, user content, and optional retrieval results. Keep system prompts explicit and version-controlled.
  2. Context management: Implement truncation or document retrieval to stay within context limits. Use semantic search to surface the most relevant chunks before calling Claude.
  3. Latency strategies: Use streaming for interactive UI and batch for background processing. Cache frequent completions when possible to reduce API calls.
  4. Safety & validation: Post-process outputs with rule-based checks, content filters, or secondary moderation models to catch hallucinations or policy violations.
  5. Monitoring: Track token usage, latency percentiles, and error rates. Instrument prompts to correlate model changes with downstream metrics.

Primary Use Cases and Risk Considerations

Claude API use cases span chat assistants, summarization, prompt-driven code generation, and domain-specific Q&A. For each area evaluate these risk vectors:

  • Hallucination risk: Models may fabricate facts; rely on provenance and retrieval augmentation when answers require accuracy.
  • Privacy: Avoid sending sensitive personal data unless contract and data processing terms explicitly permit it.
  • Regulatory exposure: For regulated domains (health, legal, finance) include human oversight and compliance review rather than treating outputs as authoritative.
  • Operational cost: Longer contexts and high throughput increase token costs; profile realistic workloads before scaling.

Tools, Libraries, and Ecosystem Fit

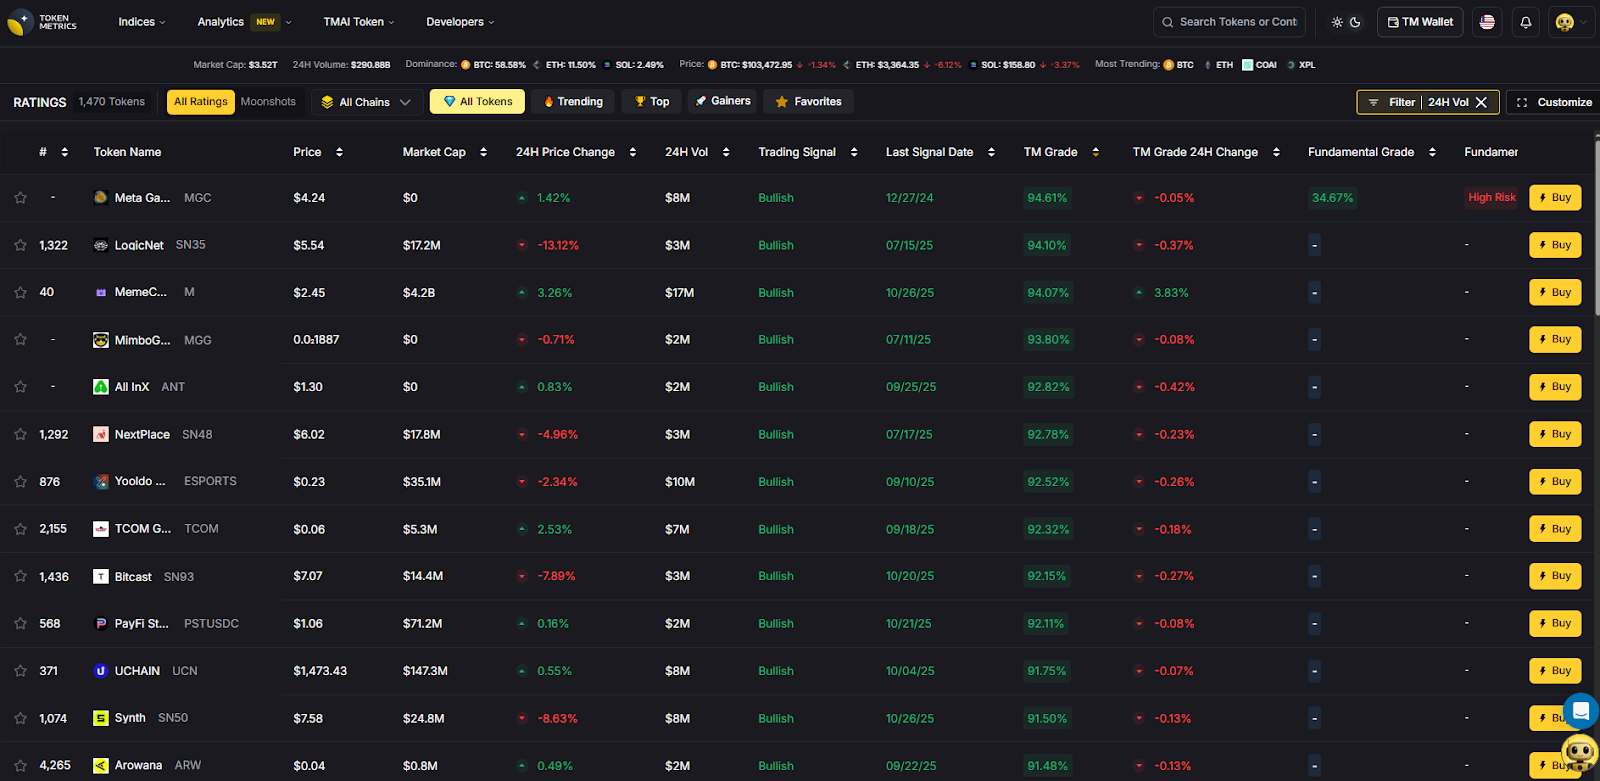
Tooling around Claude often mirrors other LLM APIs: HTTP/SDK clients, streaming libraries, and orchestration frameworks. Combine the Claude API with retrieval-augmented generation (RAG) systems, vector stores for semantic search, and lightweight caching layers. AI-driven research platforms such as Token Metrics can complement model outputs by providing analytics and signal overlays when integrating market or on-chain data into prompts.

Build Smarter Crypto Apps & AI Agents with Token Metrics

Token Metrics provides real-time prices, trading signals, and on-chain insights all from one powerful API. Grab a Free API Key

FAQ — What is the Claude API?

The Claude API is an interface for sending prompts and receiving text-based model outputs from the Claude family. It supports completions, streaming responses, and multi-turn conversations, depending on the provider’s endpoints.

FAQ — How do I manage long documents and context?

Implement a retrieval-augmented generation (RAG) approach: index documents into a vector store, use semantic search to fetch relevant segments, and summarize or stitch results before sending a concise prompt to Claude. Also consider chunking and progressive summarization when documents exceed context limits.

FAQ — How can I control API costs?

Optimize prompts to be concise, cache common responses, batch non-interactive requests, and choose lower-capacity model variants for non-critical tasks. Monitor token usage and set alerts for unexpected spikes.

FAQ — What safety measures are recommended?

Combine Claude’s built-in safety mechanisms with application-level filters, content validation, and human review workflows. Avoid sending regulated or sensitive data without proper agreements and minimize reliance on unverified outputs.

FAQ — When should I use streaming vs batch responses?

Use streaming for interactive chat interfaces where perceived latency matters. Batch completions are suitable for offline processing, analytics, and situations where full output is required before downstream steps.

Disclaimer

This article is for educational purposes only and does not constitute professional, legal, or financial advice. It explains technical capabilities and integration considerations for the Claude API without endorsing specific implementations. Review service terms, privacy policies, and applicable regulations before deploying AI systems in production.

Build Smarter Crypto Apps &
AI Agents in Minutes, Not Months
Real-time prices, trading signals, and on-chain insights all from one powerful API.
Grab a Free API Key
Token Metrics Team
Token Metrics Team

Recent Posts

Research

Why Manual Crypto Portfolio Management Is Costing You Money (And Time)

Token Metrics Team
6
MIN

You're tracking 50+ tokens across three exchanges, updating your rebalancing spreadsheet every weekend, and second-guessing every exit decision at 2 AM. Sound familiar? Manual crypto portfolio management isn't just exhausting—it's expensive. Between missed rebalances, execution drag, and behavioral mistakes during volatility, DIY portfolio management quietly erodes returns before you see any market gains.

The data tells the story: investors who manually manage diversified crypto portfolios typically underperform comparable automated strategies by 12-18% annually, with 60% of that gap coming from operational inefficiency rather than market timing. If you're spending 10+ hours weekly maintaining positions, those hours have a cost—and it's higher than you think.

The Hidden Costs Destroying Your Returns

Time Drain: The 500-Hour Tax

Managing a diversified crypto portfolio demands constant vigilance. For investors holding 20+ positions, the weekly time investment breaks down to approximately:

  • Market monitoring: 5-8 hours tracking prices, news, and on-chain metrics
  • Rebalancing calculations: 2-3 hours determining optimal weights and required trades
  • Order execution: 3-5 hours placing trades across multiple platforms
  • Record keeping: 1-2 hours logging transactions for tax reporting
  • Research updates: 3-5 hours staying current on project developments

That's 14-23 hours weekly, or 728-1,196 hours annually. At a conservative $50/hour opportunity cost, you're spending $36,400-$59,800 in time value maintaining your portfolio. Even if you value your time at minimum wage, that's still $10,000+ in annual "sweat equity" that automated solutions eliminate.

Execution Drag: Death by a Thousand Trades

Small trades erode portfolios through accumulated friction. Every manual rebalance across a 50-token portfolio requires dozens of individual transactions, each incurring:

  • Trading fees: 0.1-0.5% per trade (average 0.25%)
  • Bid-ask spreads: 0.2-0.8% depending on liquidity
  • Slippage: 0.3-1.2% on smaller cap tokens
  • Gas fees: $2-50 per transaction depending on network congestion

For a $100,000 portfolio rebalanced monthly with 40 trades per rebalance, the costs add up:

  • Average cost per trade: ~$100
  • Monthly execution drag: $4,000
  • Annual execution drag: $48,000 (48% of portfolio value)

The smaller your individual trades, the worse the ratio becomes. A $500 rebalancing trade on a low-liquidity altcoin might pay $25 in fees—a 5% instant loss before any price movement.

Automated indices solve this. TM Global 100, Token Metrics' rules-based index, consolidates 100 individual positions into a single transaction at purchase, with weekly rebalances executed through optimized smart contract batching. Users typically save 3-7% annually in execution costs alone compared to manual approaches.

Behavioral Mistakes: Your Worst Enemy Is in the Mirror

Market psychology research shows that manual portfolio managers tend to make predictable, costly mistakes:

  • Panic selling during drawdowns: When Bitcoin drops 25% in a week, can you stick to your exit rules? Many override their plans during high volatility, often selling near local bottoms.
  • FOMO buying at peaks: Tokens up 300% in a week attract chase behavior, with managers entering after the movement is mostly over.
  • Rebalancing procrastination: Putting off rebalancing leads to drift, holding too much of past winners and missing new opportunities.

Token Metrics' systematic approach removes emotion from the equation. The TM Global 100 Index follows a transparent ruleset: hold the top 100 tokens by market cap during bullish phases, shift to stablecoins during bearish cycles, and rebalance weekly—eliminating emotional override and procrastination.

Missed Rebalances: Drifting Out of Position

Market cap rankings shift constantly. A token ranked #73 on Monday might hit #95 by Friday, or surge to #58. Without systematic rebalancing, your portfolio becomes a collection of recent winners or dumpers.

In Q3 2024, Solana ecosystem tokens surged while Ethereum DeFi tokens consolidated. Manual managers who missed weekly rebalances held too much ETH and insufficient SOL exposure. The result: 15-20% underperformance compared to systematically rebalanced portfolios. Data from Token Metrics shows that weekly rebalancing outperforms monthly or quarterly approaches by 8-12% annually.

Tax Reporting Nightmares

Every trade creates a taxable event. Manual managers executing over 200 trades yearly face:

  • Hours spent compiling transaction logs
  • Reconciliation across multiple exchanges
  • Cost-basis tracking for numerous lots
  • High professional accounting fees ($500-2,000+)

Automated solutions like Token Metrics provide transparent transaction logs for each rebalance, simplifying tax reporting and reducing accounting costs.

The Token Metrics Advantage: Research Meets Execution

Token Metrics has established itself as a leading crypto analytics platform, supporting over 50,000 users with AI-powered token ratings, market regime detection, portfolio optimization tools, and trading signals. But analysis alone isn't enough—implementation is crucial.

TM Global 100 Index bridges this gap. It turns research into actionable, tradeable products by automating rebalancing based on Token Metrics' signals and methodology. One click replaces hours of manual work, following a validated systematic approach.

Automation Without Compromise

The best automation is transparent. TM Global 100 offers:

  • Rules-Based Discipline: Bull markets—hold top 100 tokens; bear markets—move to stablecoins
  • Weekly rebalancing every Monday
  • Full methodology disclosure
  • One-Click execution via embedded self-custodial wallet
  • Real-time market insights and holdings visualization
  • Transaction logs with fees and timestamps

This streamlined process allows users to rapidly execute disciplined rebalancing, saving countless hours and increasing operational efficiency while maintaining asset control.

Decision Framework: When to Automate

Automation suits investors who:

  • Hold 15+ tokens and find rebalancing burdensome
  • Miss optimal rebalancing windows due to time constraints
  • Have experienced emotional trading decisions during volatility
  • Spend over 5 hours a week on portfolio management
  • Want broad exposure without manual tracking

Manual management may be suitable for those with fewer positions, active trading infrastructure, or tactical strategies. For most diversified portfolios, automation enhances efficiency and reduces operational errors.

The Compound Effect of Efficiency

Small inefficiencies compound over time. Over five years, a $50,000 portfolio managed manually with a 12% annual return minus 4-2-1% losses yields roughly a 5% net return, ending at about $63,814. A systematic approach with optimizer integration, zero behavioral errors, and regular rebalancing can attain a 13% net return, reaching approximately $92,246—an increase of over $28,000, not counting time saved.

Conclusion: Time Back, Returns Up

Manual crypto portfolio management made sense when portfolios were small and concentrated. Today’s diversified sets require operational discipline to prevent erosion of returns due to execution drag, missed rebalances, and emotional mistakes. Token Metrics built TM Global 100 to turn research into automated, transparent execution, reclaim your time, and boost portfolio discipline—without sacrificing control.

Research

Moonshots API: Discover Breakout Tokens Before the Crowd

Token Metrics Team
5
MIN

The biggest gains in crypto rarely come from the majors. They come from Moonshots—fast-moving tokens with breakout potential. The Moonshots API surfaces these candidates programmatically so you can rank, alert, and act inside your product. In this guide, you’ll call /v2/moonshots, display a high-signal list with TM Grade and Bullish tags, and wire it into bots, dashboards, or screeners in minutes. Start by grabbing your key at Get API Key, then Run Hello-TM and Clone a Template to ship fast.

What You’ll Build in 2 Minutes

Why This Matters

Discovery that converts. Users want more than price tickers, they want a curated, explainable list of high-potential tokens. The Moonshots API encapsulates multiple signals into a short list designed for exploration, alerts, and watchlists you can monetize.

Built for builders. The endpoint returns a consistent schema with grade, signal, and context so you can immediately sort, badge, and trigger workflows. With predictable latency and clear filters, you can scale to dashboards, mobile apps, and headless bots without reinventing the discovery pipeline.

Where to Find The Moonshots API

The cURL request for the Moonshots endpoint is displayed in the top right of the API Reference. Grab it and start tapping into the potential!

How It Works (Under the Hood)

The Moonshots endpoint aggregates a set of evidence—often combining TM Grade, signal state, and momentum/volume context—into a shortlist of breakout candidates. Each row includes a symbol, grade, signal, and timestamp, plus optional reason tags for transparency.

For UX, a common pattern is: headline list → token detail where you render TM Grade (quality), Trading Signals (timing), Support/Resistance (risk placement), Quantmetrics (risk-adjusted performance), and Price Prediction scenarios. This enables users to understand why a token was flagged and how to act with risk controls.

Polling vs webhooks. Dashboards typically poll with short-TTL caching. Alerting flows use scheduled jobs or webhooks to smooth traffic and avoid duplicates. Always make notifications idempotent.

Production Checklist

Use Cases & Patterns

Next Steps

FAQs

1) What does the Moonshots API return?

A list of breakout candidates with fields such as symbol, tm_grade, signal (often Bullish/Bearish), optional reason tags, and updated_at. Use it to drive discover tabs, alerts, and watchlists.

2) How fresh is the list? What about latency/SLOs?

The endpoint targets predictable latency and timely updates for dashboards and alerts. Use short-TTL caching and queued jobs/webhooks to avoid bursty polling.

3) How do I use Moonshots in a trading workflow?

Common stack: Moonshots for discovery, Trading Signals for timing, Support/Resistance for SL/TP, Quantmetrics for sizing, and Price Prediction for scenario context. Always backtest and paper-trade first.

4) I saw results like “+241%” and a “7.5% average return.” Are these guaranteed?

No. Any historical results are illustrative and not guarantees of future performance. Markets are risky; use risk management and testing.

5) Can I filter the Moonshots list?

Yes—pass parameters like min_grade, signal, and limit (as supported) to tailor to your audience and keep pages fast.

6) Do you provide SDKs or examples?

REST works with JavaScript and Python snippets above. Docs include quickstarts, Postman collections, and templates—start with Run Hello-TM.

7) Pricing, limits, and enterprise SLAs?

Begin free and scale up. See API plans for rate limits and enterprise options.

Research

Support and Resistance API: Auto-Calculate Smart Levels for Better Trades

Token Metrics Team
4
MIN

Most traders still draw lines by hand in TradingView. The support and resistance API from Token Metrics auto-calculates clean support and resistance levels from one request, so your dashboard, bot, or alerts can react instantly. In minutes, you’ll call /v2/resistance-support, render actionable levels for any token, and wire them into stops, targets, or notifications. Start by grabbing your key on Get API Key, then Run Hello-TM and Clone a Template to ship a production-ready feature fast.

What You’ll Build in 2 Minutes

A minimal script that fetches Support/Resistance via /v2/resistance-support for a symbol (e.g., BTC, SOL).

  • A one-liner curl to smoke-test your key.
  • A UI pattern to display nearest support, nearest resistance, level strength, and last updated time.

Next Endpoints to add

  • /v2/trading-signals (entries/exits)
  • /v2/hourly-trading-signals (intraday updates)
  • /v2/tm-grade (single-score context)
  • /v2/quantmetrics (risk/return framing)

Why This Matters

Precision beats guesswork. Hand-drawn lines are subjective and slow. The support and resistance API standardizes levels across assets and timeframes, enabling deterministic stops and take-profits your users (and bots) can trust.

Production-ready by design. A simple REST shape, predictable latency, and clear semantics let you add levels to token pages, automate SL/TP alerts, and build rule-based execution with minimal glue code.

Where to Find

Need the Support and Resistance data? The cURL request for it is in the top right of the API Reference for quick access.

👉 Keep momentum: Get API Key • Run Hello-TM • Clone a Template

How It Works (Under the Hood)

The Support/Resistance endpoint analyzes recent price structure to produce discrete levels above and below current price, along with strength indicators you can use for priority and styling. Query /v2/resistance-support?symbol=<ASSET>&timeframe=<HORIZON> to receive arrays of level objects and timestamps.

Polling vs webhooks. For dashboards, short-TTL caching and batched fetches keep pages snappy. For bots and alerts, use queued jobs or webhooks (where applicable) to avoid noisy, bursty polling—especially around market opens and major events.

Production Checklist

  • Rate limits: Respect plan caps; add client-side throttling.
  • Retries/backoff: Exponential backoff with jitter for 429/5xx; log failures.
  • Idempotency: Make alerting and order logic idempotent to prevent duplicates.
  • Caching: Memory/Redis/KV with short TTLs; pre-warm top symbols.
  • Batching: Fetch multiple assets per cycle; parallelize within rate limits.
  • Threshold logic: Add %-of-price buffers (e.g., alert at 0.3–0.5% from level).
  • Error catalog: Map common 4xx/5xx to actionable user guidance; keep request IDs.
  • Observability: Track p95/p99; measure alert precision (touch vs approach).
  • Security: Store API keys in a secrets manager; rotate regularly.

Use Cases & Patterns

  • Bot Builder (Headless): Use nearest support for stop placement and nearest resistance for profit targets. Combine with /v2/trading-signals for entries/exits and size via Quantmetrics (volatility, drawdown).
  • Dashboard Builder (Product): Add a Levels widget to token pages; badge strength (e.g., High/Med/Low) and show last touch time. Color the price region (below support, between levels, above resistance) for instant context.
  • Screener Maker (Lightweight Tools): “Close to level” sort: highlight tokens within X% of a strong level. Toggle alerts for approach vs breakout events.
  • Risk Management: Create policy rules like “no new long if price is within 0.2% of strong resistance.” Export daily level snapshots for audit/compliance.

Next Steps

  • Get API Key — generate a key and start free.
  • Run Hello-TM — verify your first successful call.
  • Clone a Template — deploy a levels panel or alerts bot today.
  • Watch the demo: Compare plans: Scale confidently with API plans.

FAQs

1) What does the Support & Resistance API return?

A JSON payload with arrays of support and resistance levels for a symbol (and optional timeframe), each with a price and strength indicator, plus an update timestamp.

2) How timely are the levels? What are the latency/SLOs?

The endpoint targets predictable latency suitable for dashboards and alerts. Use short-TTL caching for UIs, and queued jobs or webhooks for alerting to smooth traffic.

3) How do I trigger alerts or trades from levels?

Common patterns: alert when price is within X% of a level, touches a level, or breaks beyond with confirmation. Always make downstream actions idempotent and respect rate limits.

4) Can I combine levels with other endpoints?

Yes—pair with /v2/trading-signals for timing, /v2/tm-grade for quality context, and /v2/quantmetrics for risk sizing. This yields a complete decide-plan-execute loop.

5) Which timeframe should I use?

Intraday bots prefer shorter horizons; swing/position dashboards use daily or higher-timeframe levels. Offer a timeframe toggle and cache results per setting.

6) Do you provide SDKs or examples?

Use the REST snippets above (JS/Python). The docs include quickstarts, Postman collections, and templates—start with Run Hello-TM.

7) Pricing, limits, and enterprise SLAs?

Begin free and scale as you grow. See API plans for rate limits and enterprise SLA options.

Disclaimer

This content is for educational purposes only and does not constitute financial advice. Always conduct your own research before making any trading decisions.

Choose from Platinum, Gold, and Silver packages
Reach with 25–30% open rates and 0.5–1% CTR
Craft your own custom ad—from banners to tailored copy
Perfect for Crypto Exchanges, SaaS Tools, DeFi, and AI Products