Crypto Basics

Crypto HODL: The Long-Term Investment Strategy for Building Wealth in 2025

Learn the meaning of HODL in crypto, why it works, and how to build a long-term cryptocurrency portfolio in 2025 with AI-powered insights.
Token Metrics Team
6 min
MIN

Introduction to HODL

If you’ve spent any time in cryptocurrency communities, you’ve likely seen the term HODL. Originally a misspelling of “hold” on an online Bitcoin forum in 2013, HODL has become much more than a typo—it’s now a core investment philosophy for crypto enthusiasts worldwide.

In 2025, HODLing remains one of the most effective long-term strategies for building wealth in cryptocurrency. By holding onto fundamentally strong assets through market volatility, investors can capture long-term gains while avoiding emotional, short-term trading mistakes. This article explores what HODLing means, why it works, the best assets to HODL, and how platforms like Token Metrics can help optimize your strategy.

What Does HODL Mean?

HODL means buying and holding cryptocurrency for an extended period, regardless of short-term price fluctuations. Unlike traders who attempt to time the market, HODLers adopt a long-term mindset, trusting that the value of quality assets will increase over time.

This strategy is rooted in the belief that blockchain technology and digital assets are here to stay, and that short-term market noise shouldn’t derail long-term conviction.

The Psychology Behind HODLing

Crypto markets are notoriously volatile, with sudden price swings that can lead to emotional decision-making. HODLing combats this by:

  • Avoiding Panic Selling: Reducing the risk of selling at a loss during downturns.
  • Maintaining Discipline: Encouraging investors to stick to their long-term plans.
  • Embracing Market Cycles: Understanding that crypto goes through bull and bear phases, but strong assets tend to recover and grow over time.

By committing to HODLing, investors can overcome emotional biases and stay focused on their long-term goals.

Why HODL Works in 2025

  1. Capturing Long-Term Gains:
    Historically, assets like Bitcoin and Ethereum have rewarded long-term holders with substantial returns, despite short-term volatility.

  2. Lower Trading Costs:
    By minimizing active trading, HODLers save on transaction fees and reduce tax implications from frequent trades.

  3. Compounding Growth:
    Holding allows you to benefit from price appreciation and participate in opportunities like staking or earning yield on your crypto.

  4. Simplicity:
    HODLing is straightforward—buy quality assets, store them securely, and wait.

Best Cryptocurrencies to HODL in 2025

While any coin can be HODLed, the best long-term candidates are projects with strong fundamentals, proven track records, and growing ecosystems:
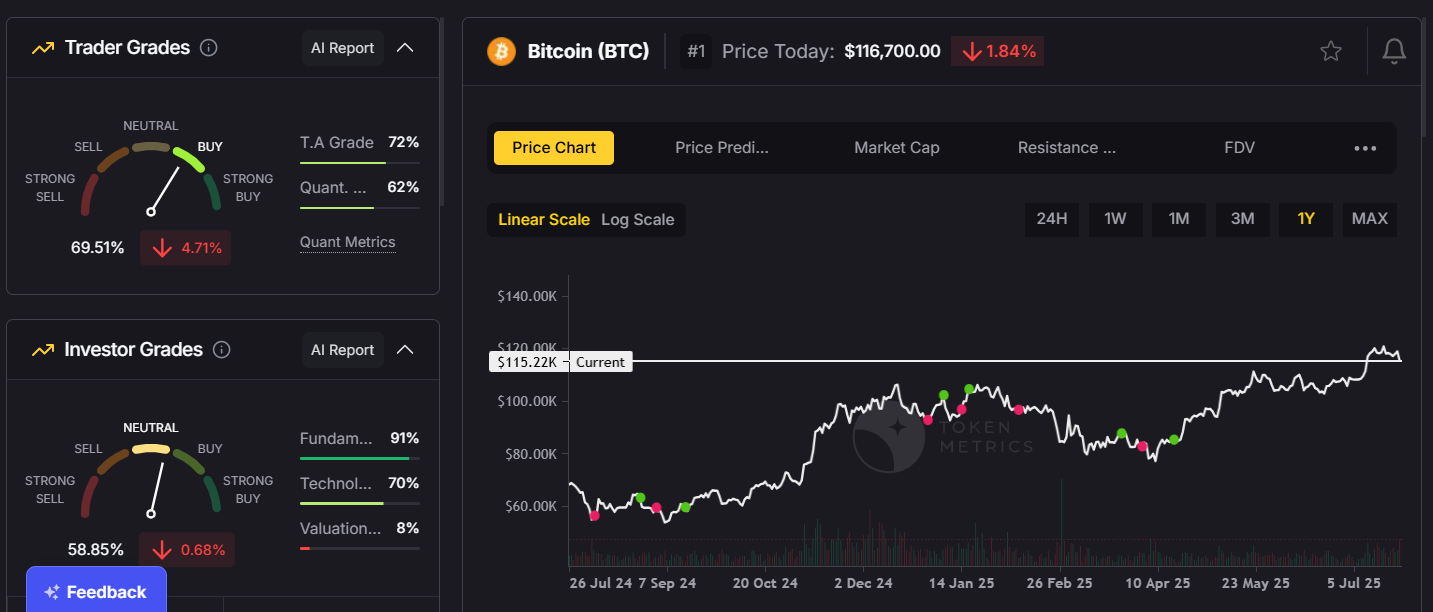
  • Bitcoin (BTC):
    Known as digital gold, Bitcoin remains the most secure and widely adopted cryptocurrency, making it a cornerstone of any HODL portfolio.
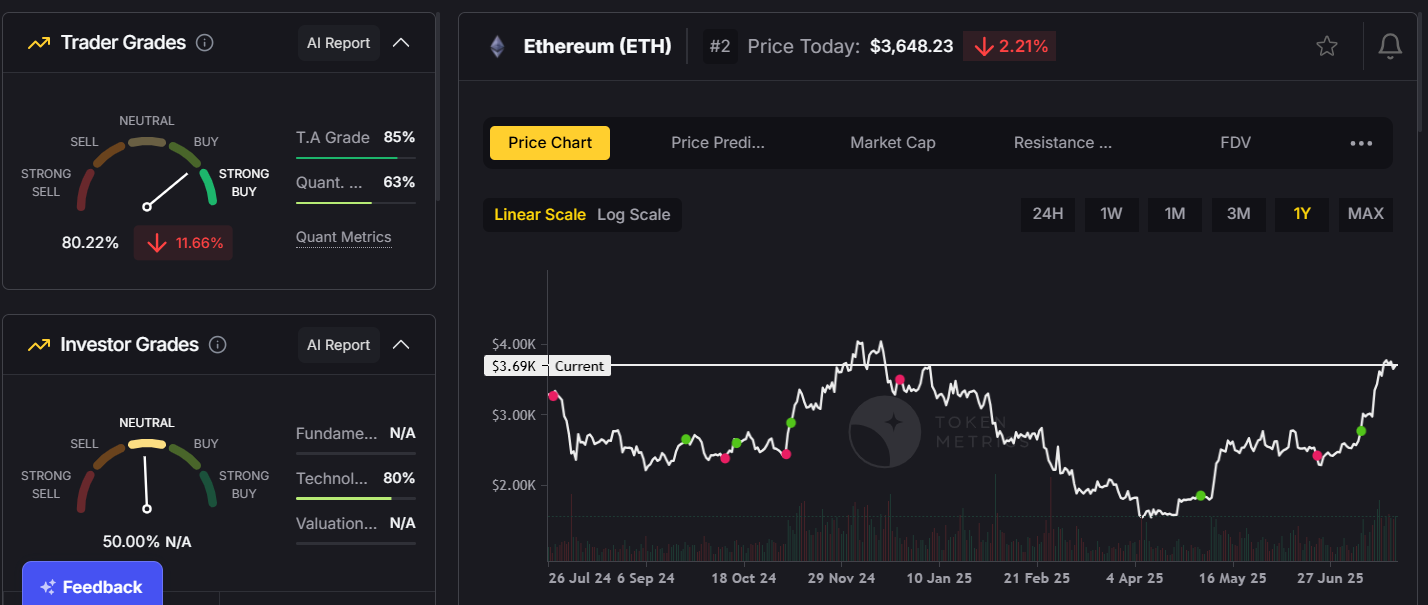


  • Ethereum (ETH):
    As the leading smart contract platform, Ethereum powers thousands of decentralized applications and remains a dominant force in DeFi and NFTs.

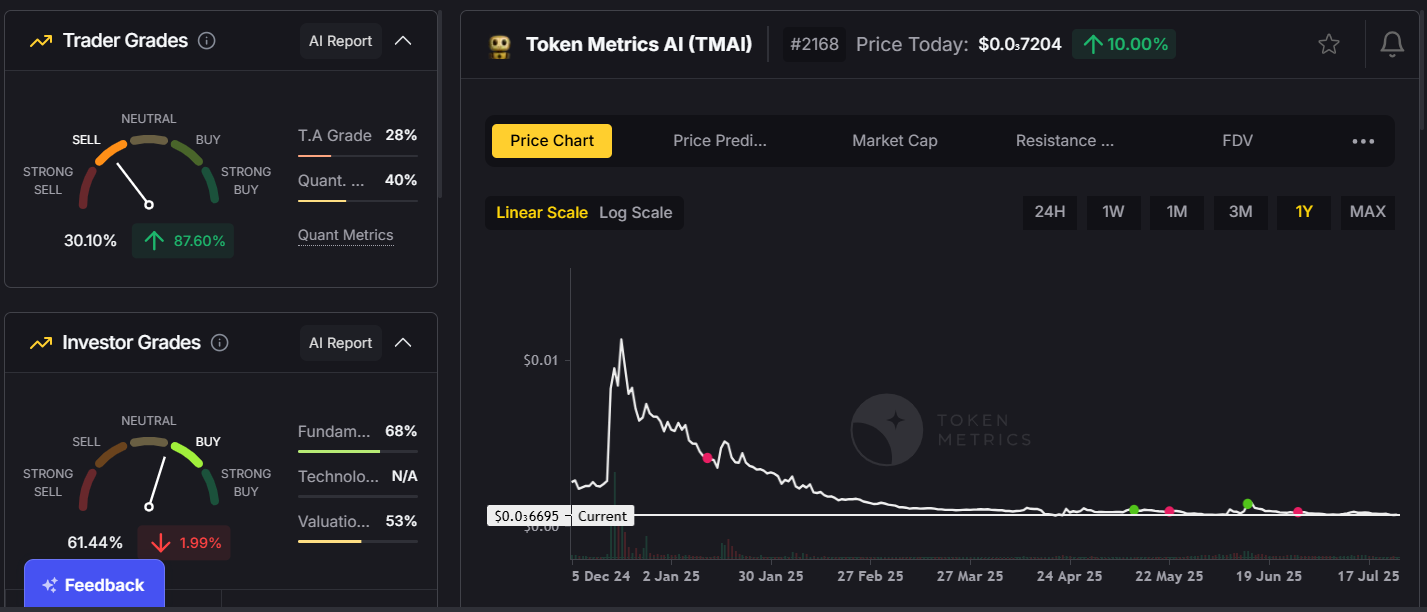
  • Token Metrics AI (TMAI):
    An innovative AI-driven analytics token that combines blockchain and artificial intelligence, helping investors make smarter decisions.
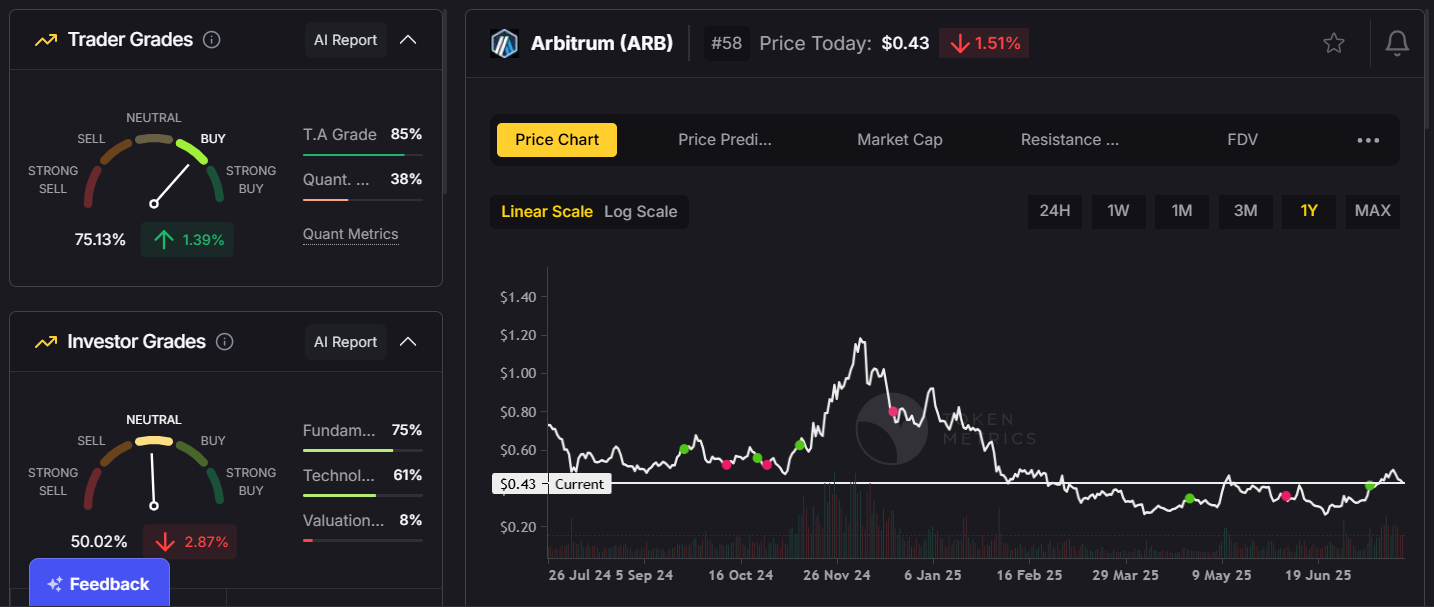

These coins offer long-term growth potential, making them excellent candidates for a HODL strategy.

How to Build a Successful HODL Strategy

  1. Do Your Research:
    Focus on coins with real-world utility, active development teams, and strong communities.

  2. Diversify Your Holdings:
    Don’t put all your funds into one asset. Balance between large-cap (BTC, ETH) and emerging tokens (AI coins, Layer 2 solutions).

  3. Use Token Metrics for Insights:
    Leverage AI-powered analytics to evaluate assets, get coin ratings, and track portfolio performance. Token Metrics provides data on over 80 key metrics per token, helping you choose the right assets to HODL.

  4. Secure Your Assets:
    Use hardware wallets for long-term storage and enable two-factor authentication (2FA) on exchange accounts.

  5. Rebalance Periodically:
    While HODLing implies holding for the long term, periodic rebalancing ensures your portfolio remains aligned with your investment goals.

HODLing vs. Active Trading

While active trading can generate quick profits, it also comes with higher risks and costs. Here’s how HODLing compares:

  • Less Stressful: You’re not glued to charts or reacting to every market dip.
  • Lower Fees: Fewer transactions mean reduced trading costs.
  • Higher Long-Term Success: Most active traders underperform long-term HODLers over extended periods.

Platforms like Token Metrics can complement both approaches by providing trading signals and long-term portfolio analytics, helping you decide when (and if) you should adjust your positions.

Risks of HODLing

While HODLing is effective, it’s not without challenges:

  • Extended Bear Markets: Prices may stay low for months or years.
  • Project Failures: Some tokens may not survive long term, making research critical.
  • Opportunity Cost: Holding may cause you to miss out on short-term trading opportunities.

To mitigate these risks, rely on data-driven tools like Token Metrics to ensure you’re holding the right mix of assets.

The Role of Token Metrics in HODLing

Token Metrics is a powerful platform for long-term crypto investors, providing:

  • AI-Driven Coin Ratings: Helping you identify which assets are worth holding.
  • Trend Analysis: Detecting when market conditions shift.
  • Portfolio Optimization: Offering insights to keep your HODL strategy on track.

By leveraging AI analytics, Token Metrics makes HODLing smarter, ensuring you’re invested in assets with strong fundamentals and growth potential.

Practical Tips for HODLers

  • Start with Blue Chips: Build a foundation with Bitcoin and Ethereum.
  • Add Growth Assets: Include promising altcoins like TMAI and Layer 2 scaling tokens.
  • Ignore Market Noise: Stay focused on the big picture.
  • Set Clear Goals: Define your time horizon and risk tolerance.
  • Stay Informed: Use platforms like Token Metrics to monitor your portfolio and adjust as needed.

Conclusion

HODLing isn’t just a meme—it’s a time-tested strategy for building wealth in crypto. By holding onto fundamentally strong assets, you can capture long-term growth while avoiding the emotional traps of active trading.

In 2025, pairing HODLing with AI-powered insights from Token Metrics gives you an edge—helping you select the right assets, manage risk, and stay committed to your investment plan. Whether you’re a beginner or a seasoned investor, HODLing remains one of the simplest and most effective ways to build wealth in the dynamic world of cryptocurrency.

Build Smarter Crypto Apps &
AI Agents in Minutes, Not Months
Real-time prices, trading signals, and on-chain insights all from one powerful API.
Grab a Free API Key
Token Metrics Team
Token Metrics Team

Recent Posts

Research

Bullish or Bearish? Interpreting AI Signals in Today’s Volatile Crypto Market

Token Metrics Team
5 min
MIN

Introduction

Crypto moves fast — and traders who can't read the signs get left behind. But in a market where emotions dominate, how do you distinguish between a real trend and a fakeout? That’s where AI-powered trading signals come in.

Token Metrics AI monitors over 6,000 tokens using 80+ data points, from technical momentum to on-chain activity and social sentiment. Its bullish and bearish signals aren’t just flashes of color — they’re actionable, data-driven insights that can guide decisions in chaotic markets.

In this post, we break down how to interpret bullish and bearish signals, what they’ve been saying recently, and how to react when market direction flips suddenly.

What Are Bullish and Bearish Signals?

Let’s start with the basics:

  • Bullish Signal (Green Dot): Indicates that a token is showing signs of an upward trend based on combined technical, sentiment, and on-chain analysis.
  • Bearish Signal (Red Dot): Suggests that a token is losing momentum, and price downside or stagnation is likely.

But these signals aren’t standalone — they come with contextual grades, like the Trader Grade, which ranks signal strength from 0 to 100. This allows you to not just know the direction, but the confidence behind it.

What Happened Recently? The May 30 Flip

On May 30, 2025, Token Metrics AI issued a broad bearish flip across much of the market. That included:

  • Ethereum
  • Bittensor
  • Launchcoin
  • Many Real World Asset and L2 tokens

The AI signal flipped red, and Trader Grades fell across the board. Why? Here's what the AI detected:

  • Slowing volume
  • Negative sentiment shift
  • Liquidity thinning on DEXs
  • On-chain accumulation stalling

This wasn’t panic-driven — it was a data-driven, proactive warning that the cycle had peaked. In a world where most traders rely on lagging indicators or Twitter sentiment, this was an edge.

How to Interpret a Bullish Signal

A bullish signal isn’t an instant “buy” — it's a call to investigate. Here's what to check when a green dot appears:

✅ 1. Trader Grade Above 80

This means high conviction. If it's between 60–79, the trend is forming, but may lack strength.

✅ 2. Volume Confirmation

Price up + volume up = good. Price up + volume flat = caution.

✅ 3. Narrative Alignment

If the token fits a hot theme (like RWAs or AI), that adds strength to the signal.

✅ 4. Recent Price Action

Did the signal appear after a breakout, or just before? Entry timing depends on whether you're catching the beginning or chasing the middle of the trend.

✅ 5. Compare to Peers

If 3–5 similar tokens are also turning bullish, that indicates sector-wide rotation — a better entry environment.

How to Interpret a Bearish Signal

Red doesn’t mean "dump immediately" — it means it's time to tighten your risk.

❗ 1. Trader Grade Below 50

This indicates deteriorating conviction — exit or reduce exposure.

❗ 2. Volume Divergence

If price is flat but volume is fading, that’s a warning of a potential breakdown.

❗ 3. Signal Timing

Did the bearish flip happen near local highs? That’s often the best exit point.

❗ 4. Check for Repeats

Was this the second red dot in a week? That could confirm a longer-term downtrend.

❗ 5. BTC/ETH Context

If Bitcoin or ETH also flip bearish, it may suggest macro pressure, not just token-specific weakness.

Real-Time Examples from the Webinar

During the June 5 Token Metrics webinar, we walked through examples of how these signals worked in real time:

🟢 Bullish (April) – Launchcoin

Strong signal, grade in the 80s. Resulted in a massive short-term run.

🔴 Bearish (May 30) – Ethereum

Signal turned red around $3,490. Traders who followed it avoided the 55% drawdown that followed.

🔴 Bearish (June) – Fartcoin

After a 700% run-up, the signal flipped bearish with a low Trader Grade of ~24. Result? A slow bleed lower as sentiment cooled.

What Makes AI Signals Different from Traditional TA?

Feature                                                    Token Metrics AI                     Traditional TA

Combines social + on-chain                    ✅                                       ❌

Updated in real time                                 ✅                                       ❌

Machine learning trained on past data   ✅                                       ❌

Outputs confidence grade                       ✅                                       ❌

Adapts to new narratives                         ✅                                       ❌

This isn’t about moving averages or MACD — it’s about combining the entire digital footprint of a token to anticipate what comes next.

How to React to a Signal Flip

What do you do when your favorite token suddenly flips from bullish to bearish?

  1. Reduce exposure immediately — even if you don’t sell everything, cut risk.
  2. Check the Grade — if it’s falling, momentum is likely over.
  3. Watch Peer Tokens — if similar projects are also turning red, it confirms sector rotation.
  4. Set New Alerts — if the signal flips back to green, be ready to re-enter.

Your job isn’t to predict the market. It’s to respond to what the data is saying.

How to Combine AI Signals with a Strategy

Here’s a basic framework:

Entry

  • Bullish signal + Trader Grade > 80 = enter with full size.
  • Grade 60–79 = enter small or wait for confirmation.

Exit

  • Bearish signal = scale out or exit.
  • Grade < 50 = no new positions unless for short trades.

Risk

  • Position size scales with grade.
  • Only trade tokens with high liquidity and volume confirmation.

This keeps your system simple, repeatable, and data-driven.

Conclusion

In volatile markets, conviction matters. Token Metrics AI doesn’t just point up or down — it tells you how strong the trend is, how likely it is to last, and when it’s time to pivot.

Don’t trade on emotions. Don’t chase hype. Use the signals — and trust the grade.

Because in a market that never sleeps, it pays to have an AI watching your back.

Research

Crypto Market Cools Off: What Is Token Metrics AI Saying Now

Token Metrics Team
5 min
MIN

Introduction

The euphoria of April and May in the crypto market has officially hit the brakes. While traders were riding high just weeks ago, the mood has shifted — and the data confirms it. Token Metrics’ proprietary AI signals flipped bearish on May 30, and since then, the market has been slowly but steadily declining.

In this post, we break down what’s happened since the bearish signal, how major altcoins and sectors are reacting, and what Token Metrics’ indicators are telling us about what might come next.

The Big Picture: Cooling Off After a Hot Q1 and Q2 Start

The platform’s AI signal turned bearish on May 30 when the total crypto market cap hit $3.34 trillion. Since then, the momentum that defined early 2025 has reversed.

This wasn’t a sudden crash — it’s a slow bleed. The signal shift didn’t come from headline-driven panic, but from data-level exhaustion: volume softening, sentiment stalling, and trend strength fading across most tokens.

Token Metrics AI recognized the shift — and issued the warning.

What the Bearish Signal Means

The AI model analyzes over 80 metrics across price, volume, sentiment, and on-chain data. When key trends across these data sets weaken, the system flips from bullish (green) to bearish (red).

On May 30:

  • Trader Grades across most tokens declined
  • Signal sentiment flipped bearish
  • Momentum and velocity cooled down

According to the model, these were signs of a broad de-risking cycle — not just isolated weakness.

Sectors Showing Declines

Even tokens that had been performing well throughout Q2 began to stall or roll over.

🚨 Launch Coin

Previously one of the top performers in April, Launch Coin saw its grades decrease and price action softened.It may even be rebranding — a typical signal that a project is pivoting after a hype cycle.

🏦 Real World Assets (RWAs)

RWAs were hot in March–May, but by early June, volume and signal quality had cooled off significantly.

🔐 ZK and L2s

Projects like Starknet and zkSync, once dominant in trader attention, have seen signal strength drop, with many now scoring below 70.

The cooling effect is broad, touching narratives, sectors, and high-performing individual tokens alike.

The Bull-Bear Indicator in Action

One of the key tools used by Token Metrics is the Bull vs. Bear Indicator, which aggregates bullish vs. bearish signals across all tokens tracked.

As of early June:

  • The percentage of tokens with bullish signals dropped to its lowest since January.
  • New projects launching with strong grades also saw a decline.
  • Even community-favorite tokens began receiving “exit” alerts.

This isn’t fear — it’s fatigue.

How Traders Are Reacting

During the webinar, we noted that many users who rely on Token Metrics signals began rotating into stables once the May 30 signal flipped. Others reduced leverage, paused entries, or shifted into defensive plays like ETH and BTC.

This reflects an important philosophy:

"When the data changes, we change our approach."

Instead of trying to fight the tape or chase rebounds, disciplined traders are using the bearish signal to protect gains and preserve capital.

What About Ethereum and Bitcoin?

Even ETH and BTC, the two bellwether assets, aren’t immune.

  • Ethereum: Lost momentum after a strong May push. Its Trader Grade is dropping, and the AI signals currently reflect neutral-to-bearish sentiment.
  • Bitcoin: While still holding structure better than altcoins, it has also declined since peaking above $72k. Volume weakening and sentiment falling suggest caution.

In previous cycles, ETH and BTC acted as shelters during altcoin corrections. But now, even the majors show weakness — another reason why the bearish flip matters.

What Could Reverse This?

Abdullah Sarwar, head of research at Token Metrics, mentioned that for the signals to flip back bullish, we would need to see:

  • Increased momentum across top tokens
  • New narratives (e.g., real-world utility, cross-chain demand)
  • Higher volume and liquidity inflows
  • Positive macro or ETF news

Until then, the system will remain in defensive mode — prioritizing safety over chasing trades.

How to Act During a Bearish Signal

The team offered several tips for traders during this cooling-off period:

  1. Reduce exposure
    Don’t hold full positions in assets with weak grades or bearish signals.

  2. Watch signal reversals
    Keep an eye on sudden bullish flips with high Trader Grades — they often mark trend reversals.

  3. Rebalance into safer assets
    BTC, ETH, or even stables allow you to sit on the sidelines while others take unnecessary risk.

  4. Use Token Metrics filters
    Use the platform to filter for:

    • Top tokens with >80 grades
    • Signals that flipped bullish in the last 3 days
    • Low market-cap tokens with strong on-chain activity

These tools help find exceptions in a weak market.

Conclusion: Bearish Doesn’t Mean Broken

Markets cycle — and AI sees it before headlines do.

Token Metrics' bearish signal wasn’t a call to panic. It was a calibrated, data-backed alert that the trend had shifted — and that it was time to switch from offense to defense.

If you’re navigating this new phase, listen to the data. Use the tools. And most importantly, avoid trading emotionally.

The bull market might return. When it does, Token Metrics AI will flip bullish again — and you’ll be ready.

Research

Backtesting Token Metrics AI: Can AI Grades Really Predict Altcoin Breakouts?

Token Metrics Team
5 min
MIN

To test the accuracy of Token Metrics' proprietary AI signals, we conducted a detailed six-month backtest across three different tokens — Fartcoin, Bittensor ($TAO), and Ethereum. Each represents a unique narrative: memecoins, AI infrastructure, and blue-chip Layer 1s. Our goal? To evaluate how well the AI’s bullish and bearish signals timed market trends and price action.

Fartcoin:

The green and red dots on the following Fartcoin price chart represent the bullish and bearish market signals, respectively. Since Nov 26, 2024, Token Metrics AI has given 4 trading signals for Fartcoin. Let’s analyze each signal separately.

The Fartcoin chart above displays green and red dots that mark bullish and bearish signals from the Token Metrics AI, respectively. Over the last six months — starting November 26, 2024 — our system produced four significant trade signals for Fartcoin. Let’s evaluate them one by one.

The first major signal was bullish on November 26, 2024, when Fartcoin was trading at $0.29. This signal preceded a massive run-up, with the price topping out at $2.49. That’s an astounding 758% gain — all captured within just under two months. It’s one of the most powerful validations of the AI model’s ability to anticipate momentum early.

Following that rally, a bearish signal was triggered on January 26, 2025, just before the market corrected. Fartcoin retraced sharply, plunging 74.76% from the highs. Traders who acted on this bearish alert could have avoided substantial drawdowns — or even profited through short-side exposure.

On March 25, 2025, the AI turned bullish again, as Fartcoin traded near $0.53. Over the next several weeks, the token surged to $1.58, a 198% rally. Again, the AI proved its ability to detect upward momentum early.

Most recently, on June 1, 2025, Token Metrics AI flipped bearish once again. The current Trader Grade of 24.34 reinforces this view. For now, the system warns of weakness in the memecoin market — a trend that appears to be playing out in real-time.

Across all four trades, the AI captured both the explosive upside and protected traders from steep corrections — a rare feat in the volatile world of meme tokens.

Bittensor

Next, we examine Bittensor, the native asset of the decentralized AI Layer 1 network. Over the last six months, Token Metrics AI produced five key signals — and the results were a mixed bag but still largely insightful.

In December 2024, the AI turned bearish around $510, which preceded a sharp decline to $314 by February — a 38.4% drawdown. This alert helped traders sidestep a brutal correction during a high-volatility period.

On February 21, 2025, the system flipped bullish, but this trade didn't play out as expected. The price dropped 25.4% after the signal. Interestingly, the AI reversed again with a bearish signal just five days later, showing how fast sentiment and momentum can shift in emerging narratives like AI tokens.

The third signal marked a solid win: Bittensor dropped from $327 to $182.9 following the bearish call — another 44% drop captured in advance.

In April 2025, momentum returned. The AI issued a bullish alert on April 19, with TAO at $281. By the end of May, the token had rallied to over $474, resulting in a 68.6% gain — one of the best performing bullish signals in the dataset.

On June 4, the latest red dot (bearish) appeared. The model anticipates another downward move — time will tell if it materializes, but the track record suggests caution is warranted.

Ethereum

Finally, we analyze the AI’s predictive power for Ethereum, the second-largest crypto by market cap. Over the six-month window, Token Metrics AI made three major calls — and each one captured critical pivots in ETH’s price.

On November 7, 2024, a green dot (bullish) appeared when ETH was priced at $2,880. The price then surged to $4,030 in less than 40 days, marking a 40% gain. For ETH, such a move is substantial and was well-timed.

By December 24, the AI flipped bearish with ETH trading at $3,490. This signal was perhaps the most important, as it came ahead of a major downturn. ETH eventually bottomed out near $1,540 in April 2025, avoiding a 55.8% drawdown for those who acted on the signal.

In May 2025, the AI signaled another bullish trend with ETH around $1,850. Since then, the asset rallied to $2,800, creating a 51% gain.

These three trades — two bullish and one bearish — show the AI’s potential in navigating large-cap assets during both hype cycles and corrections.Backtesting Token Metrics AI across memecoins, AI narratives, and Ethereum shows consistent results: early identification of breakouts, timely exit signals, and minimized risk exposure. While no model is perfect, the six-month history reveals a tool capable of delivering real value — especially when used alongside sound risk management.

Whether you’re a trader looking to time the next big altcoin rally or an investor managing downside in turbulent markets, Token Metrics AI signals — available via the fastest crypto API — offer a powerful edge.

Backtesting Token Metrics AI across memecoins, AI narratives, and Ethereum shows consistent results: early identification of breakouts, timely exit signals, and minimized risk exposure. While no model is perfect, the six-month history reveals a tool capable of delivering real value — especially when used alongside sound risk management.

Whether you’re a trader looking to time the next big altcoin rally or an investor managing downside in turbulent markets, Token Metrics AI signals — available via the fastest crypto API — offer a powerful edge.

Choose from Platinum, Gold, and Silver packages
Reach with 25–30% open rates and 0.5–1% CTR
Craft your own custom ad—from banners to tailored copy
Perfect for Crypto Exchanges, SaaS Tools, DeFi, and AI Products