


Crypto Market Turns Bearish: Expert Analysis on Bitcoin, Ethereum, and Top Altcoin Opportunities
%201.svg)
%201.svg)

The cryptocurrency market has officially shifted into risk-off mode, marking a significant change from the bullish momentum we've witnessed over recent months. According to leading crypto analysts from Token Matrics, while the overall market indicator shows "neutral," the underlying momentum has been declining dramatically – a pattern that demands immediate attention from investors.
Bitcoin's Momentum Crash Signals Market Shift
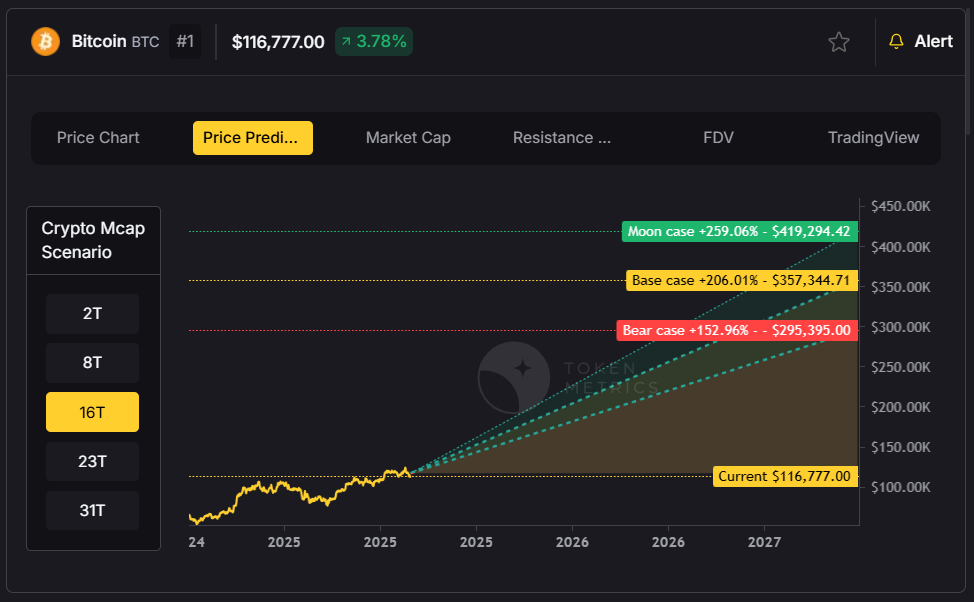
Bitcoin, currently trading around $114,000, has experienced what analysts describe as "momentum crashing." Despite reaching an all-time high of $124,000 just last week, the world's largest cryptocurrency has retreated below $115,000, triggering a clear sell signal on technical indicators.
This dramatic shift becomes even more apparent when examining the Bitcoin vs Altcoin Season indicator. From July 10th, when 90% of returns were concentrated in Bitcoin during its price discovery phase, the market briefly shifted to an even split between Bitcoin and altcoin returns. However, we're now witnessing a return to Bitcoin dominance – a classic sign of risk-off sentiment among crypto investors.
"I think this is just probably a healthy cooling-off correction. I don't think this is the end per se," explains Ian Belina, highlighting that while the current pullback appears significant, it may represent a necessary market reset rather than a trend reversal.
Ethereum Emerges as the Clear Winner
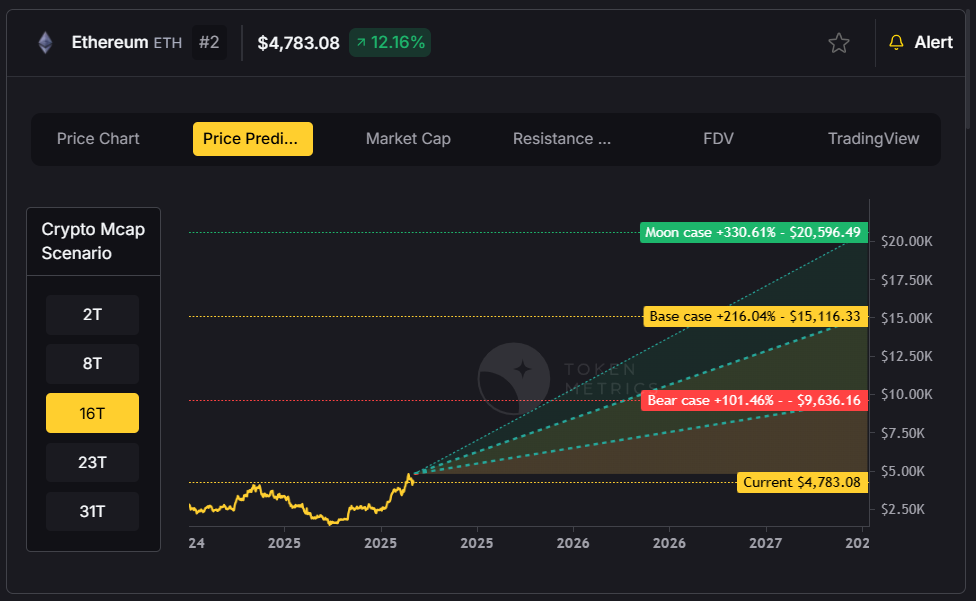
While Bitcoin struggles with declining momentum, Ethereum has emerged as the standout performer, demonstrating remarkable resilience in the current market environment. Trading around $4,300, Ethereum has surged approximately 70% since June, vastly outperforming Bitcoin's modest 9-10% gains over the same period.
The ETH/BTC ratio has climbed to 2025 highs at 0.037%, signaling a significant shift in investor preference toward Ethereum-based assets. This performance is particularly noteworthy given the regulatory clarity emerging in the United States, which has created favorable conditions for stablecoin protocols and crypto treasury adoption.
Abdullah, Head of Research & Investments at Token Matrics, remains bullish on Ethereum's prospects: "As long as ETH is above 4k, I think ETH holders shouldn't be worried. Ethereum will keep outperforming Bitcoin and Solana within the next one to three months."
Solana Faces Potential 30-40% Correction
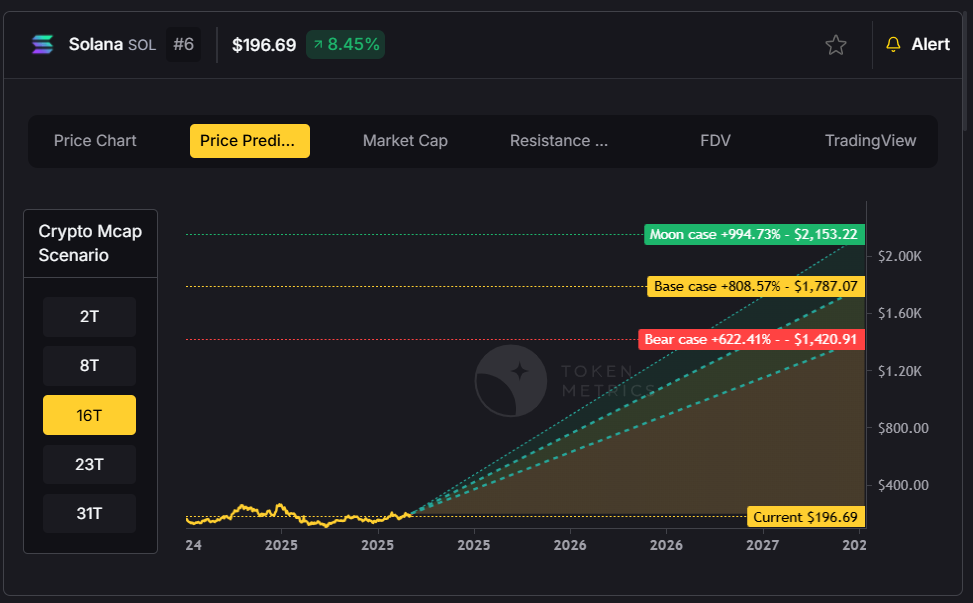
Solana presents a more concerning picture, with analysts expecting a potential capitulation event that could see the token decline 30-40% from current levels. Having broken major technical support levels, Solana's momentum indicators have turned decidedly bearish.
However, this bearish outlook comes with a silver lining for long-term investors. "I think it will be a purely buy the dip opportunity before Solana starts to run again for $500 or maybe $1,000 by the end of the cycle," notes Abdullah, suggesting that current weakness may present attractive entry points for patient investors.
Treasury Companies Drive Institutional Adoption
A major catalyst supporting the crypto market's long-term outlook is the continued accumulation by corporate treasuries. MicroStrategy recently purchased an additional 430 Bitcoin for $51 million, bringing its total holdings to approximately $7.2 billion with unrealized gains of $2.6 billion.
The trend extends beyond Bitcoin, with Ethereum treasuries gaining significant momentum. Bitcoin Immersion, led by Tom Lee, has acquired 1.52 million ETH valued at $6.6 billion, making it the second-largest public crypto treasury behind MicroStrategy and the largest for Ethereum specifically.
These institutional moves represent more than mere speculation – they signal a fundamental shift toward crypto as a legitimate treasury asset. As of now, 4% of Bitcoin's supply and 2% of Ethereum's supply is held by public companies and treasury entities.
Top Trading Opportunities in Current Market
Despite the overall bearish sentiment, several tokens continue to show strength and present compelling trading opportunities:
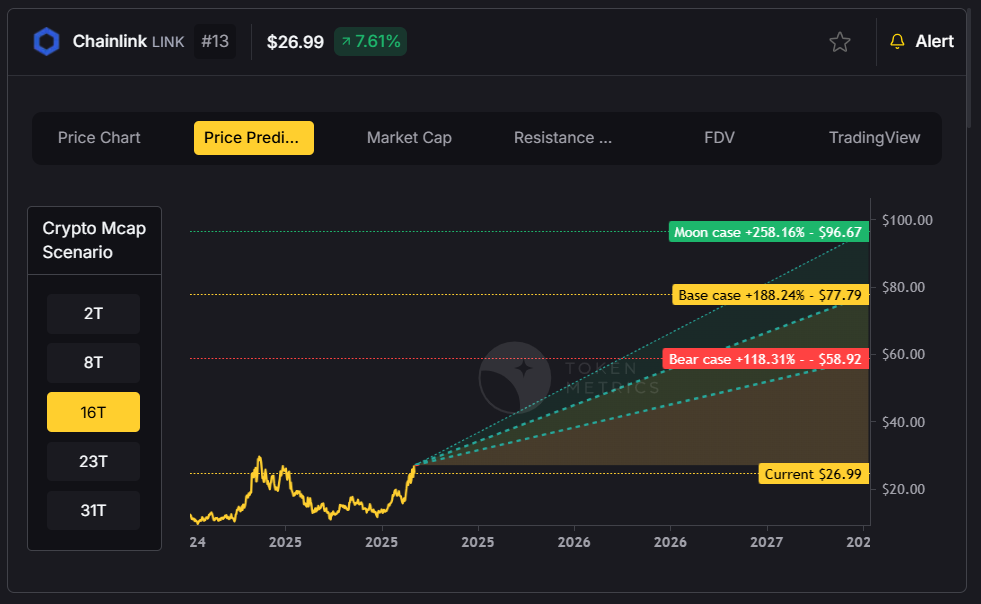
Chainlink (LINK)
Chainlink has emerged as a standout performer, recently breaking through the $22-$23 resistance level that had acted as a range high for over two years. The enterprise L1 narrative is driving adoption, as Wall Street-backed firms launching their own Layer 1 blockchains require reliable oracle services.
"I think it's only a matter of time till Chainlink sees a new all-time high," predicts Abdullah, citing the protocol's dominant market position and recent tokenomics improvements, including a buyback program tied to enterprise revenue.
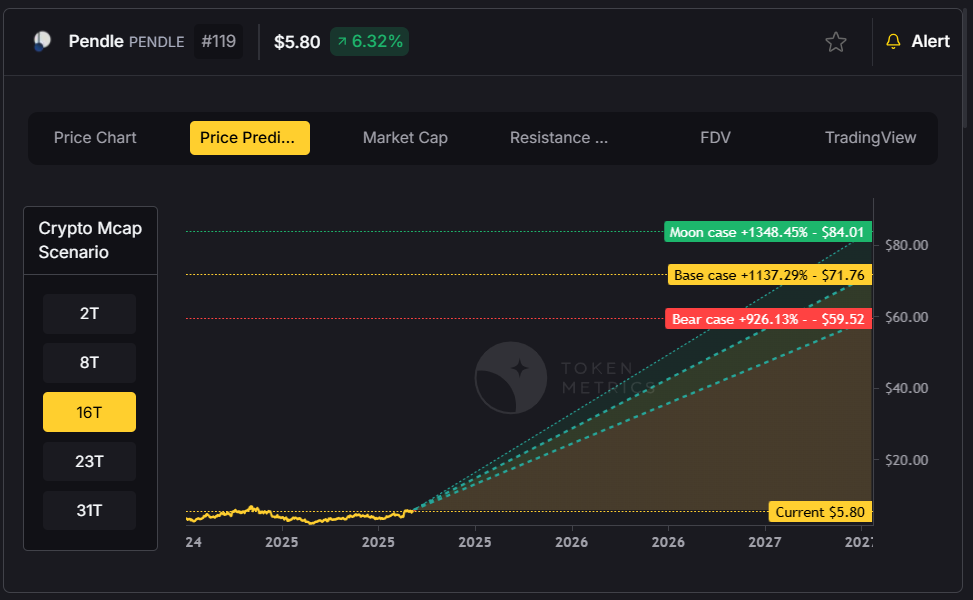
Pendle (PENDLE)
Despite being undervalued relative to its fundamentals, Pendle continues to show strength with a Total Value Locked (TVL) of approximately $10 billion against a market cap of only $1.4 billion. As the leading yield trading platform, Pendle offers institutional investors the ability to fix yields and trade funding rates with leverage.
Base Ecosystem Tokens
Tokens within the Base ecosystem, including Aerodrome and Zora, have shown resilience despite recent corrections. With Coinbase planning to expand DEX trading access beyond the current 1% of users, these protocols could see significant volume increases.
Market Outlook and Strategy
Looking ahead, analysts expect a consolidation or correction period lasting several weeks into mid-to-late September. However, Q4 remains positioned for potential bullish momentum, particularly if the Federal Reserve delivers dovish commentary at the upcoming Jackson Hole speech.
The key for investors lies in monitoring critical indicators: the market sentiment gauge, Bitcoin vs Altcoin season metrics, and individual token momentum scores. When over 60% of market returns shift to altcoins while the overall market shows strong buy signals, it typically indicates an optimal profit-taking opportunity.
For those navigating this complex environment, focusing on tokens with strong fundamentals, high trader grades (80%+), and positive momentum indicators remains the most prudent approach. While the current market presents challenges, it also offers opportunities for those who can correctly identify and time the strongest performers in each narrative cycle.
The crypto market's evolution continues, and while short-term volatility is inevitable, the underlying infrastructure and institutional adoption trends suggest a maturing asset class with significant long-term potential.
AI Agents in Minutes, Not Months

.svg)


%201.svg)

.png)


.svg)
No Credit Card Required


Online Payment


SSL Encrypted
.png)
Token Metrics Media LLC is a regular publication of information, analysis, and commentary focused especially on blockchain technology and business, cryptocurrency, blockchain-based tokens, market trends, and trading strategies.
Token Metrics Media LLC does not provide individually tailored investment advice and does not take a subscriber’s or anyone’s personal circumstances into consideration when discussing investments; nor is Token Metrics Advisers LLC registered as an investment adviser or broker-dealer in any jurisdiction.
Information contained herein is not an offer or solicitation to buy, hold, or sell any security. The Token Metrics team has advised and invested in many blockchain companies. A complete list of their advisory roles and current holdings can be viewed here: https://tokenmetrics.com/disclosures.html/
Token Metrics Media LLC relies on information from various sources believed to be reliable, including clients and third parties, but cannot guarantee the accuracy and completeness of that information. Additionally, Token Metrics Media LLC does not provide tax advice, and investors are encouraged to consult with their personal tax advisors.
All investing involves risk, including the possible loss of money you invest, and past performance does not guarantee future performance. Ratings and price predictions are provided for informational and illustrative purposes, and may not reflect actual future performance.