Research

Cryptocurrency Price Predictions and Forecasts for 2025: A Deep Dive with Token Metrics AI 📈

Explore BTC, ETH, XRP, ADA, and DOGE price predictions for 2025–2026. Learn how Token Metrics’ AI-driven tools help you forecast, trade, and reduce risk with unmatched precision.
Token Metrics Team
8 min
MIN

In mid‑2025, the crypto market is surging. Bitcoin (BTC) has blasted past $118,000, Ethereum (ETH) is over $3,000, and altcoins like XRP, ADA, and DOGE are back in focus. There’s one source powering many traders’ forecasts: Token Metrics, a leading AI‑driven crypto research and prediction platform. This extensive 1500‑word guide takes you through price forecasts, key drivers, risks, and how Token Metrics helps you stay ahead.

🌕 Why the 2025 Bull Market Is Different

Before the altcoin specifics, it’s crucial to note that many digital assets are moving in tandem with Bitcoin. Token Metrics issued a bullish signal on Bitcoin on June 28, which quickly propelled BTC past the $110,000 resistance—a breakthrough that underscores fresh institutional momentum and on‑chain supply dynamics.

🔥 Bitcoin Price Prediction: $150,000–$230,000 Range

Key Drivers

  • Institutional inflows: Billions pouring into spot Bitcoin ETFs; BlackRock, Fidelity, and others now hold substantial crypto exposure.
  • Policy support: U.S. lawmakers are openly discussing Bitcoin as a reserve asset.
  • Supply squeeze: Exchange‑wallet BTC reserves fell from 3.25 million to 2.55 million.
  • Macroeconomic tailwinds: Weakening U.S. dollar, escalating trade tensions, and rising geopolitical uncertainty.
  • On‑chain momentum: Token Metrics’ data shows continued accumulation, confirmed by the bullish signal.

Risks

  • Geopolitical shocks: Israel–Iran tensions remain volatile.
  • Climate concerns: PoW energy debate resurfaces, especially with Bitcoin’s carbon footprint.
  • Regulation risk: Varying crypto frameworks globally could dampen institutional participation.

Forecast

Token Metrics predicts $150,000–$230,000 range by 2026, averaging around $190,000, based on its AI model factoring in ETF flows, macro sentiment, and supply‑side trends.

🌐 Ethereum Price Prediction: $5,000–$10,000

Key Growth Levers

  1. Pectra upgrade: Targets scalability improvements and L2 ecosystems.
  2. ETH ETF AUM: Reached $12 billion, showing institutional appetite.
  3. DeFi ecosystem strength: TVL remains high at $72.64 billion.
  4. Layer‑2 adoption: Optimism, Arbitrum, Base, and zkSync are expanding, reducing fees and increasing usage.

Risks

  • Competition: High‑performance chains like Solana are drawing developer interest.
  • Gas spikes: Usage surges may spike transaction fees, limiting adoption.
  • Regulatory clarity: Ongoing debates over securities definitions could incite volatility.

Forecast

If Bitcoin stays strong, Token Metrics forecasts ETH testing $5,000 to $10,000 by year‑end.

  • Breakout level: Above $4,000 confirms bullish cycle.
  • Support to watch: A drop below $2,500 could signal correction.

💧 XRP Price Prediction: $5–$10

Catalysts

  • SEC settlement: XRP cleared a landmark lawsuit (paid $50M), restoring regulatory confidence.
  • RLUSD stablecoin launch: Strengthens institutional appeal and liquidity.
  • High ETF odds: 90%+ probability of XRP ETF approval by 2025.
  • Global use: Ripple’s network includes 300+ institutions (e.g., Santander); Wormhole integration adds cross‑chain utility.

Risks

  • Regulatory grayness: Other regions, like EU and UK, still establish XRP rulings.
  • Stablecoin competition: USDT, USDC, and SWIFT‑like networks remain XRP competitors.

Forecast

Bullish scenario: $5–$7 before year‑end, boosting to $10 if Bitcoin remains strong and the bullish momentum holds.

  • Key breakout: Above $3.40 signals new ATH;
  • Support level: $2.10 pivotal for pullbacks.

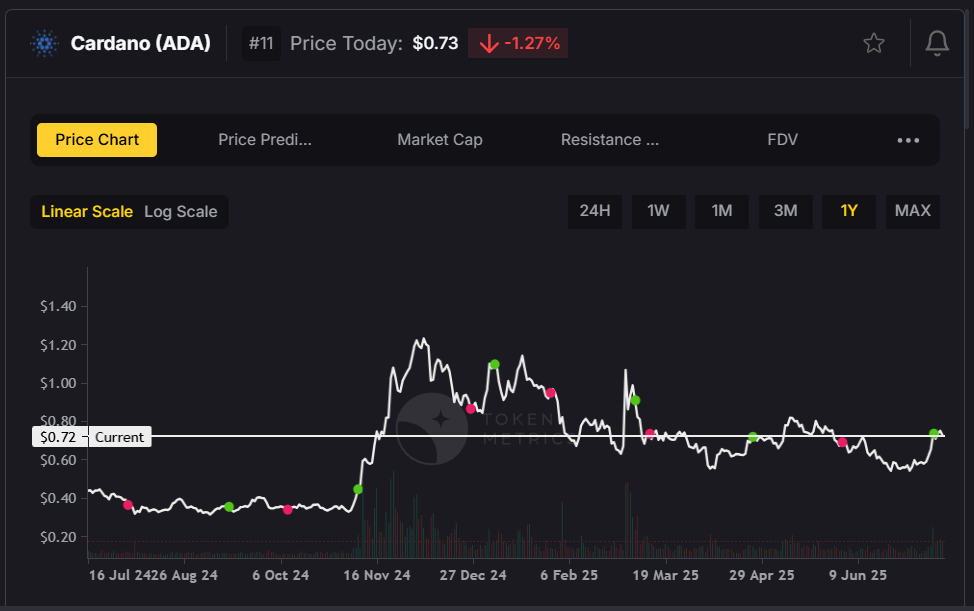
⛓️ Cardano (ADA) Price Prediction: $1.10–$1.65

Catalysts

  1. Plomin Hard Fork (Q1 2025): Boosted on‑chain governance and network evolution.
  2. DeFi TVL: Up 21% since April due to growth in Minswap, Indigo, Liqwid.
  3. Stablecoin integration: RLUSD project could pave the way for more stablecoin‑based protocols on ADA.
  4. Institutional inflows: ~$73M flowed into ADA YTD.
  5. ETF potential: Analysts give ADA a 75% chance of ETF approval.

Risks

  • Low network activity: Only ~30,000 daily users vs high user chains.
  • Steep competition: Ethereum and Solana dominate developers and liquidity.

Forecast

If ADA breaks $0.80, Token Metrics predicts $1.10–$1.65 by year‑end. Key zones:

  • Breakout: $0.80
  • Support: $0.62–$0.50

🐕 Dogecoin (DOGE) Price Prediction: $0.55–$1.25

Catalysts

  1. $0.20 resistance test: Strong on‑chain technical pattern, including golden cross.
  2. Merchant adoption: DOGE accepted by Tesla (Musk’s online store), SpaceX merch, and others via the America Party.
  3. Elon Musk tweets: His social momentum drives new cycles.
  4. ETF speculation: Analysts foresee a 65%+ chance of a DOGE ETF in 2025.
  5. Whale builds: Major accumulation since March, exchange reserves declining.

Risks

  • Infinite supply: Annual inflation compresses long‑term value.
  • Meme volatility: Highly sentiment‑driven and prone to sharp crashes, especially if Bitcoin corrects.

Forecast

  • Conservative: $0.55
  • Moderate: $1.07
  • Bullish if ETF buzz peaks: $1.25, especially if Bitcoin holds $150K.
  • Critical support: $0.15
  • Sell‑off trigger: Failure at $0.20.

🧠 The Token Metrics AI Advantage

With predictions like this, it’s essential to choose a research tool that delivers accuracy, objectivity, and automation. Token Metrics ticks every box:

1. Signal-Driven Forecasts

  • AI detected BTC signal on June 28 instead of endlessly lagging on charts.
  • Real-time ETH, XRP, ADA, DOGE buy/sell signals help traders time entries precisely.

2. Accuracy-Ranked Grades

  • Each token is assigned a Trader Grade (short‑term outlook) and an Investor Grade (long‑term fundamentals), using 80+ metrics.
  • Daily updates keep grades current and aligned with market shifts.

3. AI-Powered Price Predictions

  • Models incorporate on‑chain indicators, macro factors, whale activity, and ETF flows to generate multi‑year forecasts grounded in data.
  • Multi-currency, multi-metric predictive modeling is unlikely replicated in any other platform.

4. Moonshots & Altcoin Discoveries

  • Token Metrics highlights low‑cap picks ready to capture momentum during bull runs.
  • Includes live ROI tracking and swap integration for execution directly from the platform.

5. Data Visualization & Alerts

  • Custom dashboards show price, grade, TVL, exchange flow, whale builds, and social volume.
  • Alerts via Telegram, Slack, Discord, or email ensure you never miss critical moves or signals.

6. API & MCP Server

  • Developers can use Token Metrics’ Multi‑Client Protocol to integrate into OpenAI Agents, IDEs, slide tools, and backtesting bots—all with consistent data across platforms.

🔒 Strategy Guide for Institutional & Retail Investors

▶️ Entry Criteria

  • Watch Token Metrics signals: If crypto1 go bullish, adjacently pump patterns follow.

  • Confirm breakouts at critical resistance levels:

    • BTC: >$118K
    • ETH: >$4K
    • XRP: >$3.40
    • ADA: >$0.80
    • DOGE: >$0.20

📌 Holding Strategy

  • Use Trader Grades to decide short-term holding periods.
  • Switch to Investor Grades for swing or long-term positions.
  • Track DeFi TVL, staking, and bullish fundamentals.

📉 Risk Management

  • Set alerts for bearish signals or grade downgrades.
  • Use stop‑losses near key support:

    • BTC: $90K
    • ETH: $2.5K
    • XRP: $2.10
    • ADA: $0.62
    • DOGE: $0.15

📈 Scaling Approach

  • If forecasts hit 50% of target, take partial profits.
  • Let the rest ride on break‑out confirmation signals.

🔁 Summary Table: 2025 Price Predictions

✅ The Takeaway: Trade Smarter with AI, Not Emotion

We're witnessing one of the most powerful crypto bull cycles since 2021. Institutional capital, macro turbulence, and smart contract expansion are fueling gains across the board.

But this isn't about blind optimism—it's about precision entry, objective signals, and dynamic portfolio management.

That’s why Token Metrics stands out. Its AI forecasting platform offers tools that help investors:

  • Navigate evolving market cycles
  • Forecast realistic price targets
  • Catch altcoin breakouts
  • Mitigate risk with data‑driven signals
  • Stay long-term aligned through governance, DeFi, and macro roots

Get Started with Token Metrics Today

Whether you're trading Bitcoin, Ethereum, or altcoins, Token Metrics equips you with tools to stay ahead. From real‑time signals, AI-predicted price targets, and custom alerts, to developer‑grade APIs, Token Metrics delivers a comprehensive crypto edge.

👉 Sign up now and level‑up your crypto portfolio strategy: tokenmetrics.com

Build Smarter Crypto Apps &
AI Agents in Minutes, Not Months
Real-time prices, trading signals, and on-chain insights all from one powerful API.
Grab a Free API Key
Token Metrics Team
Token Metrics Team

Recent Posts

Announcements

🚀 Token Metrics API Goes Live on Hacker News – The AI Crypto Toolkit for Builders

Token Metrics Team
5 min
MIN

The Token Metrics API has officially launched on Hacker News, marking a major milestone in our mission to bring AI-powered crypto insights to every developer, founder, and builder in the Web3 space.

If you're building trading bots, dashboards, investment tools, or AI agents that interact with the crypto market, this is your developer edge in 2025. Forget raw feeds and static charts—this is real-time, AI-grade crypto intelligence available in minutes via a single API key.

What Is the Token Metrics API?

The Token Metrics API is a powerful crypto intelligence engine built for developers who want more than just price data. It combines machine learning, quantitative modeling, and narrative indexing to deliver structured signals that help users make smarter trading decisions.

Instead of simply showing what the market did, the API helps predict what it might do—with insights like:

  • Trader & Investor Grades (0–100 scores on momentum and fundamentals)
  • Bullish/Bearish Signals across 6,000+ assets
  • Narrative-based Indices like DeFi, AI, Memes, RWAs, and more
  • Quantitative Risk Scores and sentiment analysis
  • Real-time updates, no lag, no stale metrics

It’s like giving your crypto bot a brain—and not just any brain, an AI-trained crypto analyst that never sleeps.

Why It’s Different from Every Other Crypto API

Most APIs give you prices, volume, and maybe some on-chain data. Token Metrics gives you opinionated intelligence derived from over 80 on-chain, off-chain, technical, and sentiment indicators.

That means:

  • Your dashboard users get real-time grades and trending tokens.
  • Your AI agent can speak fluently about token fundamentals.
  • Your bot can act on bullish flips before the rest of the market.

We’ve designed this API for modularity and plug-and-play usability. With 21+ endpoints and official SDKs, you can ship faster and smarter—no custom pipeline needed.

What Can You Build?

Whether you're a solo developer or building inside a Web3 team, the possibilities are wide open.

Build smarter with Token Metrics if you’re creating:

  • 🧠 AI trading agents that query real-time token grades
  • 📊 Investor dashboards that surface top-rated altcoins
  • 📈 DApps that alert users to sector momentum shifts
  • 📱 Mobile apps with embedded market signals
  • 🧪 Backtesting systems for narrative-based portfolio strategies

Because the API supports OpenAI, Claude, Cursor, and Raycast integrations, your agents and LLM-powered tools can query live crypto intelligence in natural language—no additional parsing required.

Why the Hacker News Feature Matters

Token Metrics API just made it to the front page of Hacker News, one of the internet’s most trusted platforms for discovering high-impact developer tools.

This means:

  • 💬 A community of builders and engineers is already testing the API
  • 🧪 Feedback is pouring in, helping us evolve faster
  • 🚀 Your early adoption puts you ahead of the curve

If you’ve been waiting for the right time to integrate AI-native crypto signals into your product—this is it.

Get Started for Free

We’re offering 5,000 free API calls/month for every new developer.

Sign up, plug in your key, and build:

  • With one consistent schema
  • Across multiple clients
  • Without chasing multiple API docs

Your users don’t just want raw data anymore—they want insights. Token Metrics delivers those insights in real time, with zero guesswork.

Join the Developer Revolution

💥 Explore the API – Get your key in 30 seconds
💬 Join the Hacker News discussion – See what other devs are saying
📚 Browse Docs – View full endpoints and SDKs

One API. One schema. Smarter crypto apps.
The future of crypto building is AI-powered—and it starts here.

Research

Bullish or Bearish? Interpreting AI Signals in Today’s Volatile Crypto Market

Token Metrics Team
5 min
MIN

Introduction

Crypto moves fast — and traders who can't read the signs get left behind. But in a market where emotions dominate, how do you distinguish between a real trend and a fakeout? That’s where AI-powered trading signals come in.

Token Metrics AI monitors over 6,000 tokens using 80+ data points, from technical momentum to on-chain activity and social sentiment. Its bullish and bearish signals aren’t just flashes of color — they’re actionable, data-driven insights that can guide decisions in chaotic markets.

In this post, we break down how to interpret bullish and bearish signals, what they’ve been saying recently, and how to react when market direction flips suddenly.

What Are Bullish and Bearish Signals?

Let’s start with the basics:

  • Bullish Signal (Green Dot): Indicates that a token is showing signs of an upward trend based on combined technical, sentiment, and on-chain analysis.
  • Bearish Signal (Red Dot): Suggests that a token is losing momentum, and price downside or stagnation is likely.

But these signals aren’t standalone — they come with contextual grades, like the Trader Grade, which ranks signal strength from 0 to 100. This allows you to not just know the direction, but the confidence behind it.

What Happened Recently? The May 30 Flip

On May 30, 2025, Token Metrics AI issued a broad bearish flip across much of the market. That included:

  • Ethereum
  • Bittensor
  • Launchcoin
  • Many Real World Asset and L2 tokens

The AI signal flipped red, and Trader Grades fell across the board. Why? Here's what the AI detected:

  • Slowing volume
  • Negative sentiment shift
  • Liquidity thinning on DEXs
  • On-chain accumulation stalling

This wasn’t panic-driven — it was a data-driven, proactive warning that the cycle had peaked. In a world where most traders rely on lagging indicators or Twitter sentiment, this was an edge.

How to Interpret a Bullish Signal

A bullish signal isn’t an instant “buy” — it's a call to investigate. Here's what to check when a green dot appears:

✅ 1. Trader Grade Above 80

This means high conviction. If it's between 60–79, the trend is forming, but may lack strength.

✅ 2. Volume Confirmation

Price up + volume up = good. Price up + volume flat = caution.

✅ 3. Narrative Alignment

If the token fits a hot theme (like RWAs or AI), that adds strength to the signal.

✅ 4. Recent Price Action

Did the signal appear after a breakout, or just before? Entry timing depends on whether you're catching the beginning or chasing the middle of the trend.

✅ 5. Compare to Peers

If 3–5 similar tokens are also turning bullish, that indicates sector-wide rotation — a better entry environment.

How to Interpret a Bearish Signal

Red doesn’t mean "dump immediately" — it means it's time to tighten your risk.

❗ 1. Trader Grade Below 50

This indicates deteriorating conviction — exit or reduce exposure.

❗ 2. Volume Divergence

If price is flat but volume is fading, that’s a warning of a potential breakdown.

❗ 3. Signal Timing

Did the bearish flip happen near local highs? That’s often the best exit point.

❗ 4. Check for Repeats

Was this the second red dot in a week? That could confirm a longer-term downtrend.

❗ 5. BTC/ETH Context

If Bitcoin or ETH also flip bearish, it may suggest macro pressure, not just token-specific weakness.

Real-Time Examples from the Webinar

During the June 5 Token Metrics webinar, we walked through examples of how these signals worked in real time:

🟢 Bullish (April) – Launchcoin

Strong signal, grade in the 80s. Resulted in a massive short-term run.

🔴 Bearish (May 30) – Ethereum

Signal turned red around $3,490. Traders who followed it avoided the 55% drawdown that followed.

🔴 Bearish (June) – Fartcoin

After a 700% run-up, the signal flipped bearish with a low Trader Grade of ~24. Result? A slow bleed lower as sentiment cooled.

What Makes AI Signals Different from Traditional TA?

Feature                                                    Token Metrics AI                     Traditional TA

Combines social + on-chain                    ✅                                       ❌

Updated in real time                                 ✅                                       ❌

Machine learning trained on past data   ✅                                       ❌

Outputs confidence grade                       ✅                                       ❌

Adapts to new narratives                         ✅                                       ❌

This isn’t about moving averages or MACD — it’s about combining the entire digital footprint of a token to anticipate what comes next.

How to React to a Signal Flip

What do you do when your favorite token suddenly flips from bullish to bearish?

  1. Reduce exposure immediately — even if you don’t sell everything, cut risk.
  2. Check the Grade — if it’s falling, momentum is likely over.
  3. Watch Peer Tokens — if similar projects are also turning red, it confirms sector rotation.
  4. Set New Alerts — if the signal flips back to green, be ready to re-enter.

Your job isn’t to predict the market. It’s to respond to what the data is saying.

How to Combine AI Signals with a Strategy

Here’s a basic framework:

Entry

  • Bullish signal + Trader Grade > 80 = enter with full size.
  • Grade 60–79 = enter small or wait for confirmation.

Exit

  • Bearish signal = scale out or exit.
  • Grade < 50 = no new positions unless for short trades.

Risk

  • Position size scales with grade.
  • Only trade tokens with high liquidity and volume confirmation.

This keeps your system simple, repeatable, and data-driven.

Conclusion

In volatile markets, conviction matters. Token Metrics AI doesn’t just point up or down — it tells you how strong the trend is, how likely it is to last, and when it’s time to pivot.

Don’t trade on emotions. Don’t chase hype. Use the signals — and trust the grade.

Because in a market that never sleeps, it pays to have an AI watching your back.

Research

Crypto Market Cools Off: What Is Token Metrics AI Saying Now

Token Metrics Team
5 min
MIN

Introduction

The euphoria of April and May in the crypto market has officially hit the brakes. While traders were riding high just weeks ago, the mood has shifted — and the data confirms it. Token Metrics’ proprietary AI signals flipped bearish on May 30, and since then, the market has been slowly but steadily declining.

In this post, we break down what’s happened since the bearish signal, how major altcoins and sectors are reacting, and what Token Metrics’ indicators are telling us about what might come next.

The Big Picture: Cooling Off After a Hot Q1 and Q2 Start

The platform’s AI signal turned bearish on May 30 when the total crypto market cap hit $3.34 trillion. Since then, the momentum that defined early 2025 has reversed.

This wasn’t a sudden crash — it’s a slow bleed. The signal shift didn’t come from headline-driven panic, but from data-level exhaustion: volume softening, sentiment stalling, and trend strength fading across most tokens.

Token Metrics AI recognized the shift — and issued the warning.

What the Bearish Signal Means

The AI model analyzes over 80 metrics across price, volume, sentiment, and on-chain data. When key trends across these data sets weaken, the system flips from bullish (green) to bearish (red).

On May 30:

  • Trader Grades across most tokens declined
  • Signal sentiment flipped bearish
  • Momentum and velocity cooled down

According to the model, these were signs of a broad de-risking cycle — not just isolated weakness.

Sectors Showing Declines

Even tokens that had been performing well throughout Q2 began to stall or roll over.

🚨 Launch Coin

Previously one of the top performers in April, Launch Coin saw its grades decrease and price action softened.It may even be rebranding — a typical signal that a project is pivoting after a hype cycle.

🏦 Real World Assets (RWAs)

RWAs were hot in March–May, but by early June, volume and signal quality had cooled off significantly.

🔐 ZK and L2s

Projects like Starknet and zkSync, once dominant in trader attention, have seen signal strength drop, with many now scoring below 70.

The cooling effect is broad, touching narratives, sectors, and high-performing individual tokens alike.

The Bull-Bear Indicator in Action

One of the key tools used by Token Metrics is the Bull vs. Bear Indicator, which aggregates bullish vs. bearish signals across all tokens tracked.

As of early June:

  • The percentage of tokens with bullish signals dropped to its lowest since January.
  • New projects launching with strong grades also saw a decline.
  • Even community-favorite tokens began receiving “exit” alerts.

This isn’t fear — it’s fatigue.

How Traders Are Reacting

During the webinar, we noted that many users who rely on Token Metrics signals began rotating into stables once the May 30 signal flipped. Others reduced leverage, paused entries, or shifted into defensive plays like ETH and BTC.

This reflects an important philosophy:

"When the data changes, we change our approach."

Instead of trying to fight the tape or chase rebounds, disciplined traders are using the bearish signal to protect gains and preserve capital.

What About Ethereum and Bitcoin?

Even ETH and BTC, the two bellwether assets, aren’t immune.

  • Ethereum: Lost momentum after a strong May push. Its Trader Grade is dropping, and the AI signals currently reflect neutral-to-bearish sentiment.
  • Bitcoin: While still holding structure better than altcoins, it has also declined since peaking above $72k. Volume weakening and sentiment falling suggest caution.

In previous cycles, ETH and BTC acted as shelters during altcoin corrections. But now, even the majors show weakness — another reason why the bearish flip matters.

What Could Reverse This?

Abdullah Sarwar, head of research at Token Metrics, mentioned that for the signals to flip back bullish, we would need to see:

  • Increased momentum across top tokens
  • New narratives (e.g., real-world utility, cross-chain demand)
  • Higher volume and liquidity inflows
  • Positive macro or ETF news

Until then, the system will remain in defensive mode — prioritizing safety over chasing trades.

How to Act During a Bearish Signal

The team offered several tips for traders during this cooling-off period:

  1. Reduce exposure
    Don’t hold full positions in assets with weak grades or bearish signals.

  2. Watch signal reversals
    Keep an eye on sudden bullish flips with high Trader Grades — they often mark trend reversals.

  3. Rebalance into safer assets
    BTC, ETH, or even stables allow you to sit on the sidelines while others take unnecessary risk.

  4. Use Token Metrics filters
    Use the platform to filter for:

    • Top tokens with >80 grades
    • Signals that flipped bullish in the last 3 days
    • Low market-cap tokens with strong on-chain activity

These tools help find exceptions in a weak market.

Conclusion: Bearish Doesn’t Mean Broken

Markets cycle — and AI sees it before headlines do.

Token Metrics' bearish signal wasn’t a call to panic. It was a calibrated, data-backed alert that the trend had shifted — and that it was time to switch from offense to defense.

If you’re navigating this new phase, listen to the data. Use the tools. And most importantly, avoid trading emotionally.

The bull market might return. When it does, Token Metrics AI will flip bullish again — and you’ll be ready.

Choose from Platinum, Gold, and Silver packages
Reach with 25–30% open rates and 0.5–1% CTR
Craft your own custom ad—from banners to tailored copy
Perfect for Crypto Exchanges, SaaS Tools, DeFi, and AI Products