Back to blog
Crypto Basics

Day Trading Crypto: A Comprehensive Guide to Navigating Volatility for Profits

Discover key tips and strategies to enhance your day trading skills. Learn practical approaches for consistent success in the markets. Read more now!
Token Metrics Team
8 min
Want Smarter Crypto Picks—Free?
See unbiased Token Metrics Ratings for BTC, ETH, and top alts.
Thank you! Your submission has been received!
Oops! Something went wrong while submitting the form.
 No credit card | 1-click unsubscribe

Day trading crypto has surged in popularity as investors seek to capitalize on the volatile nature of digital assets. Many traders are attracted to crypto day trading due to its volatility and the potential for quick profits. The global cryptocurrency market operates 24/7 and features rapid price swings, presenting unique trading opportunities and risks for those aiming to make profits within short time frames. However, most day traders lose money, highlighting the importance of understanding the risks involved and recognizing that being a risk taker is often necessary for success in day trading crypto. Day trading requires knowledge of both securities markets and individual brokerage firm’s practices. This comprehensive guide provides a deep dive into the world of crypto day trading, covering essential strategies, tools, platforms, and risk management techniques to help both beginner day traders and experienced retail traders navigate this fast-paced financial market effectively.

What Is Day Trading Crypto?

Day trading crypto involves buying and selling cryptocurrencies within a single trading day, often multiple times, to profit from short-term price movements. A 'day trade' is defined as the act of buying and selling the same security within the same day. Unlike long term investing—where investors hold assets for extended periods—day traders focus on exploiting market inefficiencies, momentum shifts, or news events that cause rapid fluctuations in stock price or token value within minutes or hours. Day trading requires a sound and rehearsed method to provide a statistical edge on each trade.

A key characteristic of day trading is that all positions are typically closed by the end of the trading day to avoid overnight risk. In a day trade, this means opening and closing the same position in the same security on the same day. All positions in day trading are closed before the market closes for the trading day to avoid risks associated with overnight positions. However, since the cryptocurrency market never closes, “day” in crypto trading is more a conceptual timeframe based on session activity rather than fixed stock market hours. This constant market availability offers day traders continuous trading opportunities but also demands a disciplined approach to managing trades and risk. Traders need to be prepared for the risk of losing all their funds.

Why Is Crypto Ideal for Day Trading?

Cryptocurrencies are uniquely suited for day trading for several reasons:

  • High Volatility: Major cryptocurrencies like Bitcoin and Ethereum frequently experience daily price swings of 5–10%, while smaller altcoins can exhibit even more dramatic fluctuations. This volatility creates numerous trading opportunities to capitalize on quick profits.
  • 24/7 Market: Unlike traditional stock markets that operate during business days, crypto markets run nonstop, providing active traders with the ability to engage in buying and selling securities at any time.
  • Liquidity: Top cryptocurrency exchanges offer high liquidity, allowing day traders to enter and exit positions quickly without significantly impacting the stock price. Monitoring order flow in these highly liquid markets can help traders make more informed buy and sell decisions.
  • Wide Selection of Assets: Thousands of tokens exist, each with unique price movements and trading ranges, enabling traders to diversify and find the best trading opportunities.

Having more money in your trading account can provide a greater cushion to capitalize on the volatility and trading opportunities in crypto.

These factors combine to make crypto an attractive asset class for day traders seeking fast-paced trading strategies and the potential for quick profits.

Trading Accounts for Crypto Day Trading

Opening the right trading account is the first step for anyone looking to become a successful crypto day trader. A trading account with a reputable brokerage firm or cryptocurrency exchange is essential for executing your investment strategy and managing your buying and selling activities efficiently. When selecting a trading account, look for features such as low transaction fees, high liquidity, and advanced trading tools that support real-time analysis and fast order execution.

As a pattern day trader, it’s important to understand the requirements of a margin account, which can increase your buying power and allow you to take advantage of more trading opportunities. However, be aware of the pattern day trader rule, which may impose certain restrictions or minimum equity requirements on your trading activities, especially if you engage in frequent day trades. Always compare the types of cryptocurrencies offered, the security protocols in place, and the overall user experience before committing to a trading account. By choosing the right account, you can maximize your profit potential and ensure your trading aligns with your overall investment strategy.

Minimum Account Requirements

Before you start day trading crypto, it’s crucial to understand the minimum account requirements set by different brokerage firms and cryptocurrency exchanges. These requirements can include a minimum deposit to open your trading account or a minimum balance that must be maintained to keep your account active. For example, some platforms may require as little as $10 to get started, while others may have higher thresholds depending on the account type.

If you plan to use a margin account, be aware that there are often stricter minimum equity requirements compared to a standard cash account. Margin accounts can provide greater buying power, but they also come with increased risk and the possibility of a margin call if your account falls below the required minimum equity. As a day trader, it’s essential to review and understand these requirements to avoid any interruptions in your trading and to ensure you can meet the obligations of your chosen trading account. Knowing the minimum account requirements helps you plan your trading activities and manage your capital more effectively.

Best Cryptocurrencies for Day Trading

While technically any token can be day traded, some cryptocurrencies are better suited due to their liquidity, volatility, and spread. Popular choices among day traders include:

  • Bitcoin (BTC): Known for its high volume and liquidity, Bitcoin offers relatively stable price movements compared to smaller coins, making it a staple for many day traders.
  • Ethereum (ETH): Slightly more volatile than Bitcoin but with similar liquidity, Ethereum provides ample trading opportunities for momentum and breakout strategies.
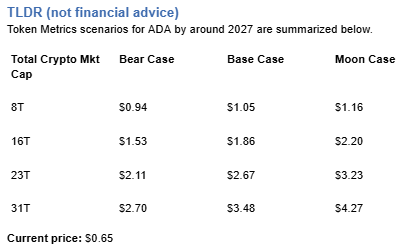
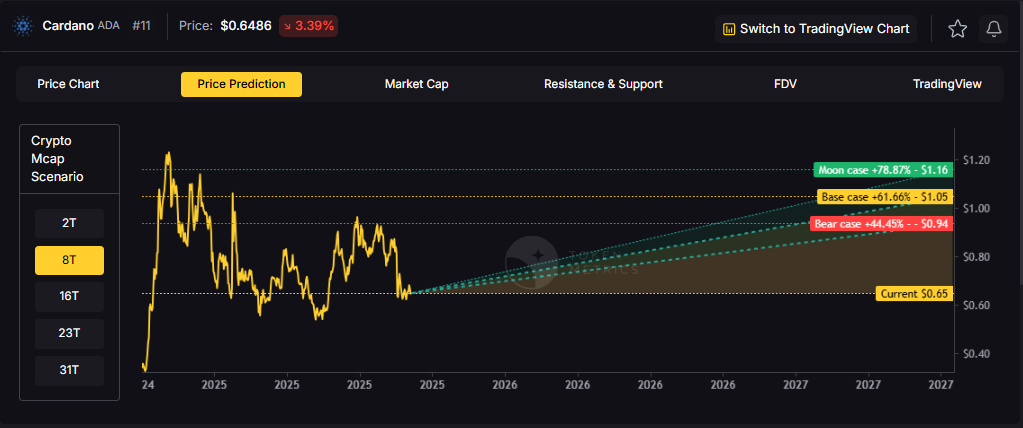
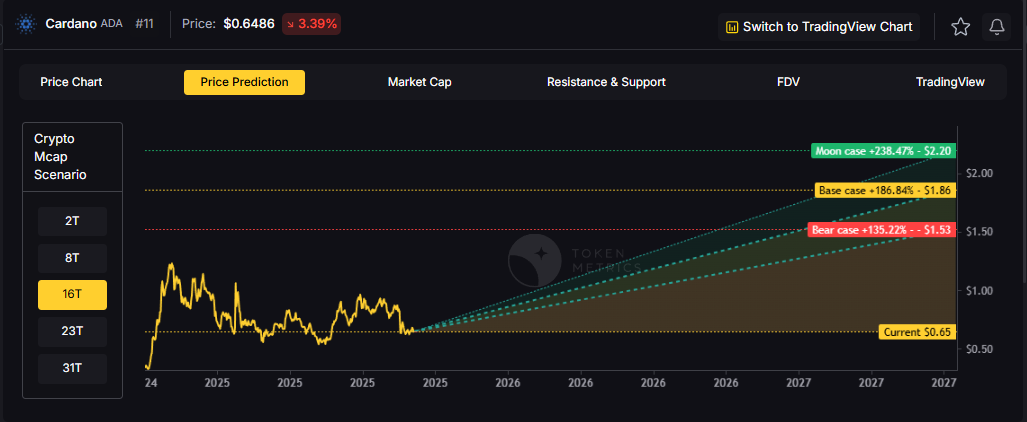
  • Solana (SOL), Cardano (ADA), Polygon (MATIC): These popular altcoins often experience frequent price swings, attracting traders looking for dynamic day trading stocks.
  • Meme Coins and Low-Cap Altcoins: These can offer huge volatility and rapid price changes but come with higher risks and lower liquidity, requiring careful risk management. When a stock hits a new high or key technical level, it can trigger trading opportunities for day traders, similar to how breakouts in meme coins and low-cap altcoins can signal potential entry points.

Choosing the right cryptocurrency depends on your trading strategy, risk tolerance, and market conditions.

Day Trading Strategies for Crypto

Successful day traders employ a variety of strategies tailored to the fast-moving crypto markets. Here are some of the most common day trading strategies. Day trading strategies should be flexible to adjust techniques that match changing market conditions.

1. Scalping

Scalping is the quickest form of day trading, involving hundreds of trades per day to capture small profits from minimal price changes. Scalping is a trading style that exploits small price gaps created by the bid-ask spread, usually involving quick trades. This approach is also known as spread trading, as it involves profiting from the bid-ask spread by taking advantage of price gaps and market inefficiencies over very short timeframes. This strategy demands high-speed execution, low trading fees, and a deep understanding of market depth and order book dynamics. Scalpers rely heavily on technical analysis and direct access to market data.

2. Momentum Trading

Momentum traders focus on identifying strong news events, pump signals, or technical breakouts to ride a trend until signs of reversal appear. Momentum trading is a strategy used by day traders that assumes financial instruments which have been rising steadily will continue to rise. Key tools include volume indicators and the Relative Strength Index (RSI). This approach requires quick decision-making to position quickly and lock in gains before momentum fades.

3. Range Trading

Range trading involves identifying horizontal support and resistance levels within a trading range and buying low while selling high. This strategy works best in sideways markets where the stock price oscillates between established levels, allowing traders to capitalize on predictable price movements.

4. Breakout Trading

Breakout traders look for key resistance or support levels and open positions when the price breaks through these levels, often accompanied by increased volume and volatility. This strategy aims to capture significant price moves following the breakout.

5. Using Technical Indicators

Day traders commonly use a combination of technical indicators to confirm trading signals and reduce false entries. Popular indicators include:

  • Moving Averages (SMA/EMA)
  • Bollinger Bands
  • MACD (Moving Average Convergence Divergence)
  • Relative Strength Index (RSI)
  • Volume Oscillators

By combining these tools, traders improve their statistical edge and increase the success rate of their trades.

Market Analysis for Crypto Day Traders

Market analysis is a cornerstone of success for any crypto day trader. To make informed trading decisions and manage the risks involved, day traders rely on both technical analysis and fundamental analysis. Technical analysis involves studying price charts, trading volumes, and historical patterns to predict future price movements. This approach helps day traders identify entry and exit points for their trades and develop a statistical edge in the market.

On the other hand, fundamental analysis focuses on the underlying factors that influence a cryptocurrency’s value, such as news events, regulatory developments, and overall market sentiment. By combining these two types of analysis, successful day traders gain a deep understanding of the market and can adapt their trading strategies to changing conditions. Utilizing market analysis tools and staying updated with the latest data allows day traders to spot trading opportunities and manage the risks involved in each trade.

Best Platforms for Day Trading Crypto

Selecting the right platform is crucial for effective day trading. Important factors include low trading fees, advanced charting tools, high liquidity, and reliable execution. Some of the top platforms for crypto day trading are:

  • Binance: Known for low fees, a wide range of assets, and advanced trading tools suitable for both beginner day traders and professionals.
  • Coinbase Advanced: Popular among U.S. traders, offering a user-friendly interface though with somewhat higher fees.
  • Kraken Pro: Offers reliable performance and API integration for experienced traders.
  • Bybit and Bitget: Favored by futures and margin traders looking to leverage their positions. These platforms offer features to increase day trading buying power, allowing traders to maximize the amount they can buy or sell within their margin accounts during active trading days.
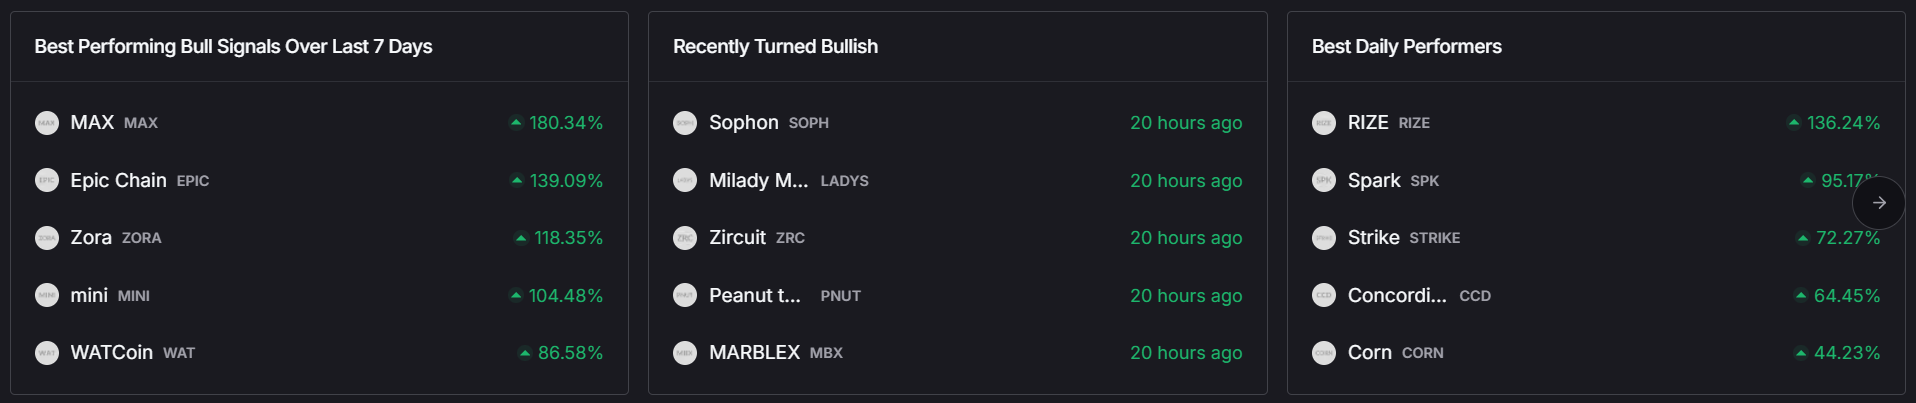
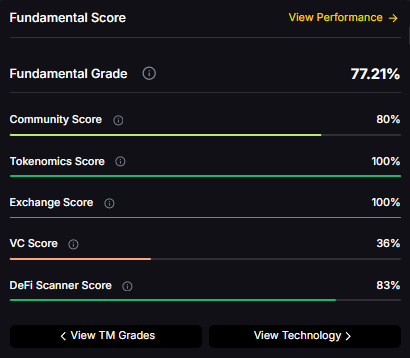
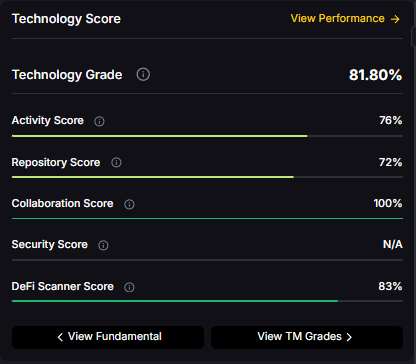
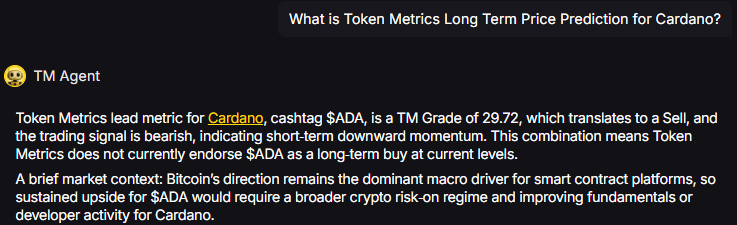
  • Token Metrics: Provides AI-driven analytics and trading signals, including Trader Grades, Investor Grades, and Bullish/Bearish Signals, to help traders time their buying and selling activities more effectively.

Choosing a platform that aligns with your trading style and risk tolerance is essential for success.

Long Term vs Short Term Trading in Crypto

When it comes to trading cryptocurrencies, understanding the difference between long-term and short-term trading is essential for developing a good strategy. Long-term trading involves holding onto a cryptocurrency for months or even years, aiming to profit from its overall growth and adoption in the market. This approach is often favored by investors with limited resources or those who prefer a more hands-off investment strategy.

Short-term trading, by contrast, focuses on buying and selling cryptocurrencies within a much shorter time frame—sometimes within the same trading day. Crypto day trading is a prime example of short-term trading, where active traders seek to capitalize on rapid price movements and volatility. As a day trader, you need to be able to monitor the markets closely and react quickly to changes in stock prices. Choosing between long-term and short-term trading depends on your risk tolerance, available time, and investment goals. Both strategies can be profitable, but it’s important to select the one that best fits your resources and trading style.

Skills Required to be a Successful Crypto Day Trader

Becoming a successful crypto day trader requires more than just a willingness to take risks—it demands a specific set of skills and a deep understanding of the market. Mastery of technical analysis is essential for identifying trading opportunities and making quick, informed decisions. Equally important is strong risk management, which helps you protect your trading account and overall profits from unexpected market swings.

A successful day trader must also possess discipline, patience, and emotional control, as the fast-paced nature of crypto trading can be both stressful and unpredictable. Critical thinking and the ability to adapt your trading strategy on the fly are vital, especially when market conditions change rapidly. As a pattern day trader, having a statistical edge and knowing when to hold overnight positions can further enhance your profit potential. Ultimately, the combination of these skills, along with a commitment to continuous learning and self-improvement, is what sets apart the most successful day traders in the crypto market.

Risk Management in Crypto Day Trading

Risk management is a cornerstone of successful day trading, especially in the highly volatile crypto markets. Protecting your trading account and overall portfolio requires disciplined approaches such as:

  • Using Stop-Loss Orders: Always set stop-loss levels to limit potential losses on any position.
  • Position Sizing: Avoid risking more than 1-2% of your account value on a single trade to preserve capital.
  • Take-Profit Targets: Establish clear profit-taking points to lock in gains before market reversals occur.
  • Cautious Use of Leverage: While margin accounts can increase buying power and potential profits, leverage also amplifies losses and can trigger margin calls if the account falls below minimum equity requirements. Traders must be aware of margin requirements to avoid forced liquidation or margin calls.
  • Short Positions: Taking a short position in crypto can be profitable if prices decline, but it also increases risk and requires strict risk management to avoid significant losses.
  • Ensuring Full Payment: Ensuring full payment for securities purchased is essential, especially when using cash accounts, to comply with regulations and manage risk.
  • Staying Informed: Monitor market data, news, and on-chain activity to anticipate trading opportunities and risks involved.

By implementing these risk management techniques, day traders can navigate the financial markets more safely and improve their chances of becoming successful day traders.

Common Mistakes to Avoid

Many beginner day traders fall into pitfalls that can lead to losing money quickly. Day traders may practice in a simulator before risking real money in the market. Avoid these common mistakes:

  1. Overtrading: Making too many trades does not guarantee profits and often results in excessive fees and poor decision-making. Overtrading also increases your total trades, which can have regulatory implications for active traders, such as triggering pattern day trader rules.
  2. Ignoring the Trend: Trading against the prevailing market trend reduces the statistical edge and success rate.
  3. FOMO Trading: Entering trades based on hype or fear of missing out without a solid day trading strategy often leads to losses.
  4. Not Using a Trading Journal: Tracking all trades helps identify what works and what doesn’t, improving future performance.
  5. Lack of Strategy: Random or impulsive trades without a clear plan increase financial risk and reduce consistency.

Avoiding these errors is crucial for building discipline and achieving long-term success in day trading activities.

Tools to Enhance Your Day Trading Game

Utilizing the right tools can significantly improve trading efficiency and decision-making:

  • TradingView: Offers advanced charting, technical analysis, and backtesting capabilities.
  • CoinMarketCap and CoinGecko: Provide real-time price data, volume, and market capitalization insights.
  • Crypto News Aggregators: Help traders stay updated on market-moving headlines and events.
  • Token Metrics Platform: An AI-powered platform delivering trading signals, trader and investor grades, and custom alerts to optimize trade timing.

These tools assist traders in analyzing market conditions, spotting trading opportunities, and managing risks more effectively.

Tax Implications

Day trading crypto generates frequent taxable events as each trade counts as buying and selling securities. Regulatory authorities often use a five business day period or business day period to determine if a trader qualifies as a pattern day trader, which can affect tax classification. Day trading can result in business classification for tax purposes, making profits fully taxable at the nominal tax rate. Traders should keep detailed records of:

  • Every trade, which is considered a capital gain or loss.
  • Holding periods, to distinguish between short-term and long-term capital gains.

Using tax software like Koinly, TokenTax, or CoinTracker can automate calculations and reporting. Since crypto tax laws can be complex, consulting a crypto-savvy tax professional is highly recommended to ensure compliance.

Final Thoughts: Is Day Trading Crypto Right for You?

Day trading crypto can be highly profitable but involves significant financial risk and requires a deep understanding of market behavior, technical analysis, and risk management. Success demands discipline, emotional control, and a well-defined trading strategy.

If you are a beginner day trader, start with small capital and consider paper trading or demo accounts to build confidence without risking real money. Day trading should not be funded with retirement savings, student loans, or funds required to meet living expenses. As your skills develop, leveraging platforms like Token Metrics can provide AI-driven insights and predictive analytics to gain a statistical edge.

For most investors, combining short-term day trading strategies with long term investing creates a balanced investment strategy that supports wealth building in the dynamic world of cryptocurrencies. Whether you aim to be a pattern day trader or prefer swing trading, understanding the risks involved and maintaining sound risk management practices are essential to achieving consistent profits in the fast-moving crypto markets.

Build Smarter Crypto Apps &
AI Agents in Minutes, Not Months
Real-time prices, trading signals, and on-chain insights all from one powerful API.
Grab a Free API Key
About Token Metrics
Token Metrics: AI-powered crypto research and ratings platform. We help investors make smarter decisions with unbiased Token Metrics Ratings, on-chain analytics, and editor-curated “Top 10” guides. Our platform distills thousands of data points into clear scores, trends, and alerts you can act on.
30 Employees
analysts, data scientists, and crypto engineers
Daily Briefings
concise market insights and “Top Picks”
Transparent & Compliant
Sponsored ≠ Ratings; research remains independent
Want Smarter Crypto Picks—Free?
See unbiased Token Metrics Ratings for BTC, ETH, and top alts.
Thank you! Your submission has been received!
Oops! Something went wrong while submitting the form.
 No credit card | 1-click unsubscribe
Token Metrics Team
Token Metrics Team

Recent Posts

Research

Chainlink Price Prediction 2027: Oracle Infrastructure Analysis

Token Metrics Team
8 min read

Understanding LINK Price Prediction: 2027 Potential

Infrastructure protocols become more valuable as the crypto ecosystem scales and relies on robust middleware. Chainlink provides critical oracle infrastructure where proven utility and deep integrations drive long-term value over retail speculation. Increasing institutional adoption raises demand for professional-grade data delivery and security.

Token Metrics price prediction projections for LINK below span multiple total market cap scenarios from conservative to aggressive. Each tier assumes different levels of infrastructure demand as crypto evolves from speculative markets to institutional-grade systems. These bands frame LINK's price prediction potential outcomes into 2027.

Disclosure

Educational purposes only, not financial advice. Crypto is volatile, do your own research and manage risk.

How to Read This LINK Price Prediction

Each band blends cycle analogues and market-cap share math with TA guardrails. Base assumes steady adoption and neutral or positive macro. Moon layers in a liquidity boom. Bear assumes muted flows and tighter liquidity.

TM Agent baseline: Token Metrics lead metric for Chainlink, cashtag $LINK, is a TM Grade of 23.31%, which translates to a Sell, and the trading signal is bearish, indicating short-term downward momentum. This means Token Metrics currently does not endorse $LINK as a long-term buy at current conditions in our price prediction models, despite strong technology fundamentals.

Live details: Chainlink Token Details

Access: Buy LINK on MEXC

Affiliate Disclosure: We may earn a commission from qualifying purchases made via this link, at no extra cost to you.

Key Takeaways: Chainlink Price Prediction Summary

  • Scenario driven: Price prediction outcomes hinge on total crypto market cap; higher liquidity and adoption lift the bands
  • Fundamentals: Fundamental Grade 74.58% (Community 81%, Tokenomics 100%, Exchange 100%, VC —, DeFi Scanner 17%)
  • Technology: Technology Grade 88.50% (Activity 81%, Repository 72%, Collaboration 100%, Security 86%, DeFi Scanner 17%)
  • TM Agent gist: Bearish signal with limited upside in price prediction models unless fundamentals or market regime change
  • Current rating: Sell (23.31%) with strong tech but weak valuation
  • Education only, not financial advice

Chainlink Price Prediction Scenario Analysis

Token Metrics price prediction scenarios span four market cap tiers, each representing different levels of crypto market maturity and liquidity:

8T Market Cap - LINK Price Prediction:

At an 8 trillion dollar total crypto market cap, LINK price prediction projects to $26.10 in bear conditions, $30.65 in the base case, and $35.20 in bullish scenarios.

 16T Market Cap - LINK Price Prediction:

Doubling the market to 16 trillion expands the price prediction range to $42.64 (bear), $56.29 (base), and $69.95 (moon).

 23T Market Cap - LINK Price Prediction:

At 23 trillion, the price prediction scenarios show $59.18, $81.94, and $104.70 respectively.

 31T Market Cap - LINK Price Prediction:

In the maximum liquidity scenario of 31 trillion, LINK price predictions could reach $75.71 (bear), $107.58 (base), or $139.44 (moon).

‍

  These price prediction ranges reflect potential infrastructure value capture as crypto markets mature, though current valuation concerns contribute to the Sell rating despite strong technology fundamentals.

Why Consider the Indices with Top-100 Exposure

Chainlink represents one opportunity among hundreds in crypto markets. Token Metrics Indices bundle LINK with top one hundred assets for systematic exposure to the strongest projects. Single tokens face idiosyncratic risks that diversified baskets mitigate.

Historical index performance demonstrates the value of systematic diversification versus concentrated positions.

Join the early access list

What Is Chainlink?

Chainlink is a decentralized oracle network that connects smart contracts to real-world data and systems. It enables secure retrieval and verification of off-chain information, supports computation, and integrates across multiple blockchains. As adoption grows, Chainlink serves as critical infrastructure for reliable data feeds and automation.

The LINK token is used to pay node operators and secure the network's services. Common use cases include DeFi price feeds, insurance, and enterprise integrations, with CCIP extending cross-chain messaging and token transfers—all factors that influence long-term LINK price predictions.

Token Metrics AI Analysis

Token Metrics AI provides comprehensive context informing our LINK price prediction models:

Vision: Chainlink aims to create a decentralized, secure, and reliable network for connecting smart contracts with real-world data and systems. Its vision is to become the standard for how blockchains interact with external environments, enabling trust-minimized automation across industries.

Problem: Smart contracts cannot natively access data outside their blockchain, limiting their functionality. Relying on centralized oracles introduces single points of failure and undermines the security and decentralization of blockchain applications. This creates a critical need for a trustless, tamper-proof way to bring real-world information onto blockchains.

Solution: Chainlink solves this by operating a decentralized network of node operators that fetch, aggregate, and deliver data from off-chain sources to smart contracts. It uses cryptographic proofs, reputation systems, and economic incentives to ensure data integrity. The network supports various data types and computation tasks, allowing developers to build complex, data-driven decentralized applications.

Market Analysis: Chainlink is a market leader in the oracle space and a key infrastructure component in the broader blockchain ecosystem, particularly within Ethereum and other smart contract platforms. It faces competition from emerging oracle networks like Band Protocol and API3, but maintains a strong first-mover advantage and widespread integration across DeFi, NFTs, and enterprise blockchain solutions. Adoption is driven by developer activity, partnerships with major blockchain projects, and demand for secure data feeds. Key risks include technological shifts, regulatory scrutiny on data providers, and execution challenges in scaling decentralized oracle networks. As smart contract usage grows, so does the potential for oracle services, positioning Chainlink at the center of a critical niche, though its success depends on maintaining security and decentralization over time—all critical factors in our price prediction analysis.

Fundamental and Technology Snapshot from Token Metrics

Fundamental Grade: 74.58% (Community 81%, Tokenomics 100%, Exchange 100%, VC —, DeFi Scanner 17%).


Technology Grade: 88.50% (Activity 81%, Repository 72%, Collaboration 100%, Security 86%, DeFi Scanner 17%).

  Catalysts That Skew LINK Price Predictions Bullish

  • Institutional and retail access expands with ETFs, listings, and integrations
  • Macro tailwinds from lower real rates and improving liquidity
  • Product or roadmap milestones such as CCIP upgrades, scaling, or partnerships
  • Increased adoption of Chainlink oracle services across DeFi protocols
  • Enterprise blockchain integrations requiring secure data feeds
  • Cross-chain expansion through CCIP (Cross-Chain Interoperability Protocol)

Risks That Skew LINK Price Predictions Bearish

  • Macro risk-off from tightening or liquidity shocks
  • Regulatory actions targeting oracle networks or infrastructure outages
  • Concentration in node operator economics and competitive displacement
  • Current low TM Grade (23.31%) indicating valuation concerns
  • Competition from alternative oracle solutions (Band Protocol, API3)
  • Token economics challenges despite 100% tokenomics score

How Token Metrics Can Help

Token Metrics empowers you to analyze Chainlink and hundreds of digital assets with AI-driven ratings, on-chain and fundamental data, and index solutions to manage portfolio risk smartly in a rapidly evolving crypto market. Our price prediction frameworks provide transparent scenario-based analysis even for tokens with Sell ratings.

Chainlink Price Prediction FAQs

Can LINK reach $100?

Yes. Based on our price prediction scenarios, LINK could reach $100+ in the 23T moon case, projecting $104.70. However, this requires significant market cap expansion and improved market conditions beyond the current Sell rating (23.31%). Not financial advice.

What price could LINK reach in the moon case?

Moon case price predictions range from $35.20 at 8T to $139.44 at 31T total crypto market cap. These scenarios assume maximum liquidity expansion and strong Chainlink adoption, though current bearish signals suggest caution. Not financial advice.

Should I buy LINK now or wait?

Timing depends on risk tolerance and macro outlook. Current price of $18.09 sits below the 8T bear case in our price prediction scenarios, suggesting potential value. However, the Sell rating (23.31%) and bearish trading signal indicate Token Metrics does not currently endorse LINK at these levels. Dollar-cost averaging may reduce timing risk if you believe in long-term infrastructure value. Not financial advice.

What is the Chainlink price prediction for 2025-2027?

Our comprehensive LINK price prediction framework suggests Chainlink could trade between $26.10 and $139.44 depending on market conditions and total crypto market capitalization. The base case price prediction scenario clusters around $30.65 to $107.58 across different market cap environments. Despite strong technology (88.50%) and fundamentals (74.58%), the current Sell rating (23.31%) reflects valuation concerns. Not financial advice.

Can Chainlink reach $50?

Yes. Based on our price prediction scenarios, LINK could reach $56.29 in the 16T base case and higher in 23T/31T scenarios. The $50 target becomes achievable in moderate market cap environments (16T tier), though current bearish momentum suggests this may take time. Not financial advice.

Why does LINK have a Sell rating despite strong technology?

LINK shows excellent technology fundamentals (88.50% grade) with strong development activity, collaboration, and security. However, the overall TM Grade of 23.31% (Sell) reflects current valuation concerns, market positioning, and bearish trading signals. Our price prediction models show potential upside in favorable market conditions, but current metrics suggest waiting for improved entry points. Not financial advice.

Is Chainlink a good investment based on price predictions?

LINK presents a complex investment case: exceptional technology grade (88.50%), solid fundamentals (74.58%), but a Sell rating (23.31%) with bearish momentum. While our price prediction models show significant upside potential in bull market scenarios, current valuation concerns and bearish signals suggest caution. The oracle infrastructure thesis remains compelling long-term, but timing and entry points matter. Consider diversified exposure through indices. Not financial advice.

How does LINK compare to other oracle price predictions?

Chainlink dominates the oracle space with first-mover advantage and widespread integration. Our price prediction framework suggests LINK could reach $30-$139 across scenarios. Competitors like Band Protocol and API3 offer alternatives, but Chainlink's established network effects and enterprise partnerships position it as the infrastructure leader. However, the current Sell rating suggests valuation concerns versus alternatives.

What are the biggest risks to LINK price predictions?

Key risks that could impact Chainlink price predictions include: current Sell rating (23.31%) indicating valuation concerns, competition from emerging oracle networks, regulatory scrutiny on data providers, node operator centralization risks, macro liquidity shocks, and challenges scaling decentralized oracle infrastructure. Despite strong technology (88.50%), these factors contribute to bearish near-term outlook.

Will LINK benefit from DeFi growth?

Chainlink is critical infrastructure for DeFi, providing price feeds for lending protocols, derivatives, and stablecoins. Our price prediction scenarios assume LINK captures value from continued DeFi adoption. However, the current Sell rating suggests this thesis isn't reflected in valuation metrics yet. Long-term infrastructure value may require patience and improved market conditions.


Should I buy LINK now or wait?

Timing depends on risk tolerance and macro outlook. Current price of $18.09 sits below the 8T bear case in the scenarios. Dollar-cost averaging may reduce timing risk. Not financial advice.

Next Steps

Track live grades and signals: Token Details

Join Indices Early Access 

Want exposure? Buy LINK on MEXC 

Disclosure

Educational purposes only, not financial advice. Crypto is volatile, do your own research and manage risk.

Why Token Metrics Ratings Matter

Discover the full potential of your crypto research and portfolio management with Token Metrics. Our ratings combine AI-driven analytics, on-chain data, and decades of investing expertise—giving you the edge to navigate fast-changing markets. Try our platform to access scenario-based price prediction targets, token grades, indices, and more for institutional and individual investors. Token Metrics is your research partner through every crypto market cycle.

Why Use Token Metrics for LINK Price Predictions?

  • Transparent analysis: Honest Sell ratings (23.31%) even when technology fundamentals are strong (88.50%)
  • Scenario-based modeling: Multiple market cap tiers for comprehensive price prediction analysis
  • Infrastructure focus: Specialized oracle network analysis and competitive landscape assessment
  • Risk-adjusted approach: Balanced view of technology strength versus valuation concerns
  • Real-time signals: Trading signals and TM Grades updated regularly
  • Diversification tools: Index solutions to spread oracle infrastructure risk
  • Comparative analysis: Analyze LINK against Band Protocol, API3, and 6,000+ tokens
Research

Hyperliquid Price Prediction 2026: DEX Perpetuals Trading Analysis

Token Metrics Team
7 min read

Why 2026 Looks Bullish for HYPE Price Prediction: Market Context

The crypto market is tilting bullish into 2026 as liquidity, infrastructure, and participation improve across the board. Clearer rules and standards are reshaping the classic four-year cycle, flows can arrive earlier, and strength can persist longer than in prior expansions.

Institutional access is widening through ETFs and custody, while L2 scaling and real-world integrations help sustain on-chain activity. This healthier backdrop frames our price prediction scenario work for HYPE. The ranges below reflect different total crypto market sizes and the share Hyperliquid could capture under each regime, providing investors with comprehensive price prediction analysis for strategic planning.


Disclosure

Educational purposes only, not financial advice. Crypto is volatile, do your own research and manage risk.

How to Read This HYPE Price Prediction

Each band blends cycle analogues and market-cap share math with TA guardrails. Base assumes steady adoption and neutral or positive macro. Moon layers in a liquidity boom. Bear assumes muted flows and tighter liquidity.

TM Agent baseline: Token Metrics TM Grade is 73.9%, a Buy, and the trading signal is bearish, indicating short-term downward momentum. This means Token Metrics judges HYPE as fundamentally attractive over the long term in our price prediction models, while near-term momentum is negative and may limit rallies.

Live details: Hyperliquid Token Details

Buy HYPE

Affiliate Disclosure: We may earn a commission from qualifying purchases made via this link, at no extra cost to you.

Key Takeaways: Hyperliquid Price Prediction Summary

  • Scenario driven: Price prediction outcomes hinge on total crypto market cap; higher liquidity and adoption lift the bands
  • Fundamentals: Fundamental Grade 76.73% (Community 68%, Tokenomics 60%, Exchange 100%, VC —, DeFi Scanner 92%)
  • Technology: Technology Grade N/A (Activity —, Repository —, Collaboration —, Security —, DeFi Scanner 92%)
  • TM Agent gist: Long-term attractive on fundamentals in price prediction models; near-term momentum is negative and may limit rallies
  • Current rating: Buy (73.9%) with bullish 2026 macro backdrop
  • Education only, not financial advice

Hyperliquid Price Prediction Scenario Analysis

Token Metrics price prediction scenarios span four market cap tiers, each representing different levels of crypto market maturity and liquidity:

8T Market Cap - HYPE Price Prediction:

At an 8 trillion dollar total crypto market cap, HYPE price prediction projects to $48.81 in bear conditions, $49.92 in the base case, and $51.03 in bullish scenarios.

16T Market Cap - HYPE Price Prediction:

Doubling the market to 16 trillion expands the price prediction range to $50.72 (bear), $54.05 (base), and $57.38 (moon).

23T Market Cap - HYPE Price Prediction:

At 23 trillion, the price prediction scenarios show $52.62, $58.17, and $63.72 respectively.

31T Market Cap - HYPE Price Prediction:

In the maximum liquidity scenario of 31 trillion, HYPE price predictions could reach $54.52 (bear), $62.29 (base), or $70.07 (moon).

Each tier in our price prediction framework assumes progressively stronger market conditions, with the base case reflecting steady growth and the moon case requiring sustained bull market dynamics driven by the improving 2026 macro environment.

Why Consider the Indices with Top-100 Exposure

Diversification matters. HYPE is compelling, yet concentrated bets can be volatile, especially when evaluating long-term price predictions. Token Metrics Indices hold HYPE alongside the top one hundred tokens for broad exposure to leaders and emerging winners.

Our backtests indicate that owning the full market with diversified indices has historically outperformed both the total market and Bitcoin in many regimes due to diversification and rotation benefits.

Get early access

What Is Hyperliquid?

Hyperliquid is a decentralized exchange focused on perpetual futures with a high-performance order book architecture. The project emphasizes low-latency trading, risk controls, and capital efficiency aimed at professional and retail derivatives traders. Its token, HYPE, is used for ecosystem incentives and governance-related utilities—all factors that directly influence HYPE price prediction trajectories.

Catalysts That Skew HYPE Price Predictions Bullish

  • Institutional and retail access expands with ETFs, listings, and integrations
  • Macro tailwinds from lower real rates and improving liquidity entering 2026
  • Product or roadmap milestones such as upgrades, scaling, or partnerships
  • Growing perpetual futures DEX market share
  • Increased professional trader adoption of decentralized derivatives
  • Integration with major DeFi protocols and liquidity aggregators
  • Favorable regulatory clarity for decentralized exchanges

Risks That Skew HYPE Price Predictions Bearish

  • Macro risk-off from tightening or liquidity shocks
  • Regulatory actions targeting decentralized derivatives platforms or infrastructure outages
  • Concentration risk in validator economics and competitive displacement
  • Competition from established centralized exchanges and other DEX perpetuals platforms
  • Technology grade unavailable (N/A), limiting technical assessment
  • Security vulnerabilities in order book or smart contract architecture

Hyperliquid Price Prediction FAQs

Can HYPE reach $60?

Yes. The 23T and 31T tiers in our price prediction models imply ranges above $60 in the Base and Moon bands, with the 23T moon case projecting $63.72 and the 31T base case projecting $62.29. These outcomes depend on liquidity and adoption improvements expected in the bullish 2026 environment. Not financial advice.

Is HYPE a good long-term investment?

HYPE shows a strong Buy rating (73.9%) with solid fundamentals (76.73%), suggesting long-term attractiveness. However, the outcome depends on adoption, liquidity regime, competition in the perpetual DEX space, and supply dynamics. The bearish near-term trading signal suggests potential volatility. Diversify and size positions responsibly. Not financial advice.

What is the Hyperliquid price prediction for 2026?

Our comprehensive HYPE price prediction framework for 2026 suggests Hyperliquid could trade between $48.81 and $70.07 depending on market conditions and total crypto market capitalization. The base case price prediction scenario clusters around $49.92 to $62.29 across different market cap environments. The Buy rating (73.9%) reflects confidence in the bullish 2026 macro backdrop. Not financial advice.

Can HYPE reach $100?

HYPE reaching $100 would exceed our current price prediction models' highest scenario of $70.07 (31T moon case). This would require extraordinary market conditions beyond the 31T total crypto market cap tier, exceptional perpetual DEX adoption, and Hyperliquid dominating the decentralized derivatives space. While the 2026 bullish thesis supports growth, $100 appears beyond our modeled scenarios. Not financial advice.

Should I buy HYPE now or wait?

HYPE has a Buy rating (73.9%) indicating long-term attractiveness in our price prediction models. However, the bearish trading signal suggests near-term downward momentum. Current price positioning and the expected bullish 2026 environment create a complex timing decision. Dollar-cost averaging may reduce timing risk while capturing upside exposure. Consider diversified DEX exposure through indices. Not financial advice.

How does HYPE compare to other DEX price predictions?

Hyperliquid focuses specifically on perpetual futures with order book architecture, differentiating it from AMM-based DEXs like Uniswap or dYdX. Our price prediction framework suggests HYPE could reach $49-$70 across scenarios in 2026. The Buy rating (73.9%) and strong fundamentals (76.73%) position HYPE competitively, though the lack of technology grade data (N/A) limits comparative technical assessment.

What makes 2026 bullish for HYPE price predictions?

Multiple factors support bullish HYPE price predictions for 2026: widening institutional access through ETFs and custody solutions, L2 scaling improvements, clearer regulatory frameworks, improving macro liquidity conditions, and the maturation of decentralized derivatives markets. These tailwinds create favorable conditions for perpetual DEX platforms like Hyperliquid to capture market share. Not financial advice.

Why is HYPE rated Buy despite bearish trading signals?

HYPE receives a Buy rating (73.9%) based on strong fundamental grade (76.73%) and favorable long-term positioning in the growing perpetual DEX space. However, the bearish trading signal reflects short-term downward momentum. This creates a classic "buy the dip" scenario where fundamentals suggest long-term value but near-term price action may provide better entry points. Our price prediction models reflect this nuance. Not financial advice.

What are the biggest risks to HYPE price predictions?

Key risks that could impact Hyperliquid price predictions include: unavailable technology grade (N/A) limiting technical assessment, competition from established centralized exchanges (Binance, OKX) and other perpetual DEXs (dYdX, GMX), regulatory targeting of decentralized derivatives, order book architecture vulnerabilities, liquidity fragmentation across perpetual platforms, and macro liquidity shocks. Despite the Buy rating, these risks warrant careful position sizing.

Can HYPE benefit from the 2026 bull market?

Yes. Our price prediction scenarios are specifically framed around the bullish 2026 thesis, where improving liquidity, institutional participation, and regulatory clarity create favorable conditions. HYPE's Buy rating (73.9%) reflects this positive macro backdrop. The base case scenarios ($49.92 to $62.29) assume steady participation in bull market dynamics, while moon cases require sustained momentum. Not financial advice.


Next Steps

Disclosure

Educational purposes only, not financial advice. Crypto is volatile, do your own research and manage risk.

Your Edge: Powered by Token Metrics

Token Metrics delivers AI-based crypto ratings, scenario-based price prediction projections, and portfolio tools so you can make smarter decisions. Discover real-time analytics on Token Metrics.

Why Use Token Metrics for HYPE Price Predictions?

  • Bullish 2026 thesis: Specialized analysis of improving macro conditions and institutional access
  • Scenario-based modeling: Four market cap tiers for comprehensive price prediction analysis
  • Buy rating transparency: Strong fundamentals (76.73%) balanced with bearish near-term signals
  • DEX specialization: Focused analysis of perpetual futures DEX competitive landscape
  • Risk management: Indices for diversified exposure beyond single DEX concentration
  • Real-time signals: Trading signals and TM Grades (Buy 73.9%) updated regularly
  • Comparative analysis: Analyze HYPE against dYdX, GMX, and 6,000+ tokens
Research

Cardano Price Prediction 2027: Layer-1 Research-Driven Analysis

Token Metrics Team
7 min read

Market Context for Cardano Price Prediction: The Case for 2027

The Layer 1 competitive landscape is consolidating as markets recognize that specialization matters more than being a generic "Ethereum killer." Cardano positions itself in this multi-chain world with specific technical and ecosystem advantages. Infrastructure maturity around custody, bridges, and developer tools makes alternative L1s more accessible heading into 2026.

The Cardano price prediction scenario projections below map different market share outcomes for ADA across varying total crypto market sizes. Base cases assume Cardano maintains current ecosystem momentum, while moon scenarios factor in accelerated adoption and bear cases reflect increased competitive pressure. Our comprehensive price prediction framework provides investors with data-driven forecasts for strategic planning.


Disclosure

Educational purposes only, not financial advice. Crypto is volatile, do your own research and manage risk.

How to Read This ADA Price Prediction

Each band blends cycle analogues and market-cap share math with TA guardrails. Base assumes steady adoption and neutral or positive macro. Moon layers in a liquidity boom. Bear assumes muted flows and tighter liquidity.

TM Agent baseline: Token Metrics lead metric for Cardano, cashtag $ADA, is a TM Grade of 29.72%, which translates to a Sell, and the trading signal is bearish, indicating short-term downward momentum. This combination means Token Metrics does not currently endorse $ADA as a long-term buy at current levels in our price prediction models. A brief market context: Bitcoin's direction remains the dominant macro driver for smart contract platforms, so sustained upside for $ADA would require a broader crypto risk-on regime and improving fundamentals or developer activity for Cardano.

Live details: Cardano Token Details

Buy ADA on Gemini

Affiliate Disclosure: We may earn a commission from qualifying purchases made via this link, at no extra cost to you.

Key Takeaways: Cardano Price Prediction Summary

  • Scenario driven: Price prediction outcomes hinge on total crypto market cap; higher liquidity and adoption lift the bands
  • Fundamentals: Fundamental Grade 77.21% (Community 80%, Tokenomics 100%, Exchange 100%, VC 36%, DeFi Scanner 83%)
  • Technology: Technology Grade 81.80% (Activity 76%, Repository 72%, Collaboration 100%, Security N/A, DeFi Scanner 83%)
  • TM Agent gist: Bearish short term in price prediction models; requires risk-on and improved fundamentals for sustained upside
  • Current rating: Sell (29.72%) despite strong fundamentals and technology scores
  • Education only, not financial advice

Cardano Price Prediction Scenario Analysis

Token Metrics price prediction scenarios span four market cap tiers, each representing different levels of crypto market maturity and liquidity:

8T Market Cap - ADA Price Prediction:

At an eight trillion dollar total crypto market cap, ADA price prediction projects to $0.94 in bear conditions, $1.05 in the base case, and $1.16 in bullish scenarios.

16T Market Cap - ADA Price Prediction:

Doubling the market to sixteen trillion expands the price prediction range to $1.53 (bear), $1.86 (base), and $2.20 (moon).

23T Market Cap - ADA Price Prediction:

At twenty-three trillion, the price prediction scenarios show $2.11, $2.67, and $3.23 respectively.

31T Market Cap - ADA Price Prediction:

In the maximum liquidity scenario of thirty one trillion, ADA price predictions could reach $2.70 (bear), $3.48 (base), or $4.27 (moon).

Each tier in our price prediction framework assumes progressively stronger market conditions, with the base case reflecting steady growth and the moon case requiring sustained bull market dynamics.

Why Consider the Indices with Top-100 Exposure

Cardano represents one opportunity among hundreds in crypto markets. Token Metrics Indices bundle ADA with top one hundred assets for systematic exposure to the strongest projects. Single tokens face idiosyncratic risks that diversified baskets mitigate.

Historical index performance demonstrates the value of systematic diversification versus concentrated positions.

Join the early access list

What Is Cardano?

Cardano is a blockchain platform designed to support secure, scalable, and sustainable decentralized applications and smart contracts. It is known for its research-driven development approach, emphasizing peer-reviewed academic research and formal verification methods to ensure reliability and security. As a proof-of-stake Layer 1 blockchain, Cardano aims to offer energy efficiency and long-term scalability, positioning itself as a competitor to platforms like Ethereum. Its native token, ADA, is used for transactions, staking, and governance. Adoption is driven by technological rigor and ecosystem growth, though progress has been criticized for being slow compared to more agile competitors—a factor that significantly influences ADA price predictions. Risks include execution delays, competition, and market volatility.

Cardano's vision is to create a decentralized platform that enables sustainable and inclusive economic systems through advanced cryptography and scientific methodology. It aims to bridge gaps between traditional financial systems and blockchain technology, promoting accessibility and security for users globally.

Token Metrics AI Analysis

Token Metrics AI provides comprehensive context on Cardano's positioning and challenges, informing our ADA price prediction models:

Vision: Cardano's vision is to create a decentralized platform that enables sustainable and inclusive economic systems through advanced cryptography and scientific methodology. It aims to bridge gaps between traditional financial systems and blockchain technology, promoting accessibility and security for users globally.

Problem: Many early blockchains face trade-offs between scalability, security, and energy efficiency. Cardano addresses the need for a more sustainable and formally verified blockchain infrastructure that can support complex applications without compromising decentralization or environmental impact. It targets inefficiencies in existing networks, particularly high energy use and lack of academic rigor in protocol design.

Solution: Cardano uses a proof-of-stake consensus algorithm called Ouroboros, which is mathematically verified for security and energy efficiency. The platform is built in layers, the settlement layer for ADA transactions and a separate computational layer for smart contracts, allowing for modular upgrades and improved scalability. It supports staking, governance, and decentralized applications, with an emphasis on formal methods to reduce vulnerabilities and ensure long-term viability.

Market Analysis: Cardano operates in the Layer 1 blockchain category, competing with Ethereum, Solana, and Avalanche. While not the market leader, it maintains a significant presence due to its academic foundation and global outreach, particularly in emerging economies. Adoption is influenced by developer activity, regulatory developments, and progress in ecosystem expansion. Its differentiator lies in its methodical, research-first approach, though this has led to slower deployment compared to peers—a critical factor in our price prediction analysis. Market risks include technological delays, competition, and shifting investor sentiment. Broader adoption depends on sustained development, real-world use cases, and interoperability advancements.

Fundamental and Technology Snapshot from Token Metrics

  • Fundamental Grade: 77.21% (Community 80%, Tokenomics 100%, Exchange 100%, VC 36%, DeFi Scanner 83%).
  • Technology Grade: 81.80% (Activity 76%, Repository 72%, Collaboration 100%, Security N/A, DeFi Scanner 83%).

Catalysts That Skew ADA Price Predictions Bullish

  • Institutional and retail access expands with ETFs, listings, and integrations
  • Macro tailwinds from lower real rates and improving liquidity
  • Product or roadmap milestones such as Hydra scaling upgrades or major partnerships
  • Accelerated smart contract deployment and DApp ecosystem growth
  • Successful real-world adoption in emerging markets (particularly Africa)
  • Improved developer onboarding and tooling reducing time-to-market
  • Strategic DeFi protocol launches on Cardano

Risks That Skew ADA Price Predictions Bearish

  • Macro risk-off from tightening or liquidity shocks
  • Regulatory actions targeting proof-of-stake networks or infrastructure outages
  • Concentration in staking pool economics and competitive displacement from faster L1s
  • Current Sell rating (29.72%) reflecting valuation and execution concerns
  • Continued slow development pace versus agile competitors (Solana, Avalanche)
  • Limited DeFi TVL and developer activity compared to Ethereum ecosystem
  • Low VC grade (36%) indicating reduced institutional backing

How Token Metrics Can Help

Token Metrics empowers you to analyze Cardano and hundreds of digital assets with AI-driven ratings, on-chain and fundamental data, and index solutions to manage portfolio risk smartly in a rapidly evolving crypto market. Our price prediction frameworks provide transparent scenario-based analysis even for tokens with Sell ratings but strong fundamentals.

Cardano Price Prediction FAQs

Can ADA reach $4?

Yes. Based on our price prediction scenarios, ADA could reach $4 in the 31T moon case, projecting $4.27. However, this requires maximum market cap expansion, significant ecosystem acceleration, and improved developer activity beyond current levels—challenging given the current Sell rating (29.72%). Not financial advice.

Can ADA 10x from current levels?

At current price of $0.65, a 10x would reach $6.50. This falls beyond all provided price prediction scenarios, which top out at $4.27 in the 31T moon case. Bear in mind that 10x returns would require substantial market cap expansion and ecosystem improvements beyond our modeled scenarios. Not financial advice.

What price could ADA reach in the moon case?

Moon case price predictions range from $1.16 at 8T to $4.27 at 31T total crypto market cap. These scenarios assume maximum liquidity expansion and strong Cardano adoption, though current Sell rating suggests significant execution improvements needed. Not financial advice.

What is the Cardano price prediction for 2027?

Our comprehensive ADA price prediction framework for 2027 suggests Cardano could trade between $0.94 and $4.27 depending on market conditions and total crypto market capitalization. The base case price prediction scenario clusters around $1.05 to $3.48 across different market cap environments. Despite strong fundamentals (77.21%) and technology (81.80%), the Sell rating (29.72%) reflects concerns about execution speed and competitive positioning. Not financial advice.

Can Cardano reach $2?

Yes. Based on our price prediction scenarios, ADA could reach $1.86 in the 16T base case and $2.20 in the 16T moon case. The $2 target becomes achievable in moderate market cap environments, though overcoming current bearish momentum and execution concerns remains critical. Not financial advice.

Should I buy ADA now or wait?

ADA has a Sell rating (29.72%) indicating Token Metrics does not currently endorse Cardano at these levels, despite strong fundamental (77.21%) and technology (81.80%) grades. Current price of $0.65 sits below even the 8T bear case ($0.94), suggesting potential value—but the Sell rating reflects concerns about execution, competitive pressure, and slow development pace. Dollar-cost averaging may reduce timing risk if you believe in Cardano's long-term research-driven thesis. Not financial advice.

Why does ADA have a Sell rating despite strong fundamentals?

ADA shows strong fundamentals (77.21%) and excellent technology (81.80%), but the overall TM Grade of 29.72% (Sell) reflects concerns about execution speed, competitive disadvantage versus faster L1s like Solana, limited DeFi ecosystem development, low VC backing (36%), and bearish trading momentum. Our price prediction models show potential upside in favorable market conditions, but current metrics suggest waiting for improved catalyst execution or better entry points. Not financial advice.

Is Cardano a good investment based on price predictions?

Cardano presents a complex investment case: strong fundamentals (77.21%), excellent technology (81.80%), but a Sell rating (29.72%) with bearish momentum. While our price prediction models show potential upside to $1.05-$4.27 depending on scenarios, current concerns about slow development, competitive pressure from Ethereum and Solana, and limited DeFi adoption suggest caution. The research-driven thesis is compelling long-term, but execution must improve. Consider diversified L1 exposure through indices. Not financial advice.

How does Cardano compare to Ethereum and Solana?

Cardano's price prediction framework suggests $0.94-$4.27 across scenarios, positioning it as a mid-tier L1. Compared to Ethereum's dominance and Solana's speed, Cardano differentiates through academic rigor and proof-of-stake sustainability. However, the Sell rating (29.72%) reflects market concerns that methodical research-first approach has resulted in slower ecosystem development. Cardano's strength in fundamentals (77.21%) and technology (81.80%) doesn't yet translate to market leadership or developer mindshare.

What are the biggest risks to Cardano price predictions?

Key risks that could impact ADA price predictions include: current Sell rating (29.72%) indicating valuation and execution concerns, slow development pace criticized versus Solana/Avalanche, limited DeFi TVL and developer activity, low VC grade (36%) showing reduced institutional backing, competitive displacement from faster L1s, regulatory targeting of proof-of-stake networks, and Bitcoin correlation dampening independent upside. Despite strong grades, execution risk dominates the near-term outlook.

Will Cardano benefit from an altcoin season?

Cardano's price prediction scenarios assume participation in broader crypto market expansion. However, the Sell rating (29.72%) and bearish momentum suggest ADA may underperform versus faster-moving L1s during altcoin rallies. Our base case scenarios ($1.05 to $3.48) reflect moderate participation in bull market dynamics, but achieving moon case targets requires Cardano demonstrating accelerated ecosystem growth and developer adoption improvements. Not financial advice.

What needs to happen for ADA to reach its price prediction targets?

For ADA to reach our price prediction targets of $1.05-$4.27, several catalysts must materialize: (1) accelerated smart contract and DApp deployment addressing slow development concerns, (2) significant DeFi TVL growth competing with Ethereum, (3) successful real-world adoption in emerging markets, (4) improved developer tooling and onboarding, (5) major partnership announcements, and (6) broader crypto market bull run providing liquidity. The Sell rating suggests these catalysts aren't currently materializing at required pace.

Next Steps

Disclosure

Educational purposes only, not financial advice. Crypto is volatile, do your own research and manage risk.

Why Use Token Metrics for Cardano Price Predictions?

  • Transparent analysis: Honest Sell ratings (29.72%) even when fundamentals (77.21%) and technology (81.80%) are strong
  • Scenario-based modeling: Four market cap tiers for comprehensive price prediction analysis
  • L1 specialization: Focused analysis of Cardano's research-driven approach versus execution speed trade-offs
  • Risk-adjusted approach: Balanced view of academic rigor strengths versus competitive disadvantages
  • Real-time signals: Trading signals and TM Grades updated regularly
  • Diversification tools: Index solutions to spread Layer-1 risk across multiple platforms
  • Comparative analysis: Analyze ADA against Ethereum, Solana, Avalanche, and 6,000+ tokens
Choose from Platinum, Gold, and Silver packages
Reach with 25–30% open rates and 0.5–1% CTR
Craft your own custom ad—from banners to tailored copy
Perfect for Crypto Exchanges, SaaS Tools, DeFi, and AI Products