Back to blog
Research

Discover the Best DeFi Yield Farming Platforms for Optimal Returns

Explore top DeFi yield farming platforms to maximize your returns. Discover strategies, risks, and tips for successful investments. Read the article now!
Token Metrics Team
8 min
Want Smarter Crypto Picks—Free?
See unbiased Token Metrics Ratings for BTC, ETH, and top alts.
Thank you! Your submission has been received!
Oops! Something went wrong while submitting the form.
 No credit card | 1-click unsubscribe

Decentralized Finance (DeFi) continues to reshape the financial landscape in 2025, offering crypto users innovative ways to earn passive income through yield farming, staking, and liquidity mining. As traditional finance struggles to provide competitive interest rates, many DeFi platforms now offer some of the highest annual percentage yields (APYs) in the crypto world. The annual percentage yield is a key metric for measuring returns in yield farming. These platforms reward liquidity providers and yield farmers for depositing assets into a liquidity pool—a smart contract that holds funds for decentralized trading and yield generation—or participating in automated market maker (AMM) protocols. Interest rates in DeFi are usually determined by supply and demand on the platform, creating a dynamic and competitive environment. A decentralized exchange is a platform that facilitates peer-to-peer trading without intermediaries, often using AMM models and liquidity pools to enable permissionless trading and increased user control. However, while high APYs can be attractive, it is important to be cautious of chasing unsustainable annual percentage yield, as these returns may carry significant risks in DeFi yield farming.

In this comprehensive guide, we will explore the best DeFi yield farming platforms in 2025, explain how the yield farming process works, and show you how to identify the safest and most profitable opportunities using Token Metrics’ AI-driven analytics.

🔍 What Is Yield Farming?

Yield farming is a key strategy within the decentralized finance ecosystem where users lend or stake their crypto assets in various DeFi protocols to earn returns. These returns often come in the form of additional tokens, trading fees, or other incentives distributed by the platform.

There are several popular forms of yield generation within the DeFi space:

  • Staking: Locking tokens to support network security or protocol governance, such as Ethereum staking, where stakers earn rewards for helping secure the network.
  • Liquidity Mining: Providing token pairs to decentralized exchanges (DEXs) or liquidity pools, thereby enabling automated market making and earning trading fees plus additional rewards.
  • Lending and Borrowing: Depositing assets into lending pools to earn interest, or borrowing assets against collateral on DeFi platforms, often facilitated by smart contracts.
  • Vault Strategies: Automated strategies that use smart contract automation to optimize and maximize returns for users with minimal effort.
  • Cross-Chain Yield Farming: A growing trend that allows operations across multiple blockchain networks, enabling users to diversify and access opportunities on different platforms.

Yield farming can offer APYs that far exceed those found in traditional financial savings accounts or fixed-income products. However, it is important to be aware of risks such as impermanent loss, smart contract vulnerabilities, market volatility, and protocol-specific risks.

🏗️ How DeFi Works: Smart Contracts and Liquidity Pools

Decentralized finance (DeFi) is powered by the seamless integration of smart contracts and liquidity pools, which together form the backbone of the DeFi ecosystem. Smart contracts are self-executing pieces of code that automatically enforce the terms of an agreement, eliminating the need for traditional intermediaries. This automation enables DeFi protocols to offer financial services such as lending, borrowing, and trading in a trustless and transparent manner. The decentralized structure of DeFi makes it less susceptible to risks linked with financial institutions, like bank collapses, further enhancing its appeal as a robust alternative to traditional finance.

Liquidity pools are another foundational element of DeFi platforms. These pools consist of funds contributed by liquidity providers, who deposit their crypto assets into smart contracts. The pooled assets are then used to facilitate trading, lending, and other financial activities across various DeFi protocols. By providing liquidity, users not only enable efficient trading and continuous liquidity on decentralized exchanges but also earn rewards in the form of trading fees or additional tokens.

The combination of smart contracts and liquidity pools allows DeFi platforms to deliver a wide range of decentralized finance services, including yield farming, automated market making, and decentralized lending. This innovative structure empowers users to participate in the global financial system without relying on centralized authorities, making DeFi a cornerstone of the modern crypto landscape.

💡 Benefits of DeFi for Investors

DeFi platforms offer a host of advantages for investors seeking to grow their crypto holdings beyond what traditional financial institutions can provide. One of the most compelling benefits is the potential for higher returns, especially through yield farming and lending protocols that enable users to earn interest and rewards on their digital assets. Additionally, investors in DeFi have control over their assets through wallets, reducing the risk of loss from third-party failures and ensuring greater financial autonomy.

Transparency is another key advantage. All transactions and smart contract operations on DeFi platforms are recorded on public blockchains, allowing investors to verify activity and track the movement of funds in real time. This level of openness reduces the risk of fraud and increases trust in the system.

Global accessibility is also a hallmark of decentralized finance. Anyone with an internet connection can access DeFi platforms, participate in yield farming, and earn governance tokens, regardless of their location or background. This democratizes access to financial services and opens up new opportunities for earning passive income.

By leveraging smart contracts and participating in governance through token ownership, investors can not only earn interest but also have a say in the future direction of their chosen DeFi protocols. This combination of high yields, transparency, and inclusivity makes DeFi an attractive alternative to traditional finance.

🧩 DeFi Yield Farming Strategies

Successful yield farmers use a variety of strategies to maximize returns from DeFi yield farming platforms. One popular approach is diversification—spreading investments across multiple DeFi protocols and liquidity pools to reduce risk and capture different yield opportunities. This helps mitigate the impact of any single protocol’s underperformance or security issues.

Liquidity provision is another core strategy, where investors deposit assets into liquidity pools on decentralized exchanges or lending platforms. In return, they earn a share of the trading fees generated and may also receive additional rewards, such as governance tokens.

Some yield farmers employ leverage, borrowing assets to increase their exposure and potential returns. While this can amplify gains, it also raises the risk of losses, especially in volatile markets.

For those seeking a more hands-off approach, automated yield optimization strategies—offered by platforms like Yearn Finance—can simplify the yield farming process. These protocols automatically move funds between various DeFi protocols to maximize yield, allowing users to benefit from complex strategies with minimal effort.

By combining these strategies—diversification, liquidity provision, leverage, and automation—yield farmers can optimize their returns while managing risk across the dynamic DeFi landscape.

🚀 Best DeFi Yield Farming Platforms in 2025

The DeFi sector has matured significantly, and many platforms now offer institutional-grade security measures, automated yield optimization, and seamless integration with other DeFi protocols. As the market matures, the industry is evolving towards more sustainable and innovative practices. These platforms often utilize different DeFi protocols to optimize user returns and simplify interactions within the DeFi ecosystem. Below are some of the top DeFi yield farming platforms in 2025, renowned for their high APYs, security, and innovative features.

1. Lido Finance (LDO)

Lido Finance is the largest liquid staking protocol and a leading DeFi project, best known for enabling users to stake Ethereum and receive stETH tokens, which represent their staked ETH and provide liquidity across other DeFi platforms. This unique model allows liquidity providers to earn staking rewards while maintaining the ability to use their assets in other protocols.

Highlights:

  • Supports staking for ETH, SOL, MATIC, DOT, and more.
  • Enables liquidity provision via stTokens, maintaining continuous liquidity.
  • Operates a decentralized validator set to enhance security.
  • Fully integrated with many DeFi platforms to maximize utility.

APY in 2025: Approximately 3.5%–4.5% on ETH staking.

Risks: Exposure to ETH price volatility and potential smart contract vulnerabilities.

2. Aave (AAVE)

Aave is a leading decentralized lending protocol that enables users to deposit crypto assets into liquidity pools to earn variable APYs, while also allowing borrowing against collateral. Known for its security and advanced features like flash loans, Aave remains a cornerstone in the DeFi ecosystem.

Highlights:

  • Supports a wide range of supported assets including stablecoins, ETH, and BTC. It is important to check which assets are compatible with Aave before engaging in lending or borrowing.
  • Features lending functionalities such as borrowing, interest earning, and liquidity provision, making it attractive for users seeking flexible financial services.
  • Offers innovative features such as flash loans, which must be borrowed and repaid within the same transaction to ensure security and instant execution, and intent-based user experiences.
  • Operates across Ethereum, Polygon, and Arbitrum for efficient trading.
  • Upcoming Aave v4 aims to enhance user experience and protocol governance.

APY in 2025: Up to 10% on stablecoins during periods of high demand.

Risks: Smart contract exploits and liquidation risks during market downturns.

3. Convex Finance (CVX)

Convex Finance specializes in boosting rewards for Curve Finance liquidity providers. As one of the most successful DeFi projects in the yield farming space, Convex has established a strong track record of delivering positive outcomes for users. By staking Curve LP tokens through Convex, yield farmers can maximize their returns with additional CVX incentives, making it a popular choice for those engaged in liquidity provision on stablecoin pools.

Highlights:

  • Earns combined rewards in CRV, CVX, and other protocol incentives.
  • Utilizes a vote-locking system that boosts long-term rewards.
  • Supports pools on Ethereum and Arbitrum.
  • Plays a significant role in Curve governance and the “Curve Wars.”

APY in 2025: Up to 25% on select Curve pools.

Risks: Complex tokenomics and potential governance concentration risk.

4. GMX (GMX)

GMX offers a unique yield farming model by allowing users to provide liquidity to its GLP pool, which earns a share of the protocol’s trading fees from decentralized perpetual trading. Built on Arbitrum and Avalanche, GMX provides a sustainable source of yield derived from real trading activity.

Highlights:

  • Yields generated from trading fees and trader losses.
  • GLP auto-compounds a diversified basket of assets including ETH, USDC, and WBTC.
  • Focus on community governance and security.
  • Supports efficient trading of decentralized derivatives.

APY in 2025: Between 10% and 20%, paid in ETH and esGMX tokens.

Risks: Market downturns can reduce yields; impermanent loss is possible.

5. Beefy Finance (BIFI)

Beefy Finance is a cross-chain yield optimizer that aggregates farming opportunities from multiple DeFi platforms. Its automated vault strategies auto-compound rewards, helping users maximize yield farming returns with minimal effort.

Highlights:

  • Supports dozens of blockchains including BNB Chain, Fantom, Avalanche, and Arbitrum.
  • Uses battle-tested smart contracts and strategic risk assessments.
  • Aggregates yield farming rewards from various DeFi protocols.
  • Provides automated yield optimization for both novice and experienced yield farmers.

APY in 2025: Ranges widely from 5% up to 80% depending on the vault and underlying assets.

Risks: Complexity of strategies and dependency on multiple underlying protocols.

6. Yearn Finance (YFI)

Yearn Finance offers institutional-grade vault strategies managed by professional strategists. It pools user capital and deploys it across various DeFi protocols to optimize yields, making it ideal for passive investors seeking automated yield farming with active governance.

Highlights:

  • Integrates with protocols like Aave, Curve, and Convex.
  • Supports a variety of assets including ETH, stablecoins, and liquidity provider tokens.
  • Emphasizes security through audits and a secure development process.
  • Features active governance with YFI tokens.

APY in 2025: Typically ranges from 4% to 30%, depending on the strategy.

Risks: Strategy performance variability and smart contract risks.

7. Pendle Finance (PENDLE)

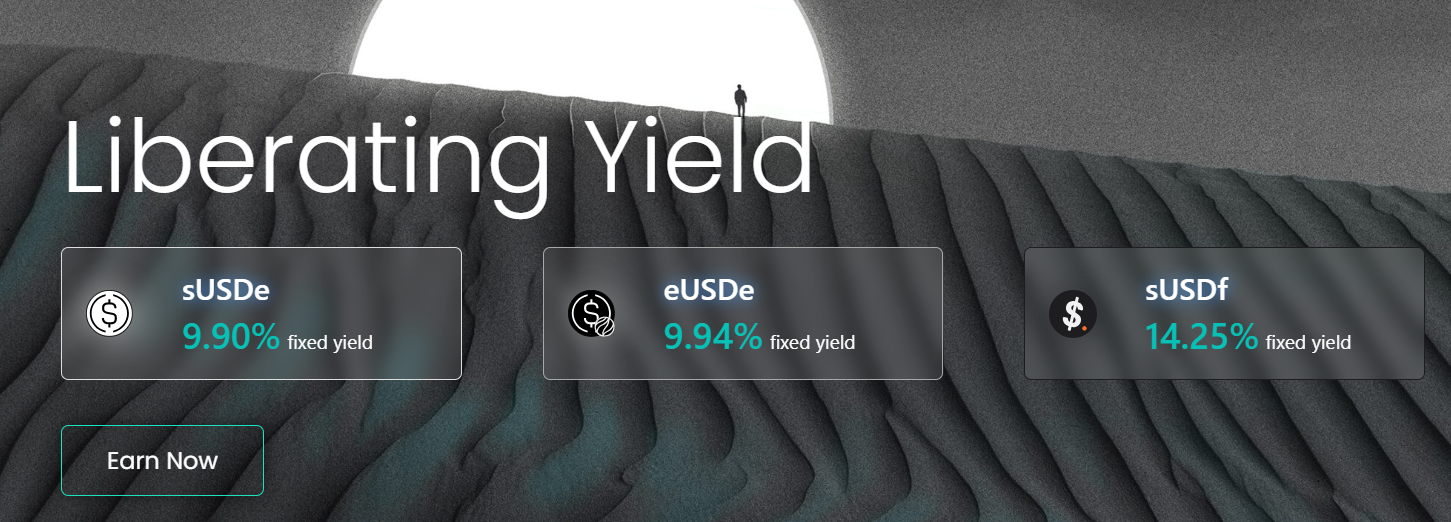
Pendle Finance introduces an innovative approach to yield farming by tokenizing future yield, allowing users to trade yield tokens on secondary markets. This enables locking in fixed APYs or speculating on interest rate movements, adding a new dimension to yield optimization.

Highlights:

  • Offers fixed yield strategies and yield token trading.
  • Supports staking of ETH, GLP, and liquid staking tokens (LSTs).
  • Uses PENDLE tokens for governance and staking.
  • Facilitates interest rate speculation and yield tokenization.

APY in 2025: Up to 15% fixed, potentially higher when trading discounted yield tokens.

Risks: Requires understanding of tokenization mechanics and market timing.

🧠 How to Use Token Metrics to Find the Best DeFi Yields

Navigating the myriad of DeFi platforms and protocols to find the highest-yielding yet safest opportunities can be daunting. Token Metrics leverages AI-powered analytics to simplify this process by providing comprehensive insights into the DeFi ecosystem. Tulip Protocol, the first yield aggregation platform built on Solana, exemplifies the innovative tools available to users seeking to optimize their returns in the DeFi space.

Key features include:

  • AI-driven Investor & Trader Grades that evaluate DeFi tokens based on risk-reward profiles.
  • Token Rankings that assess adoption, protocol health, and intrinsic value.
  • Bullish and Bearish Signals on popular yield farming tokens such as CVX, GMX, and LDO.
  • Backtesting Tools to simulate strategies involving yield-bearing tokens.
  • Narrative Tracking to identify emerging DeFi trends and promising protocols early.
  • The ability to compare transaction fees across DeFi platforms, helping users optimize net returns by factoring in cost efficiency.

When evaluating DeFi platforms, it is crucial to check the list of supported assets to ensure compatibility with your portfolio and to maximize diversification and risk management.

Whether you are participating in liquidity provision on decentralized exchanges, staking ETH through liquid staking platforms like Lido, or engaging with automated yield aggregators like Yearn Finance, Token Metrics helps analyze token health, protocol governance, and long-term sustainability.

👉 Start your free trial of Token Metrics to discover high-APY DeFi yield farming strategies before they become mainstream.

🛠️ DeFi Platform Selection Criteria

Choosing the right DeFi platform is crucial for maximizing returns and minimizing risk. Security should be the top priority; look for DeFi platforms with a proven track record, regular security audits, and transparent smart contract development processes. Platforms that have demonstrated resilience against hacks and have robust security measures in place are generally more trustworthy.

Usability is another important factor. A user-friendly interface and clear documentation can make it easier to navigate the platform and manage your investments effectively. Consider how intuitive the platform is for both beginners and experienced users.

Fees can significantly impact your net returns, so compare transaction costs, withdrawal fees, and any other charges across different DeFi platforms. Opt for platforms with competitive and transparent fee structures.

Other key factors include the platform’s governance model—such as the role of governance tokens and community participation—the quality of customer support, and compliance with evolving regulatory requirements. By carefully evaluating these criteria, investors can select DeFi platforms that align with their goals and risk tolerance.

🌐 DeFi Trends to Watch in 2025

The DeFi sector is rapidly evolving, and several key trends are set to shape the landscape in 2025. One major development is the rise of institutional grade DeFi platforms, which are attracting more institutional investors by offering enhanced security, compliance, and customer support. This institutional adoption is expected to bring greater liquidity and stability to the DeFi ecosystem.

Automated yield optimization is another trend gaining momentum. Platforms like Yearn Finance are making it easier for users to participate in the yield farming process by automating complex strategies and maximizing returns with minimal effort. As these automated solutions mature, they are likely to become a standard feature across many DeFi protocols.

Innovation in DeFi protocols continues, with new applications such as decentralized derivatives and synthetic assets enabling users to trade derivative contracts and gain exposure to real world assets in a decentralized manner. These advancements are expanding the range of investment opportunities and risk management tools available to DeFi participants.

Regulatory developments are also on the horizon, with clearer guidelines for DeFi platforms expected to emerge. This could foster greater trust and participation from both retail and institutional investors, further accelerating the growth of the DeFi sector.

Staying informed about these DeFi trends will be essential for investors looking to capitalize on new opportunities and navigate the evolving decentralized finance landscape in 2025.

⚠️ Risks of Yield Farming in 2025

While DeFi yield farming offers attractive returns, it is crucial to understand the inherent risks involved:

1. Impermanent Loss

When providing liquidity to a pool, fluctuations in the relative value of deposited assets can cause impermanent loss, reducing overall profits compared to simply holding the assets.

2. Smart Contract Exploits

Bugs or vulnerabilities in smart contract code can lead to loss of funds. Engaging with audited and battle-tested protocols helps mitigate this risk.

3. Protocol Risk

New or unaudited DeFi projects may face collapse or “rug pulls.” Sticking to reputable platforms with secure development processes is essential.

4. Token Volatility

Reward tokens distributed as yield can experience significant price swings, which may offset gains from APYs.

5. Liquidity Risk

Low liquidity in certain pools can result in slippage or difficulty withdrawing assets promptly.

To manage these risks, it is advisable to diversify across multiple protocols, use risk management tools, and stay informed about regulatory developments and security measures in the DeFi sector.

Final Thoughts

In 2025, decentralized finance has evolved into a mature and sophisticated ecosystem offering some of the best passive income opportunities in the financial world. From liquid staking and automated vault strategies to innovative yield tokenization, DeFi platforms empower users to maximize returns on their digital assets with minimal effort. Many platforms are also expanding into synthetic assets, allowing users to gain exposure to traditional assets, including fiat currencies like USD or EUR, through tokenized representations.

However, navigating this complex landscape requires reliable tools and insights. Token Metrics combines AI, real-time data, and deep token analysis to help investors identify the best DeFi yield farming platforms while managing associated risks. Whether you are a retail yield farmer or an institutional investor bridging traditional finance with the DeFi space, leveraging such analytics is key to capitalizing on the highest APYs sustainably.

Explore the DeFi ecosystem with confidence and unlock the full potential of yield farming in 2025. Future predictions indicate continued evolution and innovation in DeFi yield farming platforms, with new opportunities and trends likely to emerge in the coming years.

Build Smarter Crypto Apps &
AI Agents in Minutes, Not Months
Real-time prices, trading signals, and on-chain insights all from one powerful API.
Grab a Free API Key
About Token Metrics
Token Metrics: AI-powered crypto research and ratings platform. We help investors make smarter decisions with unbiased Token Metrics Ratings, on-chain analytics, and editor-curated “Top 10” guides. Our platform distills thousands of data points into clear scores, trends, and alerts you can act on.
30 Employees
analysts, data scientists, and crypto engineers
Daily Briefings
concise market insights and “Top Picks”
Transparent & Compliant
Sponsored ≠ Ratings; research remains independent
Want Smarter Crypto Picks—Free?
See unbiased Token Metrics Ratings for BTC, ETH, and top alts.
Thank you! Your submission has been received!
Oops! Something went wrong while submitting the form.
 No credit card | 1-click unsubscribe
Token Metrics Team
Token Metrics Team

Recent Posts

Research

Shiba Inu Price Prediction 2027: SHIB Forecast & Risk Warning

Token Metrics Team
6 min read

Shiba Inu Price Prediction: Understanding SHIB's Speculative Nature

Shiba Inu operates as a community-driven meme token where price action stems primarily from social sentiment, attention cycles, and speculative trading rather than fundamental value drivers. SHIB exhibits extreme volatility with no defensive characteristics or revenue-generating mechanisms typical of utility tokens. Token Metrics price prediction scenarios below provide technical price forecasts across different market cap environments, though meme tokens correlate more strongly with viral trends and community engagement than systematic market cap models. Positions in SHIB should be sized as high-risk speculative bets with potential for total loss.


Disclosure

Educational purposes only, not financial advice. Crypto is volatile, do your own research and manage risk.

How to read this price prediction:

Each band blends cycle analogues and market-cap share math with TA guardrails. Base assumes steady adoption and neutral or positive macro. Moon layers in a liquidity boom. Bear assumes muted flows and tighter liquidity. For meme tokens, actual price prediction outcomes depend heavily on social trends and community momentum beyond what market cap models capture.

TM Agent baseline:

Token Metrics TM Grade is 24.1%, Sell, with a bearish trading signal. The concise 12‑month numeric price prediction view centers between $0.000005 and $0.000035, with a base case price target near $0.000012.

TM Agent numeric view: scenarios center roughly between $0.000005 and $0.000035, with a base case near $0.000012.

Live details: Token Details 

Key Takeaways for SHIB Price Prediction

  • Highly speculative asset driven by sentiment and attention rather than fundamentals
  • Scenario driven: price prediction outcomes hinge on total crypto market cap and viral momentum
  • Extreme volatility characteristic - SHIB can experience double-digit percentage moves daily
  • TM Agent gist: Bearish short term, price prediction range $0.000005–$0.000035
  • Entertainment risk only, not financial advice

Shiba Inu Price Prediction: Scenario Analysis

Token Metrics price prediction scenarios provide technical price bands across market cap tiers:

8T Market Cap Price Prediction:

At 8 trillion total crypto market cap, SHIB price prediction projects to $0.041998 (bear), $0.042366 (base), and $0.042734 (moon).

16T Market Cap Price Prediction:

At 16 trillion total crypto market cap, SHIB price forecast projects to $0.043973 (bear), $0.045077 (base), and $0.046182 (moon).

23T Market Cap Price Prediction:

At 23 trillion total crypto market cap, SHIB price prediction projects to $0.045948 (bear), $0.047789 (base), and $0.049629 (moon).

  31T Market Cap Price Prediction:

At 31 trillion total crypto market cap, SHIB price prediction projects to $0.047923 (bear), $0.051050 (base), and $0.051307 (moon).

 These technical price prediction ranges assume meme tokens maintain market cap share proportional to overall crypto growth. Actual outcomes for speculative tokens typically exhibit higher variance and stronger correlation to social trends than these price prediction models predict.

What Is Shiba Inu?

Shiba Inu is a meme-born crypto project that centers on community and speculative culture. Unlike utility tokens with specific use cases, SHIB operates primarily as a speculative asset and community symbol. The project focuses on community engagement and entertainment value.

SHIB has demonstrated viral moments and community loyalty within the broader meme token category. The token trades on community sentiment and attention cycles more than fundamentals. Market performance depends heavily on social media attention and broader meme coin cycles.

Risks That Skew Bearish for Price Prediction

  • Extreme volatility from pure sentiment-driven price action with no fundamental support
  • Attention cycles shift rapidly, leaving early viral tokens abandoned as new memes emerge
  • Liquidity can evaporate quickly during downturns, creating severe slippage and exit difficulty
  • Regulatory scrutiny may target meme tokens as securities or gambling instruments
  • Macro risk-off environments hit speculative assets hardest, with meme coins showing largest drawdowns
  • Community fragmentation or developer abandonment can eliminate remaining narrative support
  • These factors could push SHIB price predictions toward the lower bear scenarios

Make Your Next Move with Token Metrics

Token Metrics provides technical analysis, scenario math, price prediction models, and rigorous risk evaluation for hundreds of crypto tokens. Want to dig deeper? Explore our powerful AI-powered ratings and scenario tools here.

FAQs: Shiba Inu Price Prediction

Will SHIB 10x from here according to price predictions?

At current price of $0.041027, a 10x reaches $0.41027. This level does not appear in any of the listed bear, base, or moon price prediction scenarios across 8T, 16T, 23T, or 31T tiers. Meme tokens can 10x rapidly during viral moments but can also lose 90%+ just as quickly. Position sizing for potential total loss is critical. Not financial advice.

What are the biggest risks to SHIB price predictions?

Primary risks include attention shifting to newer memes, community fragmentation, developer abandonment, regulatory crackdowns, and liquidity collapse during downturns. Unlike utility tokens with defensive characteristics, SHIB has zero fundamental floor. Price can approach zero if community interest disappears. Total loss is a realistic outcome that price prediction models cannot fully account for. Not financial advice.

What is the 2027 Shiba Inu price prediction?

Based on Token Metrics analysis, the 2027 price prediction for SHIB centers around $0.000012 in the base case under current market conditions. However, meme token price predictions are highly unreliable due to extreme dependence on social trends, viral cycles, and community sentiment that can change rapidly. These technical price prediction ranges should be viewed with extreme caution.

Can SHIB reach $0.01 according to price predictions?

Based on the price prediction scenarios across all market cap tiers (8T-31T), SHIB projections range from $0.041998 to $0.051307. While these technical price predictions show SHIB trading above $0.04, the extreme volatility and sentiment-driven nature of meme tokens means actual outcomes can vary dramatically from model projections. Not financial advice.


Next Steps

Track live data: Token Details

• Consider fundamental crypto assets with utility and defensive characteristics rather than pure speculation.

Disclosure

Educational purposes only, not financial advice. SHIB is a highly speculative asset with extreme volatility and high risk of total loss. Meme tokens operate as entertainment and gambling instruments rather than investments. Only allocate capital you can afford to lose entirely. Do your own research and manage risk appropriately.

Research

WhiteBIT Coin Price Prediction 2028: $40-$272 Target Analysis

Token Metrics Team
7 min read

WhiteBIT Coin Price Prediction: Portfolio Context for WBT in the 2028 Landscape

Exchange tokens like WhiteBIT Coin offer leveraged exposure to overall market activity, creating concentration risk around a single platform's success. While WBT can deliver outsized returns during bull markets with high trading volumes, platform-specific risks like regulatory action, security breaches, or competitive displacement amplify downside exposure. Portfolio theory suggests balancing such concentrated bets with broader sector exposure.

The price prediction scenarios below show how WBT might perform across different crypto market cap environments. Rather than betting entirely on WhiteBIT Coin's exchange succeeding, diversified strategies blend exchange tokens with L1s, DeFi protocols, and infrastructure plays to capture crypto market growth while mitigating single-platform risk.

The Case for Diversified Index Exposure

Portfolio theory teaches that diversification is the only free lunch in investing. WBT concentration violates this principle by tying your crypto returns to one protocol's fate. Token Metrics Indices blend WhiteBIT Coin with the top one hundred tokens, providing broad exposure to crypto's growth while smoothing volatility through cross-asset diversification. This approach captures market-wide tailwinds without overweighting any single point of failure.

Systematic rebalancing within index strategies creates an additional return source that concentrated positions lack. As some tokens outperform and others lag, regular rebalancing mechanically sells winners and buys laggards, exploiting mean reversion and volatility. Single-token holders miss this rebalancing alpha and often watch concentrated gains evaporate during corrections while index strategies preserve more gains through automated profit-taking.

Beyond returns, diversified indices improve the investor experience by reducing emotional decision-making. Concentrated WBT positions subject you to severe drawdowns that trigger panic selling at bottoms. Indices smooth the ride through natural diversification, making it easier to maintain exposure through full market cycles.

Get Early Acces


Disclosure

Educational purposes only, not financial advice. Crypto is volatile, do your own research and manage risk.

How to read this price prediction:

Each band blends cycle analogues and market-cap share math with TA guardrails. Base assumes steady adoption and neutral or positive macro. Moon layers in a liquidity boom. Bear assumes muted flows and tighter liquidity.

TM Agent baseline:

Token Metrics long term price prediction view for WhiteBIT Coin, cashtag $WBT. Lead metric first, Token Metrics TM Grade is 52.5%, Hold, and the trading signal is bearish, indicating short-term downward momentum. Concise 12-month numeric price prediction view: Token Metrics scenarios center roughly between $10 and $85, with a base case price target near $40.

Live details: Token Details

Key Takeaways for WBT Price Prediction

  • Scenario driven: price prediction outcomes hinge on total crypto market cap; higher liquidity and adoption lift the price bands
  • Single-asset concentration amplifies both upside and downside versus diversified approaches
  • Fundamentals: Fundamental Grade 52.35% (Community 82%, Tokenomics 60%, Exchange 50%, VC —, DeFi Scanner N/A)
  • TM Agent gist: Bearish momentum, 12-month price prediction range $10 to $85
  • Education only, not financial advice

WhiteBIT Coin Price Prediction: Scenario Analysis

Token Metrics price prediction scenarios span four market cap tiers, each representing different levels of crypto market maturity and liquidity:

8T Market Cap Price Prediction:

At an 8 trillion dollar total crypto market cap, WBT price prediction projects to $54.50 in bear conditions, $64.88 in the base case, and $75.26 in bullish scenarios.

16T Market Cap Price Prediction:

Doubling the market to 16 trillion expands the price prediction range to $78.61 (bear), $109.75 (base), and $140.89 (moon).

23T Market Cap Price Prediction:

At 23 trillion, the price forecast scenarios show $102.71, $154.61, and $206.51 respectively.

31T Market Cap Price Prediction:

In the maximum liquidity scenario of 31 trillion, WBT price prediction could reach $126.81 (bear), $199.47 (base), or $272.13 (moon).


These price prediction ranges illustrate potential outcomes for concentrated WBT positions, but investors should weigh whether single-asset exposure matches their risk tolerance or whether diversified strategies better suit their objectives.

What Is WhiteBIT Coin?

WhiteBIT Coin is the native exchange token associated with the WhiteBIT ecosystem. It is designed to support utility on the platform and related services.

WBT typically provides fee discounts and ecosystem benefits where supported. Usage depends on exchange activity and partner integrations.

Token Metrics AI Analysis for Price Prediction

Token Metrics AI provides comprehensive context on WhiteBIT Coin's positioning and challenges that inform our price prediction models.

Vision: The stated vision for WhiteBIT Coin centers on enhancing user experience within the WhiteBIT exchange ecosystem by providing tangible benefits such as reduced trading fees, access to exclusive features, and participation in platform governance or rewards programs. It aims to strengthen user loyalty and engagement by aligning token holders' interests with the exchange's long-term success. While not positioned as a decentralized protocol token, its vision reflects a broader trend of exchanges leveraging tokens to build sustainable, incentivized communities.

Problem: Centralized exchanges often face challenges in retaining active users and differentiating themselves in a competitive market. Users may be deterred by high trading fees, limited reward mechanisms, or lack of influence over platform developments. WhiteBIT Coin aims to address these frictions by introducing a native incentive layer that rewards participation, encourages platform loyalty, and offers cost-saving benefits. This model seeks to improve user engagement and create a more dynamic trading environment on the WhiteBIT platform.

Solution: WhiteBIT Coin serves as a utility token within the WhiteBIT exchange, offering users reduced trading fees, staking opportunities, and access to special events such as token sales or airdrops. It functions as an economic lever to incentivize platform activity and user retention. While specific governance features are not widely documented, such tokens often enable voting on platform upgrades or listing decisions. The solution relies on integrating the token deeply into the exchange's operational model to ensure consistent demand and utility for holders.

Market Analysis: Exchange tokens like WhiteBIT Coin operate in a competitive landscape led by established players such as Binance Coin (BNB) and KuCoin Token (KCS). While BNB benefits from a vast ecosystem including a launchpad, decentralized exchange, and payment network, WBT focuses on utility within its native exchange. Adoption drivers include the exchange's trading volume, security track record, and the attractiveness of fee discounts and staking yields. Key risks involve regulatory pressure on centralized exchanges and competition from other exchange tokens that offer similar benefits.

Fundamental Snapshot from Token Metrics

Fundamental Grade: 52.35% (Community 82%, Tokenomics 60%, Exchange 50%, VC —, DeFi Scanner N/A).


Catalysts That Skew Bullish for Price Prediction

  • Institutional and retail access expands with ETFs, listings, and integrations
  • Macro tailwinds from lower real rates and improving liquidity
  • Product or roadmap milestones such as upgrades, scaling, or partnerships
  • These factors could push WBT toward higher price prediction targets

Risks That Skew Bearish for Price Prediction

  • Macro risk-off from tightening or liquidity shocks
  • Regulatory actions or infrastructure outages
  • Concentration in validator economics and competitive displacement
  • Protocol-specific execution risk and competitive pressure from alternatives
  • These factors could push WBT toward lower price prediction scenarios

FAQs: WhiteBIT Coin Price Prediction

Can WBT reach $100 according to price predictions?

Based on the price prediction scenarios, WBT could reach $100 in the 16T base case. The 16T tier projects $109.75 in the base case price forecast. Achieving this price prediction requires both broad market cap expansion and WhiteBIT Coin maintaining competitive position. Not financial advice.

What's the risk/reward profile for WBT price prediction?

Risk and reward in our price prediction model span from $54.50 in the lowest bear case to $272.13 in the highest moon case. Downside risks include regulatory actions and competitive displacement, while upside drivers include expanding access and favorable macro liquidity. Concentrated positions amplify both tails, while diversified strategies smooth outcomes.

What gives WBT value and impacts price predictions?

WBT accrues value through fee discounts, staking rewards, access to special events, and potential participation in platform programs. Demand drivers include exchange activity, user growth, and security reputation. While these fundamentals matter for price predictions, diversified portfolios capture value accrual across multiple tokens rather than betting on one protocol's success.

What is the 2028 WhiteBIT Coin price prediction?

Based on Token Metrics analysis, the 2028 price prediction for WhiteBIT Coin centers around $40 in the base case under current market conditions, with a range between $10 and $85 depending on market scenarios. Bullish price predictions range from $64.88 to $272.13 across different total crypto market cap environments.

Can WBT reach $200 by 2028?

According to our price prediction models, WBT could reach $200 in the 23T moon case ($206.51) and in the 31T scenarios where the base case is $199.47 and the moon case is $272.13. These price prediction outcomes require significant crypto market expansion and WhiteBIT maintaining strong competitive positioning. Not financial advice.


Next Steps

Disclosure

Educational purposes only, not financial advice. Crypto is volatile, concentration amplifies risk, and diversification is a fundamental principle of prudent portfolio construction. Do your own research and manage risk appropriately.

Research

Predicting Litecoin Price in 2027: Scenario Analysis & On-Chain Scores

Token Metrics Team
6 min read

Litecoin Price Prediction Framework: Market Cap Scenarios & 2027 Forecast

Layer 1 tokens capture value through transaction fees and miner economics. Litecoin processes blocks every 2.5 minutes using Proof of Work, targeting fast, low-cost payments. The price prediction scenarios below model LTC outcomes across different total crypto market sizes, reflecting network adoption and transaction volume.


Disclosure

Educational purposes only, not financial advice. Crypto is volatile, do your own research and manage risk.

How to read this price prediction:

Each band blends cycle analogues and market-cap share math with TA guardrails. Base assumes steady adoption and neutral or positive macro. Moon layers in a liquidity boom. Bear assumes muted flows and tighter liquidity.

TM Agent baseline:

Token Metrics price prediction scenarios center roughly between $35 and $160, with a base case price target near $75, assuming gradual adoption, occasional retail rotation into major alts, and no major network issues. In a broad crypto rally LTC could test the upper bound price prediction, while in risk-off conditions it would likely drift toward the lower bound.

Live details: Token Details

Key Takeaways for LTC Price Prediction

  • Scenario driven: price prediction outcomes hinge on total crypto market cap; higher liquidity and adoption lift the price bands
  • Fundamentals: Fundamental Grade 83.98% (Community 79%, Tokenomics 100%, Exchange 100%, VC —, DeFi Scanner 57%)
  • Technology: Technology Grade 46.67% (Activity 51%, Repository 72%, Collaboration 60%, Security 20%, DeFi Scanner 57%)
  • TM Agent gist: the TM Grade is 21.8 (Sell), and the trading signal is bearish, indicating short-term downward momentum
  • Education only, not financial advice

Litecoin Price Prediction: Scenario Analysis

Token Metrics price prediction scenarios span four market cap tiers reflecting different crypto market maturity levels:

8T Market Cap Price Prediction:

At an 8 trillion dollar total crypto market cap, LTC price prediction projects to $115.80 in bear conditions, $137.79 in the base case, and $159.79 in bullish scenarios.

16T Market Cap Price Prediction:

At 16 trillion, the price prediction range expands to $154.54 (bear), $220.52 (base), and $286.50 (moon).

23T Market Cap Price Prediction:

The 23 trillion tier price forecast shows $193.28, $303.25, and $413.21 respectively.

31T Market Cap Price Prediction:

In the maximum liquidity scenario at 31 trillion, LTC price prediction reaches $232.03 (bear), $385.98 (base), or $539.92 (moon).


What Is Litecoin?

Litecoin is a peer-to-peer cryptocurrency launched in 2011 as an early Bitcoin fork. It uses Proof of Work with Scrypt and targets faster settlement, processing blocks roughly every 2.5 minutes with low fees.

LTC is the native token used for transaction fees and miner rewards. Its primary utilities are fast, low-cost payments and serving as a testing ground for Bitcoin-adjacent upgrades, with adoption in retail payments, remittances, and exchange trading pairs.

Token Metrics AI Analysis for Price Prediction

Token Metrics AI provides additional context on Litecoin's technical positioning and market dynamics that inform our price prediction models.

Vision: Litecoin's vision is to serve as a fast, low-cost, and accessible digital currency for everyday transactions. It aims to complement Bitcoin by offering quicker settlement times and a more efficient payment system for smaller, frequent transfers.

Problem: Bitcoin's relatively slow block times and rising transaction fees during peak usage make it less ideal for small, frequent payments. This creates a need for a cryptocurrency that maintains security and decentralization while enabling faster and cheaper transactions suitable for daily use.

Solution: Litecoin addresses this by using a 2.5-minute block time and the Scrypt algorithm, which initially allowed broader participation in mining and faster transaction processing. It functions primarily as a payment-focused blockchain, supporting peer-to-peer transfers with low fees and high reliability, without the complexity of smart contract functionality.

Market Analysis: Litecoin operates in the digital payments segment of the cryptocurrency market, often compared to Bitcoin but positioned as a more efficient medium of exchange. While it lacks the smart contract capabilities of platforms like Ethereum or Solana, its simplicity, long-standing network security, and brand recognition give it a stable niche. It competes indirectly with other payment-focused cryptocurrencies like Bitcoin Cash and Dogecoin. Adoption is sustained by its integration across major exchanges and payment services, but growth is limited by the broader shift toward ecosystems offering decentralized applications.

Fundamental and Technology Snapshot from Token Metrics

Fundamental Grade: 83.98% (Community 79%, Tokenomics 100%, Exchange 100%, VC —, DeFi Scanner 57%).


Technology Grade: 46.67% (Activity 51%, Repository 72%, Collaboration 60%, Security 20%, DeFi Scanner 57%).


Catalysts That Skew Bullish for Price Prediction

  • Institutional and retail access expands with ETFs, listings, and integrations
  • Macro tailwinds from lower real rates and improving liquidity
  • Product or roadmap milestones such as upgrades, scaling, or partnerships
  • These factors could push LTC toward higher price prediction targets

Risks That Skew Bearish for Price Prediction

  • Macro risk-off from tightening or liquidity shocks
  • Regulatory actions or infrastructure outages
  • Concentration in validator economics and competitive displacement
  • These factors could push LTC toward lower price prediction scenarios

Where to get deeper research and insights?

For comprehensive Litecoin ratings, on-chain analysis, AI-powered price forecasts, and trading signals, go to Token Metrics.

FAQs: Litecoin Price Prediction

What is LTC used for?

Primary use cases include fast peer-to-peer payments, low-cost remittances, and exchange settlement/liquidity pairs. LTC holders primarily pay transaction fees and support miner incentives. Adoption depends on active addresses and payment integrations, which directly impact long-term price prediction models.

What price could LTC reach in the moon case price prediction?

Moon case price predictions range from $159.79 at 8T to $539.92 at 31T total crypto market cap. These price prediction scenarios require maximum market cap expansion and strong adoption dynamics. Not financial advice.

What is the 2027 Litecoin price prediction?

Based on Token Metrics analysis, the 2027 price prediction for Litecoin centers around $75 in the base case under current market conditions, with a range between $35 and $160 depending on market scenarios. Bullish price predictions range from $137.79 to $539.92 across different total crypto market cap environments.

Can LTC reach $500 according to price predictions?

According to our price prediction models, LTC could reach $500+ in the 31T moon case where it projects to $539.92. This price prediction outcome requires significant crypto market expansion (31 trillion total market cap) combined with strong Litecoin network adoption. Not financial advice.

How does Litecoin's price prediction compare to Bitcoin?

While Litecoin was designed as "silver to Bitcoin's gold," its price prediction typically reflects a fraction of Bitcoin's value due to lower market cap and adoption. However, LTC often benefits from Bitcoin rallies while offering faster transaction times, which can impact relative price performance during payment-focused adoption cycles.


Next Steps

Track live grades and signals: Token Details 

Buy LTC on MEXC

Disclosure

Educational purposes only, not financial advice. Crypto is volatile, do your own research and manage risk.

Choose from Platinum, Gold, and Silver packages
Reach with 25–30% open rates and 0.5–1% CTR
Craft your own custom ad—from banners to tailored copy
Perfect for Crypto Exchanges, SaaS Tools, DeFi, and AI Products