Back to blog
Research

Dogecoin Price Prediction 2026: Meme Coin Bull Market Analysis

Actionable Dogecoin price prediction with scenario math, on-chain grades, and a clear TLDR for investors looking at 2027.
Token Metrics Team
6 min read
Want Smarter Crypto Picks—Free?
See unbiased Token Metrics Ratings for BTC, ETH, and top alts.
Thank you! Your submission has been received!
Oops! Something went wrong while submitting the form.
 No credit card | 1-click unsubscribe

Why 2026 Looks Bullish for Dogecoin Price Prediction: Market Context

Crypto is transitioning into a broadly bullish regime into 2026 as liquidity improves and adoption deepens.

Regulatory clarity is reshaping the classic four-year cycle, flows can arrive earlier and persist longer as institutions gain confidence. Access and infrastructure continue to mature with ETFs, qualified custody, and faster L2 scaling that reduce frictions for new capital. Real-world integrations expand the surface area for crypto utility, which supports sustained participation across market phases.

This bullish backdrop frames our Dogecoin price prediction scenario work for DOGE. The bands below reflect different total market sizes and DOGE's share dynamics across varying liquidity conditions, providing comprehensive price prediction analysis for investors.


How to Read This DOGE Price Prediction

Each band blends cycle analogues and market-cap share math with TA guardrails. Base assumes steady adoption and neutral or positive macro. Moon layers in a liquidity boom. Bear assumes muted flows and tighter liquidity.

TM Agent baseline: Token Metrics lead metric, TM Grade, is 22.65 (Sell), and the trading signal is bearish, indicating short-term downward momentum. Price context: $DOGE is trading around $0.193, rank #9, down about 3.1% in 24 hours and roughly 16% over 30 days. Implication: upside in our price prediction models likely requires a broader risk-on environment and renewed retail or celebrity-driven interest.

Live details: Dogecoin Token Details → https://app.tokenmetrics.com/en/dogecoin

Buy DOGE

Key Takeaways: Dogecoin Price Prediction Summary

  • Scenario driven: Price prediction outcomes hinge on total crypto market cap; higher liquidity and adoption lift the bands
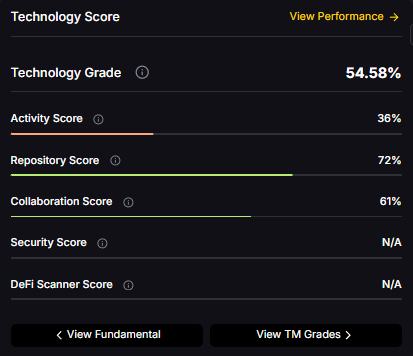
  • Technology: Technology Grade 54.58% (Activity 36%, Repository 72%, Collaboration 61%, Security N/A, DeFi Scanner N/A)
  • TM Agent gist: Cautious long-term stance in price prediction models until grades and momentum improve
  • Current rating: Sell (22.65) despite bullish 2026 macro backdrop
  • Meme coin dynamics: Celebrity influence and retail sentiment drive price prediction volatility
  • Education only, not financial advice

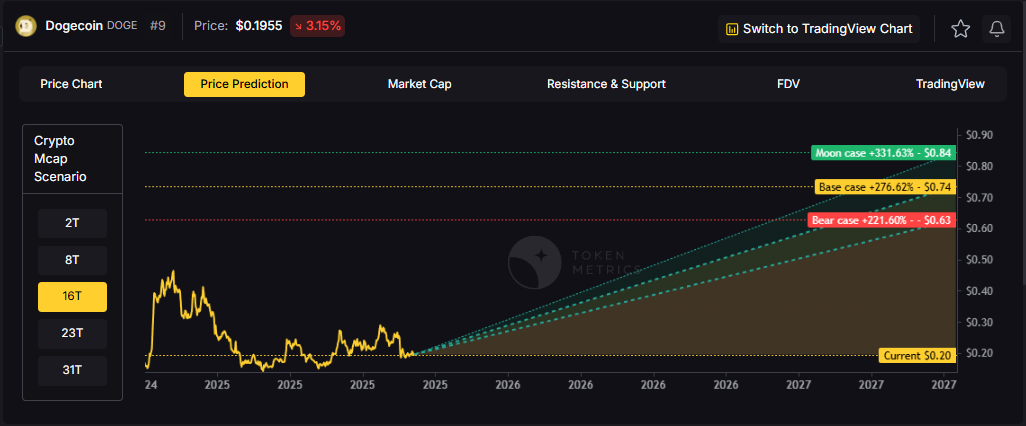
Dogecoin Price Prediction Scenario Analysis

Token Metrics price prediction scenarios span four market cap tiers, each representing different levels of crypto market maturity and liquidity:

8T Market Cap - DOGE Price Prediction:

At an 8 trillion dollar total crypto market cap, our DOGE price prediction framework projects specific targets in bear, base, and bullish scenarios. The 8T tier reflects conservative market conditions with modest meme coin participation.

16T Market Cap - DOGE Price Prediction:

Doubling the market to 16 trillion expands the DOGE price prediction range significantly, reflecting increased retail participation and potential celebrity-driven catalysts that historically benefit Dogecoin.

16T Market Cap - DOGE Price Prediction:

Doubling the market to 16 trillion expands the DOGE price prediction range significantly, reflecting increased retail participation and potential celebrity-driven catalysts that historically benefit Dogecoin.

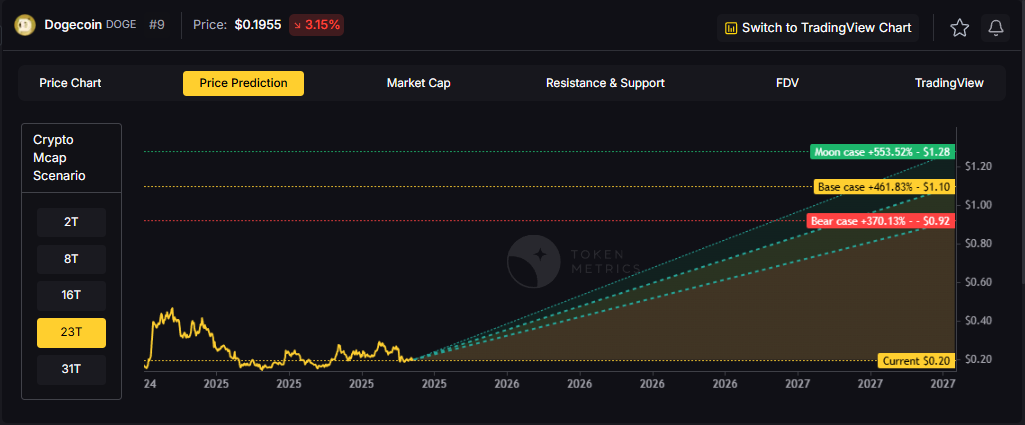
 31T Market Cap - DOGE Price Prediction:

In the maximum liquidity scenario of 31 trillion, DOGE price predictions reach their highest potential across all scenarios (bear, base, and moon), with all three bands projecting levels above $1.00 according to our framework.

 Each tier in our price prediction framework assumes progressively stronger market conditions, with particular emphasis on retail-driven liquidity and social media sentiment that uniquely impacts meme coin valuations.

Why Consider the Indices with Top-100 Exposure

Diversification matters. Dogecoin is compelling, yet concentrated bets can be volatile—especially for meme coins where price predictions are heavily influenced by sentiment. Token Metrics Indices hold DOGE alongside the top one hundred tokens for broad exposure to leaders and emerging winners.

Our backtests indicate that owning the full market with diversified indices has historically outperformed both the total market and Bitcoin in many regimes due to diversification and rotation benefits, reducing single-asset risk inherent in meme coin price predictions.

Get early access

What Is Dogecoin?

Dogecoin is a peer-to-peer cryptocurrency that began as a meme but has evolved into a widely recognized digital asset used for tipping, payments, and community-driven initiatives. It runs on its own blockchain with inflationary supply mechanics. The token's liquidity and brand awareness create periodic speculative cycles, especially during broad risk-on phases—all critical factors influencing DOGE price predictions.

Technology Snapshot from Token Metrics

Technology Grade: 54.58% (Activity 36%, Repository 72%, Collaboration 61%, Security N/A, DeFi Scanner N/A).


Catalysts That Skew DOGE Price Predictions Bullish

  • Institutional and retail access expands with ETFs, listings, and integrations
  • Macro tailwinds from lower real rates and improving liquidity expected in 2026
  • Product or roadmap milestones such as upgrades, scaling, or partnerships
  • Celebrity endorsements or social media viral moments (Elon Musk effect)
  • Retail FOMO during bull market phases
  • Payment adoption and merchant acceptance expansion
  • Meme coin narrative strength during risk-on sentiment

Risks That Skew DOGE Price Predictions Bearish

  • Macro risk-off from tightening or liquidity shocks
  • Regulatory actions targeting meme coins or infrastructure outages
  • Current Sell rating (22.65) indicating weak fundamentals
  • Low technology grade (54.58%) and minimal development activity (36%)
  • Lack of utility compared to smart contract platforms
  • Inflationary supply mechanics creating selling pressure
  • Celebrity sentiment shifts or negative social media attention
  • Competition from newer meme coins capturing retail interest

Special Offer — Token Metrics Advanced Plan with 20% Off

Unlock platform-wide intelligence on every major crypto asset. Use code ADVANCED20 at checkout for twenty percent off.

  • AI powered ratings on thousands of tokens for traders and investors
  • Interactive TM AI Agent to ask any crypto question
  • Indices explorer to surface promising tokens and diversified baskets
  • Signal dashboards, backtests, and historical performance views
  • Watchlists, alerts, and portfolio tools to track what matters
  • Early feature access and enhanced research coverage

Start with Advanced today

Dogecoin Price Prediction FAQs

Can DOGE reach $1.00?

Yes. Multiple tiers in our price prediction framework imply levels above $1.00 by the 2027 horizon, including the 23T Base case and all 31T scenarios (bear, base, and moon). However, achieving this requires the bullish 2026 thesis materializing with strong retail participation and favorable macro conditions. Despite the Sell rating (22.65), the $1 psychological level remains achievable in higher liquidity environments. Not financial advice.

Is DOGE a good long-term investment?

DOGE presents a high-risk, high-volatility investment case with a Sell rating (22.65) and modest technology grade (54.58%). Our price prediction models show potential upside in bullish scenarios, but the outcome depends heavily on adoption, liquidity regime, celebrity influence, retail sentiment, and supply dynamics. Meme coins lack fundamental utility of smart contract platforms, making them speculative plays. Diversify and size positions responsibly. Not financial advice.

What is the Dogecoin price prediction for 2026-2027?

Our comprehensive DOGE price prediction framework for 2026-2027 suggests Dogecoin could reach significant levels depending on total crypto market capitalization, with the 23T and 31T scenarios projecting above $1.00 across multiple bands. Current price of $0.193 implies substantial upside potential (400%+ gains to $1) if bullish 2026 conditions materialize. However, the Sell rating (22.65) reflects concerns about fundamentals and current bearish momentum. Not financial advice.

Can DOGE reach $10?

DOGE reaching $10 would require extraordinary market conditions and market capitalization exceeding most realistic scenarios in our price prediction models. At current supply levels, $10 DOGE would imply a market cap surpassing major corporations. While our 31T moon scenarios show substantial upside, $10 appears beyond rational price prediction frameworks without significant supply changes or unprecedented retail mania. Not financial advice.

Should I buy DOGE now or wait?

DOGE has a Sell rating (22.65) indicating Token Metrics does not currently endorse Dogecoin at these levels, despite bullish 2026 macro thesis. Current price of $0.193 is down 16% over 30 days with bearish trading signals. However, if you believe in the 2026 bull market thesis and meme coin comeback, dollar-cost averaging may reduce timing risk. Meme coins are highly speculative—size positions accordingly and consider diversified exposure through indices. Not financial advice.

Why does DOGE have a Sell rating despite bullish 2026 outlook?

DOGE receives a Sell rating (22.65) due to weak fundamentals, modest technology grade (54.58%), low development activity (36%), and current bearish momentum—despite the broader bullish 2026 macro thesis. Our price prediction framework shows potential upside in favorable liquidity scenarios, but ratings reflect current conditions and fundamental quality rather than just market sentiment. The rating suggests caution even in bullish environments. Not financial advice.

How does DOGE compare to other meme coin price predictions?

Dogecoin remains the original and most established meme coin with superior liquidity, exchange listings, and brand recognition versus competitors like Shiba Inu or PEPE. Our price prediction framework suggests DOGE could exceed $1.00 in 23T+ scenarios. However, the Sell rating (22.65) reflects that even among meme coins, DOGE's low technology grade (54.58%) and minimal development activity create concerns. First-mover advantage matters, but newer meme coins may offer higher risk-adjusted returns.

What role do celebrities play in DOGE price predictions?

Celebrity influence—particularly from Elon Musk—significantly impacts Dogecoin price predictions and has historically driven major rallies. Our bullish 2026 scenarios assume potential for renewed celebrity-driven interest during risk-on phases. However, this creates unpredictable volatility that price prediction models struggle to capture. The Sell rating (22.65) reflects concerns that celebrity sentiment alone cannot sustain long-term value without fundamental improvements. Not financial advice.

Can DOGE benefit from the 2026 bull market?

Yes. Our price prediction scenarios are specifically framed around the bullish 2026 thesis, where improving liquidity, institutional participation, and retail FOMO create favorable conditions for meme coins. DOGE's brand recognition and top-10 ranking position it to capture bull market momentum. However, the Sell rating (22.65) and low technology grade (54.58%) suggest DOGE may underperform versus utility tokens. Meme coins tend to outperform in late-stage bull markets driven by retail speculation. Not financial advice.

What are the biggest risks to DOGE price predictions?

Key risks that could derail Dogecoin price predictions include: current Sell rating (22.65) indicating weak fundamentals, low technology grade (54.58%) and minimal development activity (36%), inflationary supply creating perpetual selling pressure, lack of utility versus smart contract platforms, regulatory targeting of meme coins, negative celebrity sentiment shifts, competition from newer meme coins, macro liquidity shocks ending the 2026 bull thesis, and excessive speculation leading to retail exhaustion. Not financial advice.

Will DOGE hit $1 in 2026?

Our price prediction framework suggests DOGE reaching $1.00 is achievable in the 23T base case and all 31T scenarios (bear, base, moon), which could materialize in the bullish 2026-2027 environment. From current price of $0.193, this represents approximately 400%+ gains. However, achieving this requires sustained macro liquidity, retail participation, positive celebrity sentiment, and overcoming the current Sell rating (22.65) concerns. Possible but not guaranteed—manage expectations accordingly. Not financial advice.

How accurate are Dogecoin price predictions?

Dogecoin price predictions are particularly challenging due to meme coin volatility, celebrity influence unpredictability, and sentiment-driven price action that doesn't follow traditional fundamental analysis. Our scenario-based framework provides structured projections across multiple market cap tiers, but actual outcomes may vary significantly. The Sell rating (22.65) and low technology grade (54.58%) suggest fundamental weaknesses that could limit upside regardless of market conditions. Use price predictions as educational frameworks, not guarantees. Not financial advice.

‍

Next Steps

• Track live grades and signals: Token Details
• Join Indices Early Access
• Want exposure Buy DOGE on MEXC

Disclosure

Educational purposes only, not financial advice. Crypto is volatile, do your own research and manage risk.

Why Use Token Metrics for DOGE Price Predictions?

  • Bullish 2026 framework: Specialized analysis of improving macro conditions favoring meme coins
  • Scenario-based modeling: Four market cap tiers for comprehensive price prediction analysis
  • Honest ratings: Sell (22.65) transparency despite bullish market thesis
  • Meme coin specialization: Understanding sentiment-driven price action and celebrity influence
  • Risk management: Indices for diversified exposure beyond single meme coin concentration
  • Real-time signals: Trading signals and TM Grades updated regularly
  • Comparative analysis: Analyze DOGE against SHIB, PEPE, and 6,000+ tokens
Build Smarter Crypto Apps &
AI Agents in Minutes, Not Months
Real-time prices, trading signals, and on-chain insights all from one powerful API.
Grab a Free API Key
About Token Metrics
Token Metrics: AI-powered crypto research and ratings platform. We help investors make smarter decisions with unbiased Token Metrics Ratings, on-chain analytics, and editor-curated “Top 10” guides. Our platform distills thousands of data points into clear scores, trends, and alerts you can act on.
30 Employees
analysts, data scientists, and crypto engineers
Daily Briefings
concise market insights and “Top Picks”
Transparent & Compliant
Sponsored ≠ Ratings; research remains independent
Want Smarter Crypto Picks—Free?
See unbiased Token Metrics Ratings for BTC, ETH, and top alts.
Thank you! Your submission has been received!
Oops! Something went wrong while submitting the form.
 No credit card | 1-click unsubscribe
Token Metrics Team
Token Metrics Team

Recent Posts

Research

Where to Trade Indices: Complete Platform Guide for 2025

Token Metrics Team
7 min read

Finding the right platform to trade cryptocurrency indices can dramatically impact your investment experience, costs, and outcomes. With crypto indices gaining popularity as a way to gain diversified market exposure without managing dozens of individual positions, understanding where to trade them—and what makes one platform superior to another—has become essential knowledge for both novice and experienced investors.

Understanding Crypto Index Trading Platforms

Cryptocurrency indices represent baskets of digital assets that track specific market segments or strategies. Unlike traditional stock market indices that you might trade through any brokerage, crypto indices exist across a fragmented landscape of centralized exchanges, decentralized protocols, and specialized platforms. Each option presents distinct tradeoffs in terms of custody, transparency, fees, and ease of use.

The platform you choose determines not just transaction costs, but also whether you maintain control of your assets, how easily you can verify what you actually own, and whether the index operates according to clear, auditable rules. These considerations matter far more in cryptocurrency than in traditional finance, where regulatory oversight provides baseline protections largely absent in the crypto ecosystem.

Token Metrics Indices Hub: The Integrated Solution

Token Metrics has built a dedicated Indices hub at tokenmetrics.com/indices that addresses the key pain points of crypto index investing. This platform combines rules-based index products with embedded wallet technology, creating a seamless experience from research to execution to ongoing management.

The flagship TM Global 100 index exemplifies this approach. It holds the top 100 cryptocurrencies by market cap during bullish conditions and automatically switches to stablecoins when market signals turn bearish. The entire position rebalances weekly, with all holdings, transaction history, and strategy rules visible in the interface.

What distinguishes Token Metrics from alternatives is the integration between research and execution. Users who follow Token Metrics' market analysis can translate those insights directly into positions through one-click purchases, completing transactions in approximately 90 seconds. The embedded, self-custodial smart wallet eliminates the need to navigate multiple platforms or manage complex on-chain interactions manually.

Centralized Exchange Options

Major cryptocurrency exchanges like Binance, Coinbase, and Kraken offer some index-like products, typically structured as baskets or themed portfolios. These platforms provide familiar interfaces and substantial liquidity, making them accessible entry points for newcomers to crypto index investing.

However, centralized exchange index products often lack true automation and transparency. Many require you to manually rebalance positions, defeating the purpose of index investing. The custody model means you're trusting the exchange with your assets rather than maintaining control through self-custody. Additionally, the strategies governing these products may not be clearly documented or consistently executed.

Fee structures on centralized exchanges can be complex and difficult to compare. Trading fees, withdrawal fees, and potential management fees compound in ways that aren't always obvious until you've been using the platform for months. The convenience of centralized platforms comes with meaningful tradeoffs that serious investors should carefully consider.

Decentralized Protocol Approaches

Decentralized finance (DeFi) protocols offer index products through smart contracts on blockchains like Ethereum, Polygon, and others. Projects like Index Coop and PowerPool create tokenized indices that trade like regular cryptocurrencies, maintaining their basket composition through smart contract logic.

The advantage of DeFi indices lies in their permissionless nature and the transparency of on-chain operations. Anyone can verify holdings and rebalancing activity by examining blockchain data. Self-custody is built into the model—you hold index tokens in your own wallet rather than trusting a custodian.

The challenges include higher technical barriers to entry, gas fees that can make small positions uneconomical, and the need to manage private keys and wallet security yourself. Smart contract risk adds another consideration—bugs or exploits in the code governing index composition could result in loss of funds. For users comfortable with DeFi mechanics, these protocols offer powerful options, but they're not ideal for everyone.

Traditional Finance Platforms with Crypto Exposure

Some traditional investment platforms now offer cryptocurrency index products, typically through futures or trusts rather than direct asset holdings. Platforms like Fidelity, Charles Schwab, and others have introduced crypto exposure for their clients, including some index-like products.

These options appeal to investors who prefer the regulatory framework and familiar interfaces of traditional finance. Account protections, tax reporting, and customer support typically exceed what's available in native crypto platforms. However, the products themselves often track crypto market performance indirectly through derivatives rather than holding actual cryptocurrencies, introducing tracking error and counterparty risk.

Fees for crypto exposure through traditional platforms tend to be higher than native crypto solutions, and the available products are limited compared to the broader crypto index ecosystem. These platforms work well for traditional investors dipping their toes into crypto, but serious crypto participants usually seek more direct exposure.

Key Factors When Choosing Where to Trade

Several considerations should guide your platform selection. Custody model determines whether you or the platform controls your assets—self-custody provides security and autonomy but requires technical competence, while custodial solutions offer convenience at the cost of control and potential regulatory risk.

Transparency and verifiability separate quality platforms from opaque ones. Can you see exactly what assets the index holds? Are rebalancing events logged and auditable? Is the strategy governing index composition clearly documented? Platforms that can't answer these questions affirmatively should raise red flags.

Fee structure impacts long-term returns significantly. Look beyond headline trading fees to understand total costs including gas fees, platform fees, slippage, and any management or rebalancing charges. The cheapest-appearing option often proves expensive once all costs are accounted for.

Ease of use matters more than many investors initially realize. Clunky interfaces, complex rebalancing processes, and unclear fee disclosures create friction that either discourages proper portfolio management or leads to costly mistakes. The best platform is one you'll actually use correctly and consistently.

Why Token Metrics Indices Stands Out

Token Metrics Indices addresses the weaknesses common to alternative platforms while preserving their strengths. The self-custodial embedded wallet provides security without requiring users to manage private keys manually or navigate complex DeFi protocols. One-click purchasing and clear fee disclosure at checkout remove friction from the investment process. Weekly automatic rebalancing eliminates the manual effort that makes index investing on exchanges time-consuming, while the regime-switching methodology provides downside protection that pure passive indices lack. Complete transparency through strategy documentation, holdings displays, and transaction logs ensures you always know what you own and why.

The integration with Token Metrics' broader research ecosystem creates unique value—analysis and actionable positions exist on the same platform, reducing the gap between insight and execution. For users already consuming Token Metrics research, the Indices hub represents the natural evolution of that relationship.

Discover Crypto Gems with Token Metrics AI

Token Metrics uses AI-powered analysis to help you uncover profitable opportunities in the crypto market. Get Started For Free

Getting Started with Index Trading

Begin by joining the waitlist at the Token Metrics Indices hub to secure access to new products as they launch. While waiting, familiarize yourself with index concepts, review the strategy documentation for products like TM Global 100, and consider how indices might fit within your broader investment approach.

When access becomes available, start with smaller positions to understand the mechanics before committing significant capital. Review the fee preview carefully at checkout, and track your position's performance through the My Indices dashboard to verify that the index behaves as documented.

Consider indices as a core holding for broad market exposure while potentially using individual positions for tactical opportunities. This barbell approach—rules-based index core with selective satellite positions—combines the discipline of systematic investing with the flexibility to act on high-conviction ideas.

Conclusion

Where you trade indices matters as much as which indices you trade. Platform selection affects custody, transparency, costs, and user experience in ways that compound over time to create dramatically different outcomes. Token Metrics offers a solution purpose-built for crypto index investing, combining the best elements of centralized convenience, DeFi transparency, and systematic strategy execution.

By providing self-custodial security, one-click simplicity, automatic rebalancing, and complete operational transparency, Token Metrics creates the ideal environment for both index investing newcomers and experienced traders seeking a disciplined core holding. Join the waitlist at tokenmetrics.com/indices to experience the next generation of crypto index trading.

Research

How to Trade Indices on Token Metrics: Complete 2025 Guide

Token Metrics Team
9 min read

Trading individual cryptocurrencies can be time-consuming and overwhelming, especially when trying to maintain exposure to market-wide movements while managing risk. Token Metrics Indices offers a streamlined solution that allows you to trade entire market baskets with the same ease as buying a single token. This comprehensive guide walks you through everything you need to know about trading indices on the Token Metrics platform.

Understanding Token Metrics Indices

Token Metrics Indices are rules-based baskets that track defined universes of cryptocurrencies with scheduled rebalances and clear inclusion criteria. Unlike manual portfolio management that requires constant monitoring and adjustment, these indices automate the process of maintaining diversified crypto exposure according to predetermined strategies.

The flagship offering, TM Global 100, exemplifies this approach by holding the top 100 cryptocurrencies by market cap during bullish market conditions and automatically switching to stablecoins when market signals turn bearish. This regime-switching methodology combines broad market participation with disciplined risk management, rebalancing weekly to reflect current market conditions.

Getting Started: Joining the Waitlist

Before you can trade Token Metrics indices, you'll need to secure access through the waitlist process. Navigate to the Token Metrics Indices hub and select the index you're interested in—such as TM Global 100. Click the "Join Waitlist" button to register your interest.

During the waitlist registration, you have the option to connect your wallet and preview the one-click buy flow along with available funding options. This optional step familiarizes you with the interface before launch, ensuring a smooth experience when trading becomes available. Once the index launches, you'll receive both an email notification and an in-app prompt, giving you immediate access to start trading.

The Trading Process: Step-by-Step

Trading indices on Token Metrics is designed for simplicity and speed, with most transactions completing in approximately 90 seconds. When you're ready to purchase an index, click the "Buy Index" button from the index's main page. This initiates the embedded wallet checkout flow that handles all the technical complexity behind the scenes.

The checkout interface presents comprehensive information before you commit to the trade. You'll see estimated gas fees, platform fees, maximum slippage tolerance, and the minimum expected value you'll receive. This transparency ensures you understand exactly what you're paying and what you're getting before confirming the transaction.

Review the current holdings displayed in both treemap and table formats. The treemap provides a visual representation of asset allocation, making it easy to understand portfolio composition at a glance, while the table view offers detailed information about each constituent asset. Once you've reviewed all details and are satisfied with the terms, confirm the transaction.

Understanding the Embedded Wallet

Token Metrics uses an embedded, self-custodial smart wallet for index transactions. This means you maintain complete control over your funds rather than entrusting them to a custodial service. The wallet is designed to lower operational barriers while preserving the security benefits of self-custody.

Funding options vary based on your connected wallet and blockchain network. The platform supports USDC for selling positions, and funding options surface automatically during checkout based on chain and wallet compatibility. This flexibility ensures you can participate regardless of which assets you currently hold.

The self-custodial nature means you're responsible for securing your access credentials, but it also ensures that Token Metrics never has direct control over your assets. This architecture aligns with crypto's ethos of user sovereignty while making the experience as seamless as possible.

Monitoring Your Positions

After purchasing an index, track your position under the "My Indices" section of the platform. This dashboard provides real-time profit and loss tracking, showing how your investment performs relative to your entry point. The interface updates dynamically as market conditions change and the index rebalances.

Access your complete transaction history within the same dashboard, maintaining a comprehensive record of all purchases, sales, and rebalances. This transparency extends to the index's operational mechanics—you can view the strategy modal explaining the rules governing index behavior, check the gauge showing the current market signal, and review the detailed transactions log showing every rebalance and portfolio adjustment.

Weekly Rebalancing and Regime Switching

Understanding how indices rebalance is crucial to managing expectations. Token Metrics indices rebalance weekly, updating constituent weights and potentially replacing assets to maintain alignment with the index's defined universe. For TM Global 100, this means ensuring the index always holds the current top 100 cryptocurrencies by market capitalization.

Beyond weekly rebalancing, regime switching triggers more dramatic portfolio shifts. When the proprietary market signal indicates bullish conditions, the index holds its full allocation to the top 100 assets. When signals turn bearish, the index moves entirely to stablecoins, aiming to preserve capital during downturns. This switching mechanism enforces disciplined risk management that many individual investors struggle to maintain manually.

These automatic adjustments occur without requiring action on your part. You continue holding your index position while the underlying assets shift according to the predetermined rules. This passive approach to active management represents one of the index's key value propositions.

Benefits Over Manual Trading

Trading indices on Token Metrics offers several advantages over managing individual positions manually. Time savings represent the most obvious benefit—no more tracking 100 individual tickers or executing dozens of small trades to rebalance your portfolio. The weekly rebalancing job runs automatically, freeing you to focus on other aspects of your investment strategy.

Discipline during drawdowns becomes significantly easier when rules govern your portfolio. The stablecoin switch enforces risk management when market signals deteriorate, removing the emotional difficulty of selling during uncertain periods. This systematic approach helps avoid the common pitfall of holding through severe drawdowns out of hope rather than strategy.

Execution efficiency improves dramatically with single-transaction index purchases versus multiple small trades across numerous assets. Each individual trade incurs slippage and fees that compound when building diversified positions manually. The embedded wallet checkout consolidates this into one transaction, reducing total costs and complexity.

Transparency and Security Measures

Token Metrics prioritizes transparency throughout the trading experience. The strategy modal provides complete documentation of the rules governing index behavior, eliminating the "black box" problem common in automated investment products. You always know what you own and why the index makes specific decisions.

Holdings display in multiple formats—treemap for visual allocation understanding and table for detailed constituent information. Every transaction and rebalance appears in the activity log, creating an auditable trail of index operations. This level of disclosure ensures you can verify that the index operates according to its stated rules.

Security measures include the self-custodial wallet architecture, fee and slippage preview before transaction confirmation, and clear documentation of operational mechanics. However, regime logic limitations exist—signals can be incorrect, switching can incur spreads and gas costs, and chain and asset support may vary by jurisdiction.

Who Should Trade Token Metrics Indices

Token Metrics indices suit multiple investor profiles. Hands-off allocators who want broad crypto exposure without micromanaging individual positions find the automated rebalancing and risk management appealing. Active traders can use indices as a disciplined core holding while executing satellite strategies around it.

Existing Token Metrics members and prospects who already consume the platform's research can transform analytical insights into actionable positions through one-click index purchases. Users new to on-chain trading benefit from the embedded wallet and clear fee structures that reduce operational complexity.

Those skeptical of opaque investment products appreciate the full strategy documentation, visible holdings, and comprehensive rebalance logs. The transparency allows verification that the product operates as advertised without mystery algorithms or hidden mechanisms.

Important Considerations

Cryptocurrency remains highly volatile and can lose substantial value rapidly. Past performance does not indicate future results, and even rule-based strategies can underperform during certain market conditions. The information in this guide serves educational purposes and should not be construed as financial advice.

Region-specific restrictions may apply, with chain and asset support varying by wallet and jurisdiction. Before trading, verify that you can access the specific indices and features relevant to your location. Gas fees on certain networks can be substantial, potentially affecting the economics of smaller positions.

Conclusion

Trading indices on Token Metrics streamlines crypto portfolio management by combining broad market exposure, systematic risk management, and operational simplicity. The one-click buying process, transparent holdings and rebalances, and self-custodial security architecture create an accessible yet sophisticated investment vehicle for both newcomers and experienced traders.

By understanding the mechanics of index trading, rebalancing schedules, and the embedded wallet system, you can make informed decisions about incorporating these products into your investment strategy. Whether you're seeking passive exposure to crypto markets or a disciplined core around which to build more active strategies, Token Metrics indices provide the infrastructure to execute efficiently.

Join the waitlist today at tokenmetrics.com/indices to secure early access when new indices launch, and experience how rules-based investing can transform your approach to cryptocurrency markets.

Why Choose Token Metrics for Crypto Indices?

Token Metrics empowers investors with industry-leading research, transparent index tracking, automated risk management, and a secure, self-custodial wallet experience unmatched by other platforms. Explore all indices and tools for smarter crypto investing today.

Frequently Asked Questions

How often are Token Metrics indices rebalanced?

Token Metrics indices are typically rebalanced weekly. The schedule ensures holdings remain aligned with the index's defined rules and criteria, while triggering major portfolio shifts when the regime signal changes.

What fees are involved when trading an index?

All platform and network (gas) fees are disclosed transparently before trade confirmation within the checkout interface. There are no hidden fees. Preview fees and slippage estimates during each transaction for complete clarity.

Can I sell or redeem my index position at any time?

Yes, you can redeem your index holdings at any point via the “My Indices” dashboard. Settlement is typically instant, with proceeds returned to your wallet in supported tokens such as USDC.

Is my crypto safe in the embedded wallet?

The embedded wallet is fully self-custodial, so only you control access and assets. Token Metrics never has direct custody of user funds. Always follow best practices for safeguarding your recovery credentials.

Does regime switching add risk or reduce performance?

Regime switching aims to systematically reduce drawdowns by moving to stablecoins during bearish periods. No strategy can eliminate risk entirely. Review all relevant documentation and understand the mechanics before investing.

Who can use Token Metrics indices?

Indices are available to most international users, but restrictions may apply based on jurisdiction, wallet compatibility, and supported chain/assets. Always verify eligibility before committing funds.

Research

What Are Indices in Forex? A Complete Guide to Currency Indices in 2025

Token Metrics Team
5 min read

When traders discuss indices in forex, they're referring to measurements that track currency strength relative to a basket of other currencies. Unlike stock market indices that track company shares, forex indices measure the relative value of currencies—with the most famous being the U.S. Dollar Index (DXY), which compares the dollar against six major world currencies. Understanding forex indices is crucial for anyone trading currencies, commodities, or global markets, as currency movements ripple through every asset class. In 2025, the concept of indices has evolved beyond traditional forex into cryptocurrency markets, where innovative products like the TM Global 100 apply systematic index strategies with active risk management. This comprehensive guide will explain what indices mean in forex trading, how they're calculated, why they matter for your investments, and how modern index innovations are transforming both currency and crypto markets.

‍→ Join the waitlist to be first to trade TM Global 100.‍

What Are Indices in Forex? The Basic Definition

In forex (foreign exchange) markets, an index measures the strength of one currency against a basket of other currencies. Rather than tracking just one currency pair (like EUR/USD), a forex index provides a broader view of how a currency performs against multiple trading partners simultaneously.

Think of it this way: if you only look at EUR/USD, you see how the dollar performs against the euro. But what about the dollar against the yen, pound, franc, and other currencies? A forex index answers this question by creating a weighted average that captures overall currency strength.

Key characteristics of forex indices:

  • Basket composition: A selected group of currencies to compare against
  • Weighting methodology: How much influence each currency has in the calculation
  • Base period: A starting point set to 100, with movements measured as percentage changes
  • Real-time calculation: Updated continuously during trading hours

Forex indices provide currency traders, international businesses, and investors with quick snapshots of currency momentum and trends that would be difficult to discern by watching dozens of individual pairs.

The U.S. Dollar Index (DXY): The Most Important Forex Index

The U.S. Dollar Index (DXY) stands as the most widely watched forex index globally. Created in 1973 when major currencies began floating freely against the dollar, the DXY measures the dollar's strength against a basket of six major currencies.

DXY Composition and Weights

The Dollar Index includes:

  • Euro (EUR): 57.6% weight
  • Japanese Yen (JPY): 13.6%
  • British Pound (GBP): 11.9%
  • Canadian Dollar (CAD): 9.1%
  • Swedish Krona (SEK): 4.2%
  • Swiss Franc (CHF): 3.6%

The euro's dominant 57.6% weighting means that EUR/USD movements heavily influence the DXY. When the euro weakens against the dollar, the DXY typically rises. When the euro strengthens, the DXY typically falls.

How to Read the DXY

The Dollar Index started at 100 in March 1973. Current values compare to this baseline:

  • DXY at 105: The dollar is 5% stronger than the 1973 baseline
  • DXY at 95: The dollar is 5% weaker than the 1973 baseline

Rising DXY: The dollar is strengthening against the basket. Falling DXY: The dollar is weakening against the basket.

The DXY has ranged from a low near 70 (2008) to highs above 120 (1980s, 2001), reflecting decades of varying dollar strength driven by interest rates, economic growth, inflation, and geopolitical events.

Other Major Forex Indices

While the DXY dominates headlines, several other currency indices track different currencies:

  • Euro Index (EUR_I): Measures euro strength against U.S. Dollar (USD), Japanese Yen (JPY), British Pound (GBP), Swiss Franc (CHF). Provides eurozone perspective on currency strength, important for European traders and businesses.
  • Japanese Yen Index (JPY_I): Tracks yen performance against major trading partners, heavily weighted toward U.S. Dollar (USD), Euro (EUR), British Pound (GBP), Australian Dollar (AUD). Critical for Japanese exporters and global supply chains.
  • British Pound Index (GBP_I): Measures pound strength against a basket including U.S. Dollar (USD), Euro (EUR), Japanese Yen (JPY), Swiss Franc (CHF). The pound's movements gained attention during Brexit periods.

Trade-Weighted Indices

Central banks often calculate their own trade-weighted currency indices based on actual trade volumes with different countries. These

Choose from Platinum, Gold, and Silver packages
Reach with 25–30% open rates and 0.5–1% CTR
Craft your own custom ad—from banners to tailored copy
Perfect for Crypto Exchanges, SaaS Tools, DeFi, and AI Products