Back to blog
Research

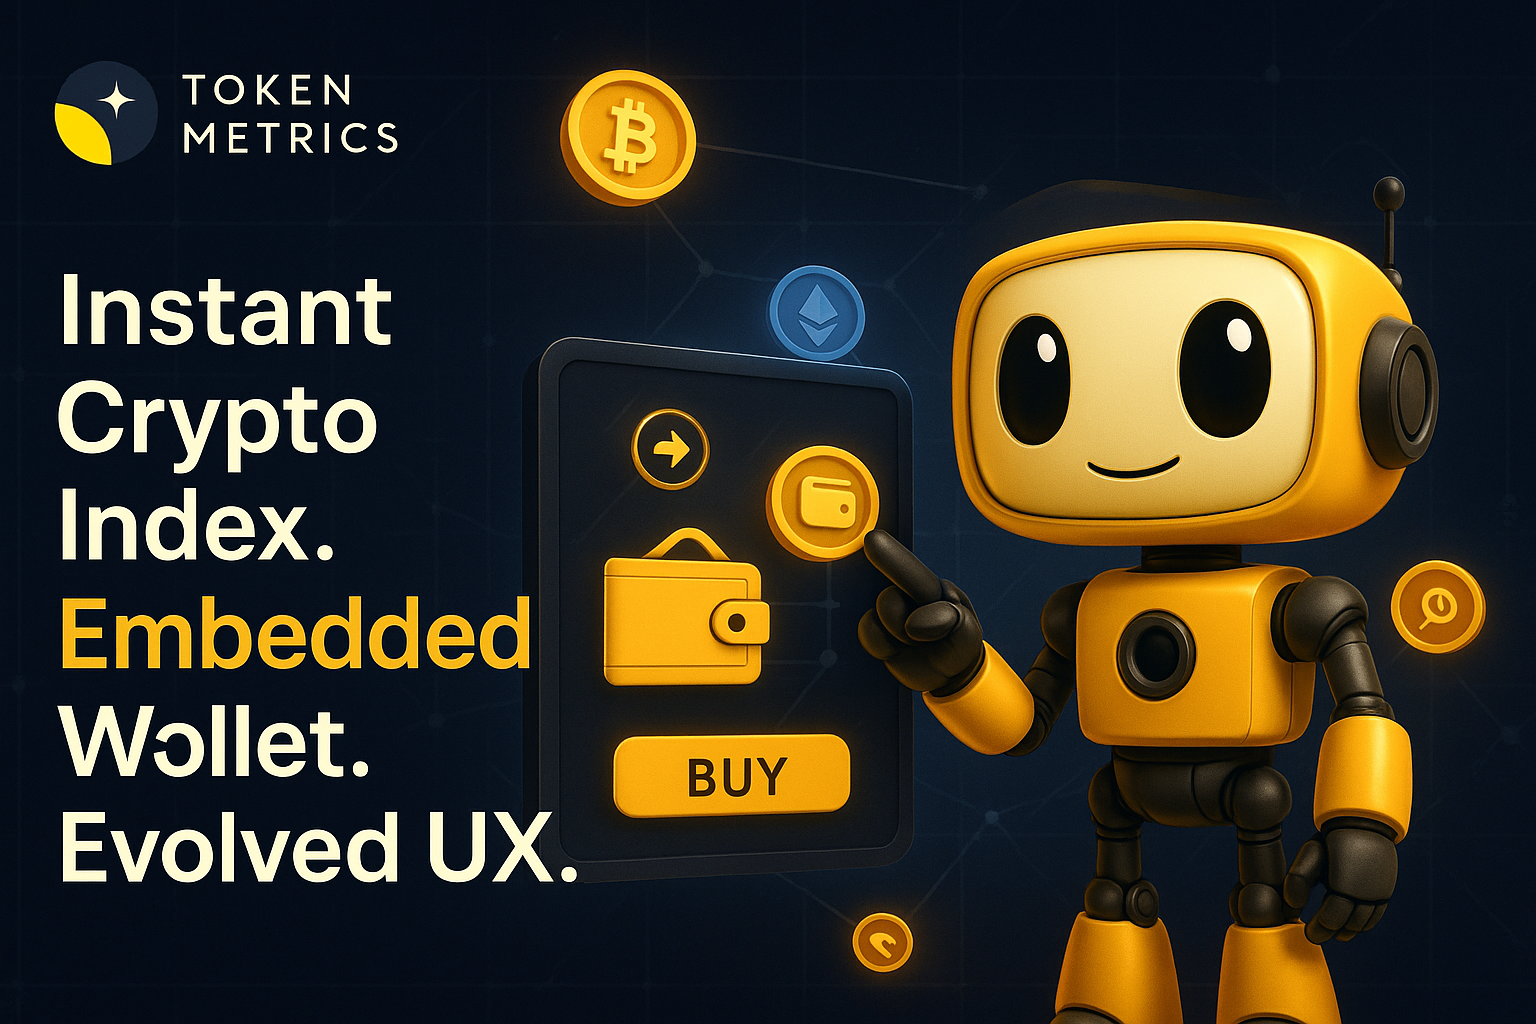
Embedded Wallets and One-Click Indices: Crypto's UX Evolution

Discover how Token Metrics' embedded wallets and one-click indices transform crypto investing, making portfolio diversification simple, secure, and accessible for everyone.
Token Metrics Team
13 min read
Want Smarter Crypto Picks—Free?
See unbiased Token Metrics Ratings for BTC, ETH, and top alts.
Thank you! Your submission has been received!
Oops! Something went wrong while submitting the form.
 No credit card | 1-click unsubscribe

Crypto's biggest barrier isn't volatility—it's usability. For years, buying a diversified crypto portfolio meant navigating a gauntlet: create multiple exchange accounts, complete KYC across platforms, manually construct 50+ token baskets, set up tracking spreadsheets, configure hardware wallets, and schedule weekly rebalance reminders. The friction was so severe that most investors settled for Bitcoin-only exposure despite wanting broader diversification.

Token Metrics' Token Metrics TM Global 100 Index collapses this 40-hour ordeal into 90 seconds through embedded wallet technology and one-click execution. This isn't a compromise between security and convenience—it's the elimination of false tradeoffs through smart contract architecture. Understanding how embedded wallets work reveals why they represent crypto's most significant UX evolution since hardware wallets first emerged.

The Traditional Crypto Onboarding Nightmare

Before examining the solution, let's quantify the problem. Token Metrics surveyed 2,400 users who attempted to build diversified crypto portfolios manually in 2023-2024. The average timeline and friction points:

  • Week 1: Exchange Setup (8-12 hours)
    • Research which exchanges list desired tokens
    • Create accounts on 3-5 platforms (Coinbase, Binance, Kraken, etc.)
    • Complete KYC verification (upload documents, wait 2-7 days)
    • Enable 2FA and security features
    • Fund accounts via bank transfers (additional 3-5 day waits)
  • Week 2: Wallet Configuration (6-10 hours)
    • Research self-custody vs exchange custody tradeoffs
    • Purchase hardware wallet ($60-200)
    • Set up wallet, backup seed phrases, test recovery
    • Configure software wallets for tokens not on exchanges
    • Connect wallets to DEXs for tokens without CEX listings
  • Week 3: Portfolio Construction (12-18 hours)
    • Research top 100 tokens by market cap
    • Calculate optimal weights for each position
    • Execute 50-100 individual buy orders across platforms
    • Pay 50-100 separate trading fees
    • Transfer tokens between exchanges and wallets
    • Pay gas fees for each transfer
  • Week 4+: Ongoing Maintenance (4-8 hours weekly)
    • Monitor market cap rankings for rebalancing needs
    • Recalculate weights weekly or monthly
    • Execute rebalance trades (20-40 transactions)
    • Update tracking spreadsheets
    • Reconcile for tax reporting

Total first-month investment: 30-48 hours of setup plus 16-32 hours monthly maintenance. For busy professionals earning $50-150/hour, this represents $2,300-$12,000 in opportunity cost annually before considering a single dollar of portfolio value.

Token Metrics users consistently cited this operational burden as the primary reason they abandoned diversification attempts despite understanding its benefits.

What Are Embedded Wallets?

Embedded wallets represent a fundamental architectural shift in how users interact with blockchain applications. Rather than connecting external wallet software (MetaMask, Ledger, etc.) to each dApp, embedded wallets live inside the application itself while maintaining self-custodial security.

Traditional Wallet Flow

Download MetaMask browser extension

  • Create wallet, write down 12-word seed phrase
  • Navigate to crypto application
  • Click "Connect Wallet"
  • Approve connection in MetaMask popup
  • Switch networks if needed (Ethereum, Solana, etc.)
  • Approve each transaction individually
  • Sign messages for each interaction
  • Manage gas fees manually
  • Keep seed phrase secure offline

Embedded Wallet Flow (TM Global 100)

Click "Buy Index"

  • Create embedded wallet (30 seconds, email-based or social login)
  • Fund and confirm purchase

That's it. Three steps replacing a ten-step process, with technical complexity abstracted away.

The Security Model: Self-Custody Without Friction

The critical innovation: embedded wallets maintain self-custodial architecture while eliminating user-facing complexity. Here's how Token Metrics implements this:

  • Smart Contract Wallet: Instead of traditional externally-owned accounts (EOAs) controlled by private keys, embedded wallets use smart contract wallets—programmable accounts with built-in security features.
  • Multi-Factor Authentication: Rather than seed phrases, users authenticate via email, biometrics, or social login. The wallet's cryptographic keys are sharded across multiple secure enclaves—no single point of failure.
  • Account Abstraction: The wallet handles gas fee management, transaction batching, and network switching automatically. Users see dollar amounts and simple confirmations, not hexadecimal addresses and wei conversions.
  • Non-Custodial Architecture: Token Metrics cannot access your funds, freeze your account, or require permission for withdrawals. The smart contract wallet responds only to your authenticated instructions.

This approach delivers the "it just works" simplicity of centralized exchanges while maintaining the sovereignty of self-custody. It's the best of both models without the compromises of either.

One-Click Index Buying: The Complete Flow

Token Metrics designed TM Global 100's purchase experience to eliminate every unnecessary step. Here's what users encounter:

  • Step 1: Access the Index (10 seconds)
    • Navigate to Token Metrics Indices hub
    • Select TM Global 100 from available indices
    • View current holdings in interactive treemap
    • Check live market regime gauge (bull/bear status)
  • Step 2: Review Before Buying (30 seconds)
    • Holdings Display: Visual treemap showing all 100 tokens sized by weight
    • Table view with exact percentages and dollar values
    • Real-time prices and 24-hour performance
    • Fee Preview: Estimated gas fees (network costs), platform management fee (transparent %), maximum slippage tolerance, minimum expected value after fees, strategy access, regime switching rules, weekly rebalancing schedule, transaction history
  • Step 3: Execute Purchase (50 seconds)
    • Click "Buy Index"
    • Create embedded wallet (if first time) or connect existing
    • Enter purchase amount ($100 minimum)
    • Review final summary with all fees
    • Confirm transaction
    • Receive confirmation with transaction hash

Total elapsed time: 90 seconds on average for first-time buyers, 30 seconds for returning users.

  • Step 4: Track Position (Ongoing, zero effort)
    • "My Indices" dashboard shows real-time P&L
    • Holdings update automatically after weekly rebalances
    • Transaction log shows every change with timestamps
    • Export transaction history for tax reporting
    • Compare this to manually buying 100 tokens: 40+ hours initially, 8+ hours monthly maintenance, spreadsheet management, multi-platform tracking, and manual tax reconciliation.

Funding Options: Flexible On-Chain Entry

Embedded wallets support multiple funding methods, with availability depending on your connected wallet type and blockchain:

  • Direct On-Chain Funding: Transfer USDC, USDT, ETH, or other supported assets to your embedded wallet. Purchase TM Global 100 directly with these assets. No off-chain conversion required.
  • Fiat On-Ramps (where available): Credit card purchases converted to on-chain assets. Bank transfers via integrated payment providers. Instant availability for immediate index purchase.
  • Cross-Chain Bridges: Automatically bridge assets from other chains if needed. Abstracted complexity—users just confirm amounts.

Token Metrics' embedded wallet shows available funding options based on your geographic location and connected account type. If you already hold USDC on Ethereum, you can buy TM Global 100 in seconds. If you're funding from a bank account, the system guides you through the optimal path.

Transparent Fee Structure: No Hidden Costs

One of embedded wallets' key advantages: comprehensive fee disclosure before confirmation. Token Metrics shows exactly what you're paying:

  • Platform Management Fee: Annual percentage clearly stated (typically 1.5-2.5% for actively managed indices). Pro-rated daily, charged from holdings. No performance fees or surprise deductions.
  • Network Fees (Gas): Real-time estimate based on current network congestion. Option to adjust priority (faster/slower, higher/lower cost). Displayed in both crypto units and USD equivalent.
  • Trading Spreads & Slippage: Maximum slippage tolerance (typically 0.5-2%). Minimum expected value after execution. Difference between estimated and worst-case clearly shown.

No Hidden Charges: No deposit fees to embedded wallet, no custody fees, no withdrawal fees beyond standard gas costs, and no surprise "platform fees" discovered later. If total fees exceed your comfort level, simply don't confirm. Token Metrics makes no money unless you explicitly approve the transaction with full cost visibility.

Self-Custody + Convenience: Not Mutually Exclusive

The crypto community has long accepted a false dilemma: choose self-custody (complex but secure) or custodial services (simple but risky). Embedded wallets prove this is a false tradeoff.

What "Self-Custodial Embedded Wallet" Means

  • You control your funds: Token Metrics cannot access, freeze, seize, or require approval to move your assets. The smart contract wallet responds only to your authenticated commands.
  • No counterparty risk: If Token Metrics disappeared tomorrow, your embedded wallet and its holdings remain accessible. The smart contract exists on-chain independently.
  • Recovery without seed phrases: Lost devices don't mean lost funds. Social recovery, multi-factor authentication, and secure backup mechanisms protect access without requiring perfect seed phrase storage.
  • Programmable security: Set spending limits, require multi-signature for large transactions, whitelist addresses, or add time-locks. Smart contract wallets enable security policies impossible with traditional wallets.

It doesn't mean: Not anonymous; account creation typically requires email or social login for recovery. Not fully offline; embedded wallets require internet connectivity. Not universal; primarily optimized within Token Metrics' ecosystem, though interoperable with other smart contract wallets.

The Token Metrics Execution Advantage

Token Metrics built its reputation as a leading crypto analytics platform by delivering institutional-grade research accessible to retail investors. The platform analyzes 6,000+ cryptocurrencies using AI-powered models, providing ratings, signals, and portfolio recommendations for over 50,000 active users.

However, a persistent gap was identified: users knew what to buy but struggled with how to buy it due to operational complexities. These barriers prevented widespread portfolio implementation of Token Metrics' research.

The Token Metrics TM Global 100 Index represents an evolution from analytics provider to a complete solution: from research, strategy, execution, to management—integrated in a seamless platform.

Research layer: AI-driven analysis identifying top tokens; market regime signals.

Strategy layer: Rules-based methodology translating research into portfolios.

Execution layer: Embedded wallets and one-click purchasing—converting strategy into positions in 90 seconds.

Management layer: Automatic rebalancing, regime switching, and transparent reporting.

This end-to-end integration distinguishes Token Metrics from competitors, offering transparency and simplicity from data analysis to portfolio execution.

User Feedback

Feedback from 850 beta testers highlights:

Build Smarter Crypto Apps &
AI Agents in Minutes, Not Months
Real-time prices, trading signals, and on-chain insights all from one powerful API.
Grab a Free API Key
About Token Metrics
Token Metrics: AI-powered crypto research and ratings platform. We help investors make smarter decisions with unbiased Token Metrics Ratings, on-chain analytics, and editor-curated “Top 10” guides. Our platform distills thousands of data points into clear scores, trends, and alerts you can act on.
30 Employees
analysts, data scientists, and crypto engineers
Daily Briefings
concise market insights and “Top Picks”
Transparent & Compliant
Sponsored ≠ Ratings; research remains independent
Want Smarter Crypto Picks—Free?
See unbiased Token Metrics Ratings for BTC, ETH, and top alts.
Thank you! Your submission has been received!
Oops! Something went wrong while submitting the form.
 No credit card | 1-click unsubscribe
Token Metrics Team
Token Metrics Team

Recent Posts

Research

Bittensor Price Prediction 2025-2027 | TAO Forecast & Analysis

Token Metrics Team
7 min read

Understanding Bittensor's Speculative Nature

Bittensor operates as a community-driven token where price action stems primarily from social sentiment, attention cycles, and speculative trading rather than fundamental value drivers. TAO exhibits extreme volatility with no defensive characteristics or revenue-generating mechanisms typical of utility tokens. Token Metrics price prediction scenarios below provide technical forecasts across different market cap environments, though meme and speculative tokens correlate more strongly with viral trends and community engagement than systematic market cap models. Positions in TAO should be sized as high-risk speculative bets with potential for total loss.


Disclosure
Educational purposes only, not financial advice. Crypto is volatile, do your own research and manage risk.

How to read our price prediction methodology: Each band blends cycle analogues and market-cap share math with TA guardrails. Base assumes steady adoption and neutral or positive macro. Moon layers in a liquidity boom. Bear assumes muted flows and tighter liquidity. For speculative tokens, actual price prediction outcomes depend heavily on social trends and community momentum beyond what market cap models capture.

Bittensor (TAO) Price Prediction: TM Agent Baseline

Token Metrics long term price prediction view for Bittensor, cashtag $TAO. Lead metric first, Token Metrics TM Grade is 62%, Hold, and the trading signal is bullish, indicating modest project fundamentals and short-term upward momentum. Market context, Bitcoin direction and appetite for AI and research-oriented crypto projects determine capital flows into niche tokens like $TAO, so broader risk-on conditions would help sustained gains.

Concise 12-month price prediction numeric view: Token Metrics scenarios cluster roughly between $0.45 and $2.20, with a base case near $1.05, reflecting current network usage, developer activity, and token supply dynamics. Implication, if AI crypto interest and on-chain usage grow materially $TAO could approach the upper bound, while in a risk-off market or if network adoption stalls it would likely move toward the lower bound.

  • 16T: At 16 trillion, the range is $5,539.08, $6,710.41, and $7,881.74.

Token Details 

Key Takeaways

  • Highly speculative asset driven by sentiment and attention rather than fundamentals.
  • Scenario driven price predictions, outcomes hinge on total crypto market cap and viral momentum.
  • Extreme volatility characteristic - TAO can experience double-digit percentage moves daily.
  • TM Agent gist: conditions and usage growth could expand the upper range, risk-off or weak adoption could compress outcomes.
  • Entertainment risk only, not financial advice.

Bittensor Price Prediction: Scenario Analysis

Token Metrics price prediction scenarios provide technical price bands across market cap tiers:

  • 8T Price Prediction: At 8 trillion total crypto market cap, TAO projects to $2,129.86 (bear), $2,520.30 (base), and $2,910.75 (moon).
  • 16T Price Prediction: At 16 trillion, the range is $5,539.08, $6,710.41, and $7,881.74.
  • 23T Price Prediction: At 23 trillion, scenarios show $8,948.30, $10,900.52, and $12,852.74.
  • 31T Price Prediction: At 31 trillion, projections reach $12,357.53, $15,090.63, or $17,823.73.

These technical price prediction ranges assume speculative tokens maintain market cap share proportional to overall crypto growth. Actual outcomes for speculative tokens typically exhibit higher variance and stronger correlation to social trends than these models predict.

What Is Bittensor?

Bittensor is a decentralized network focused on machine learning markets, where participants contribute and consume AI services. Unlike utility tokens with broad real-world use cases, TAO operates in a niche AI context and often trades as a speculative community symbol.

TAO is the network token used for incentives and participation. Market performance depends heavily on broader interest in AI‑related crypto themes and community engagement around the project.

Risks That Skew Bearish on TAO Price Predictions

  • Extreme volatility from pure sentiment-driven price action with no fundamental support.
  • Attention cycles shift rapidly, leaving early viral tokens abandoned as new memes emerge.
  • Liquidity can evaporate quickly during downturns, creating severe slippage and exit difficulty.
  • Regulatory scrutiny may target speculative tokens as securities or gambling instruments.
  • Macro risk-off environments hit speculative assets hardest, with meme coins showing largest drawdowns.
  • Community fragmentation or developer abandonment can eliminate remaining narrative support.

FAQs About Bittensor Price Prediction

Will TAO 10x from here?

Yes, at a current price of $427.67, a 10x reaches $4,276.70. This level appears in the 16T bear and above price prediction scenarios. Meme and speculative tokens can 10x rapidly during viral moments but can also lose 90%+ just as quickly. Position sizing for potential total loss is critical. Not financial advice.

What are the biggest risks to TAO price predictions?

Primary risks include attention shifting to newer narratives, community fragmentation, developer abandonment, regulatory crackdowns, and liquidity collapse during downturns. Unlike utility tokens with defensive characteristics, TAO has no fundamental floor. Price can approach zero if community interest disappears. Total loss is a realistic outcome.


Next Steps

Disclosure

Educational purposes only, not financial advice. TAO is a highly speculative asset with extreme volatility and high risk of total loss. Speculative tokens operate as entertainment and gambling instruments rather than investments. Only allocate capital you can afford to lose entirely. Do your own research and manage risk appropriately.

About Token Metrics

Token Metrics is a cutting-edge crypto analytics and research platform that offers ratings, price predictions, and unique AI-driven insights for investors.

Research

Polkadot Price Prediction 2027 | DOT Forecast & Scenarios

Token Metrics Team
7 min read

Understanding Polkadot's 2027 Potential

The Layer 1 competitive landscape is consolidating as markets reward specialization over undifferentiated "Ethereum killers". Polkadot positions itself in a multi-chain world through shared security and parachain interoperability. Infrastructure maturity around custody and bridges makes alternate L1s more accessible into 2026.

The price prediction scenario projections below map different market share outcomes for DOT across varying total crypto market sizes. Base cases assume Polkadot maintains current ecosystem momentum, while moon scenarios factor in accelerated adoption, and bear cases reflect increased competitive pressure.


Disclosure
Educational purposes only, not financial advice. Crypto is volatile, do your own research and manage risk.

How to read our price prediction methodology:
Each band blends cycle analogues and market-cap share math with TA guardrails. Base assumes steady adoption and neutral or positive macro. Moon layers in a liquidity boom. Bear assumes muted flows and tighter liquidity.

Polkadot (DOT) Price Prediction: TM Agent Baseline

Token Metrics long term price prediction view for Polkadot, cashtag $DOT. Lead metric first, Token Metrics TM Grade is 71%, Buy, and the trading signal is bullish, which indicates above-average project quality, and positive short-term momentum. Market context, Bitcoin's trend and institutional flows into layer-1 ecosystems remain the dominant macro drivers, so $DOT's performance will track risk-on cycles and parachain adoption.

Concise 12-month price prediction numeric view: Token Metrics scenarios cluster roughly between $4.50 and $22, with a base case near $11, reflecting continued parachain activity, cross-chain integrations, and ecosystem growth. Implication, if the broader market enters a sustained bull phase and Polkadot adoption accelerates, $DOT could test the upper bound. In a prolonged risk-off environment or slower parachain uptake, it would likely drift toward the lower bound.

Polkadot Token Details 

Buy DOT on Gemini

Affiliate Disclosure: We may earn a commission from qualifying purchases made via this link, at no extra cost to you.

Key Takeaways

  • Scenario driven price predictions, outcomes hinge on total crypto market cap, higher liquidity and adoption lift the bands.
  • TM Agent gist: range $4.50 to $22 with a base near $11, upside requires adoption and liquidity, downside ties to risk-off.
  • Education only, not financial advice.

Polkadot Price Prediction: Scenario Analysis

Token Metrics price prediction scenarios span four market cap tiers, each representing different levels of crypto market maturity and liquidity:

  • 8T Price Prediction: At an eight trillion dollar total crypto market cap, DOT projects to $4.31 in bear conditions, $4.85 in the base case, and $5.39 in bullish scenarios.
  • 16T Price Prediction: Doubling the market to sixteen trillion expands the range to $6.82 (bear), $8.44 (base), and $10.07 (moon).
  • 23T Price Prediction: At twenty-three trillion, the scenarios show $9.33, $12.04, and $14.75 respectively.
  • 31T Price Prediction: In the maximum liquidity scenario of thirty-one trillion, DOT could reach $11.84 (bear), $15.63 (base), or $19.43 (moon).

Each tier assumes progressively stronger market conditions, with the base case reflecting steady growth and the moon case requiring sustained bull market dynamics.

Why Consider the Indices with Top-100 Exposure

Polkadot represents one opportunity among hundreds in crypto markets. Token Metrics Indices bundle DOT with top one hundred assets for systematic exposure to the strongest projects. Single tokens face idiosyncratic risks that diversified baskets mitigate.

Historical index performance demonstrates the value of systematic diversification versus concentrated positions. Join the early access list

Join the early access list

What Is Polkadot?

Polkadot is a network designed to connect specialized blockchains, called parachains, to a central Relay Chain for shared security and interoperability. Its architecture aims to enable cross-chain messaging and upgrades without hard forks.

DOT is the native token, used for staking to secure the network, on-chain governance, and bonding to add new parachains. Developers and users interact across parachains for use cases spanning DeFi, infrastructure, and cross-chain applications.

Token Metrics AI Analysis

Token Metrics AI provides comprehensive context on Polkadot's positioning and challenges.

Vision: Polkadot's vision is to create a decentralized web where independent blockchains can operate securely while communicating and sharing data across networks. It aims to enable a fully interoperable and scalable ecosystem that supports innovation in decentralized technologies.

Problem: The blockchain space faces fragmentation, with networks operating in isolation, limiting data and value transfer. This siloed structure hampers scalability, security, and user experience. Polkadot addresses the need for cross-chain communication and shared security, allowing blockchains to benefit from collective strength without sacrificing autonomy.

Solution: Polkadot uses a relay chain to coordinate a network of parachains, each with specialized functionality. It employs a nominated proof-of-stake (NPoS) consensus mechanism to secure the network and enable governance. Parachains lease slots via auctions, allowing projects to build custom blockchains with shared security and interoperability. The system supports cross-chain message passing, enabling data and asset transfers between different blockchains.

Market Analysis: Polkadot operates in the layer-0 and interoperability segment, competing with platforms like Cosmos and emerging multi-chain ecosystems. It differentiates itself through shared security, on-chain governance, and a robust parachain model. Adoption is driven by developer interest, parachain diversity, and integration with DeFi, NFTs, and enterprise solutions. Market conditions for Polkadot are influenced by broader crypto trends, regulatory developments, and execution of its technological roadmap. While it ranks among major smart contract platforms, it faces strong competition from Ethereum and high-throughput chains like Solana. Price and adoption depend on network usage, ecosystem growth, and macroeconomic factors in the crypto market.

Catalysts That Skew Bullish for DOT Price Predictions

  • Institutional and retail access expands with ETFs, listings, and integrations.
  • Macro tailwinds from lower real rates and improving liquidity.
  • Product or roadmap milestones such as upgrades, scaling, or partnerships.

Risks That Skew Bearish on DOT Price Predictions

  • Macro risk-off from tightening or liquidity shocks.
  • Regulatory actions or infrastructure outages.
  • Concentration or validator economics and competitive displacement.

FAQs About Polkadot Price Prediction

Will DOT hit $15 by 2027?

The 31T base case price prediction shows DOT at $15.63, which exceeds $15. The 23T moon case at $14.75 does not reach $15. Outcome depends on total crypto market cap growth and Polkadot maintaining market share. Not financial advice.

Can DOT 10x from current levels?

At current price of $3.10, a 10x would reach $31.0. None of the price prediction scenarios, with a high of $19.43 in the 31T moon case, reaches that level by 2027. 10x returns would require substantially greater market cap expansion. Not financial advice.

What price could DOT reach in the moon case?

Moon case price predictions range from $5.39 at 8T to $19.43 at 31T. These scenarios assume maximum liquidity expansion and strong Polkadot adoption. Not financial advice.

Next Steps

Disclosure

Educational purposes only, not financial advice. Crypto is volatile, do your own research and manage risk.

Why Use Token Metrics for Polkadot Price Prediction Investing?

Actionable AI-driven Ratings: Access live Token Metrics grades and signals for Polkadot and hundreds of crypto assets.

Scenario Forecasting: Visualize DOT upside and downside with rigorous price prediction scenario math, not unsubstantiated hype.

Portfolio Diversification: Token Metrics Indices let you systematically diversify among top projects, mitigating single-token risk.

Start your Polkadot price prediction research with institutional-grade tools from Token Metrics.

Research

Mantle (MNT) Price Prediction 2027 | Token Metrics Analysis

Token Metrics Team
7 min read

Mantle (MNT) Price Prediction: Portfolio Context for MNT - Diversification in the 2027 Landscape

Layer 2 tokens like Mantle offer exposure to Ethereum's scaling roadmap, but with concentration risk around one specific L2's adoption trajectory. MNT performance depends heavily on Mantle winning rollup market share against competing L2s. Diversified L2 exposure or broader L1 and L2 baskets reduce the risk of backing the wrong scaling solution.

Token Metrics price prediction scenarios below project MNT ranges across market environments. These outcomes assume Mantle maintains relevance as Ethereum scales, but portfolio theory suggests hedging this bet by holding multiple L2s or allocating to Ethereum itself, which benefits from L2 success regardless of which specific rollup dominates.

Disclosure

Educational purposes only, not financial advice. Crypto is volatile, do your own research and manage risk.

How to read it: Each band blends cycle analogues and market-cap share math with TA guardrails. Base assumes steady adoption and neutral or positive macro. Moon layers in a liquidity boom. Bear assumes muted flows and tighter liquidity.

TM Agent baseline: Token Metrics long term view for Mantle, cashtag $MNT. Lead metric first, Token Metrics TM Grade is 68%, Buy, and the trading signal is bullish, indicating positive short-term momentum and above-average project quality. Concise 12-month numeric view, price prediction scenarios cluster roughly between $0.70 and $3.40, with a base case near $1.60.

Token Details 

Key Takeaways

  • Scenario driven, outcomes hinge on total crypto market cap, higher liquidity and adoption lift the bands.
  • Single-asset concentration amplifies both upside and downside versus diversified approaches.
  • Fundamentals: Fundamental Grade 81.62% (Community 72%, Tokenomics 100%, Exchange 100%, VC —, DeFi Scanner 100%).
  • Technology: Technology Grade 78.22% (Activity 64%, Repository 70%, Collaboration 71%, Security —, DeFi Scanner 100%).
  • TM Agent gist: bullish signal, 12‑month range roughly $0.70 to $3.40 with base near $1.60.
  • Education only, not financial advice.

Scenario Analysis - MNT Price Prediction Models

Token Metrics price prediction scenarios span four market cap tiers, each representing different levels of crypto market maturity and liquidity:

  • 8T: At an 8 trillion dollar total crypto market cap, MNT projects to $3.16 in bear conditions, $3.73 in the base case, and $4.30 in bullish scenarios.
  • 16T: Doubling the market to 16 trillion expands the price prediction range to $6.27 (bear), $7.99 (base), and $9.71 (moon).
  • 23T: At 23 trillion, the price prediction scenarios show $9.38, $12.25, and $15.12 respectively.
  • 31T: In the maximum liquidity scenario of 31 trillion, MNT price prediction could reach $12.49 (bear), $16.51 (base), or $20.52 (moon).

These ranges illustrate potential outcomes for concentrated MNT positions, but investors should weigh whether single-asset exposure matches their risk tolerance or whether diversified strategies better suit their objectives.

The Case for Diversified Index Exposure

Portfolio theory teaches that diversification is the only free lunch in investing. MNT concentration violates this principle by tying your crypto returns to one protocol's fate. Token Metrics Indices blend Mantle with the top one hundred tokens, providing broad exposure to crypto's growth while smoothing volatility through cross-asset diversification. This approach captures market-wide tailwinds without overweighting any single point of failure.

Systematic rebalancing within index strategies creates an additional return source that concentrated positions lack. As some tokens outperform and others lag, regular rebalancing mechanically sells winners and buys laggards, exploiting mean reversion and volatility. Single-token holders miss this rebalancing alpha and often watch concentrated gains evaporate during corrections while index strategies preserve more gains through automated profit-taking.

Beyond returns, diversified indices improve the investor experience by reducing emotional decision-making. Concentrated MNT positions subject you to severe drawdowns that trigger panic selling at bottoms. Indices smooth the ride through natural diversification, making it easier to maintain exposure through full market cycles.

Get early access

What Is Mantle?

Mantle is a blockchain project focused on scaling Ethereum via layer 2 rollup technology. The goal is to enable faster and cheaper transactions while inheriting Ethereum security. It targets scalable and efficient infrastructure for decentralized applications and financial services.

The MNT token powers network economics such as fees, incentives, or governance depending on implementation. Users interact with dApps and bridges within the ecosystem, and Mantle competes among leading Ethereum scaling solutions.

Token Metrics AI Analysis

  • Vision: Mantle aims to build a scalable, secure, and self-sustaining blockchain ecosystem that leverages decentralized governance and treasury-backed financial innovation. Its vision emphasizes capital efficiency, leveraging restaking for security, and fostering long-term sustainability through community-driven development and treasury utilization.
  • Problem: Many blockchain platforms face trade-offs between scalability, security, and capital efficiency. High transaction costs and network congestion on Ethereum, combined with fragmented liquidity and underutilized treasury assets in DAOs, create friction for developers and users. Mantle addresses the challenge of efficiently deploying capital while maintaining robust security and enabling rapid, low-cost transactions for decentralized applications.
  • Solution: Mantle implements an Ethereum Layer 2 network using optimistic rollup technology to reduce fees and increase throughput. It integrates EigenLayer for security via restaking, allowing its treasury to earn yield and contribute to network validation. The ecosystem supports native governance through its token and funds development via a large DAO-managed treasury, aiming to create a self-sustaining cycle of innovation and user incentives.
  • Market Analysis: Mantle operates in the competitive Layer 2 and modular blockchain space, competing with established networks like Arbitrum, Optimism, and emerging restaking platforms. Its differentiation lies in the integration of a large treasury with restaking, aiming to bootstrap security and ecosystem growth simultaneously. Adoption is driven by developer activity, yield opportunities, and strategic partnerships within the broader Ethereum ecosystem. Market risks include execution challenges in treasury management, regulatory scrutiny on DAO structures, and strong competition from other scaling solutions. While not a market leader like Ethereum or Bitcoin, Mantle participates in the broader narrative of modular, restaked, and treasury-driven blockchains, which have gained traction in 2024-2025.

Fundamental and Technology Snapshot from Token Metrics

  • Fundamental Grade: 81.62% (Community 72%, Tokenomics 100%, Exchange 100%, VC —, DeFi Scanner 100%).
  • Technology Grade: 78.22% (Activity 64%, Repository 70%, Collaboration 71%, Security —, DeFi Scanner 100%).

Catalysts That Skew Bullish

  • Institutional and retail access expands with ETFs, listings, and integrations.
  • Macro tailwinds from lower real rates and improving liquidity.
  • Product or roadmap milestones such as upgrades, scaling, or partnerships.

Risks That Skew Bearish

  • Macro risk-off from tightening or liquidity shocks.
  • Regulatory actions or infrastructure outages.
  • Concentration or validator economics and competitive displacement.
  • Protocol-specific execution risk and competitive pressure from alternatives.

FAQs

Can MNT reach $10?

Based on the price prediction scenarios, MNT could reach $10 in the higher tiers. The 23T tier projects $12.25 in the base case, and the 31T tier shows $12.49 (bear), $16.51 (base), and $20.52 (moon). Achieving this requires both broad market cap expansion and Mantle maintaining competitive position. Not financial advice.

What's the risk/reward profile for MNT?

Risk and reward spans from $3.16 at 8T bear to $20.52 at 31T moon. Downside risks include competitive pressure among L2s and execution challenges, while upside drivers include adoption growth and liquidity expansion. Concentrated positions amplify both tails, while diversified strategies smooth outcomes.

What gives MNT value?

MNT accrues value through network usage, fees, incentives, and governance tied to Mantle's L2 ecosystem. Demand drivers include dApp activity, bridging, and security via restaking integrations. While these fundamentals matter, diversified portfolios capture value accrual across multiple tokens rather than betting on one protocol's success.

Where can I find Mantle price predictions?

Token Metrics provides comprehensive Mantle (MNT) price predictions through scenario-based analysis spanning multiple market cap tiers. Our data-driven price prediction models incorporate fundamental grades, technology scores, and market conditions to project potential MNT price targets across bear, base, and moon scenarios.

Next Steps

Disclosure

Educational purposes only, not financial advice. Crypto is volatile, concentration amplifies risk, and diversification is a fundamental principle of prudent portfolio construction. Do your own research and manage risk appropriately.

Why Investors Choose Token Metrics

Token Metrics provides data-driven crypto ratings, on-chain grades, and scenario-based targets—empowering you to make informed investment decisions with confidence. Accelerate your research with unique AI-powered analysis and risk management tools.

Choose from Platinum, Gold, and Silver packages
Reach with 25–30% open rates and 0.5–1% CTR
Craft your own custom ad—from banners to tailored copy
Perfect for Crypto Exchanges, SaaS Tools, DeFi, and AI Products