Back to blog
Token Metrics API

Fast Crypto API: Real-Time Data Without the Lag

Meta Description: "Get the fastest crypto API with sub-second latency, WebSocket streaming, and AI trading signals. Perfect for high-frequency trading bots, DeFi dashboards, and risk management systems. Compare Token Metrics vs competitors.
Sam Monac
9 min
Want Smarter Crypto Picks—Free?
See unbiased Token Metrics Ratings for BTC, ETH, and top alts.
Thank you! Your submission has been received!
Oops! Something went wrong while submitting the form.
 No credit card | 1-click unsubscribe

Why Speed Matters in a Crypto API

In crypto, milliseconds can make or break a trade. Whether you’re building a high-frequency bot, a risk management tool, or a market dashboard, slow crypto APIs lead to:

  • Missed trade opportunities during volatility

  • Bots that lag behind signals

  • Dashboards that feel sluggish

  • Risk models that update too late

📌 Example: In a Bitcoin price swing, even a 500 ms delay can translate to thousands in lost value for trading bots. That’s why developers emphasize low latency when choosing best Crypto APIs.

What Defines a “Fast” Crypto API

Not every Crypto API marketed as “fast” is built the same. A truly fast crypto API provides:

  • Low Latency Feeds – Sub-second updates across major tokens and exchanges.

  • WebSocket Support – Push-based data streams instead of slower polling.

  • Scalable Infrastructure – Resilient under heavy traffic spikes.

  • Global Edge Delivery – Reduced latency for users worldwide.

📌 Tip for builders: Always benchmark an API in real market conditions (during volatility) to see if “fast” performance holds up under stress.

Comparing Fast Crypto APIs: Strengths & Limitations

  • CoinGecko / CoinMarketCap


    • Strengths: Broad token coverage, good for price tickers.

    • Limitations: Refresh cycles can lag; not ideal for bots or real-time dashboards.

  • CryptoCompare


    • Strengths: Strong historical data for research.

    • Limitations: Not optimized for ultra-fast live feeds.

  • Glassnode


    • Strengths: On-chain metrics and blockchain health insights.

    • Limitations: Focused on analytics, not real-time trading data.

  • Token Metrics API


    • Strengths: Sub-second updates, fast bull/bear signals, predictive AI, and on-chain metrics.

    • Limitations: Free tier includes rate limits (higher throughput available via X.402 or paid plans).

Token Metrics API: Fast + Intelligent

What sets Token Metrics API apart is that it’s not just fast data—it’s fast intelligence:

  • Real-Time Prices – Thousands of tokens continuously updated.

  • AI Trading Signals – Bull/bear predictions delivered instantly.

  • On-Chain Metrics – Track wallet flows, liquidity, and token behavior in near real time.

  • Scalable Performance – Built to withstand institutional-grade usage during volatility.

📌 Instead of just reacting to prices, developers can anticipate market shifts with AI-driven signals.

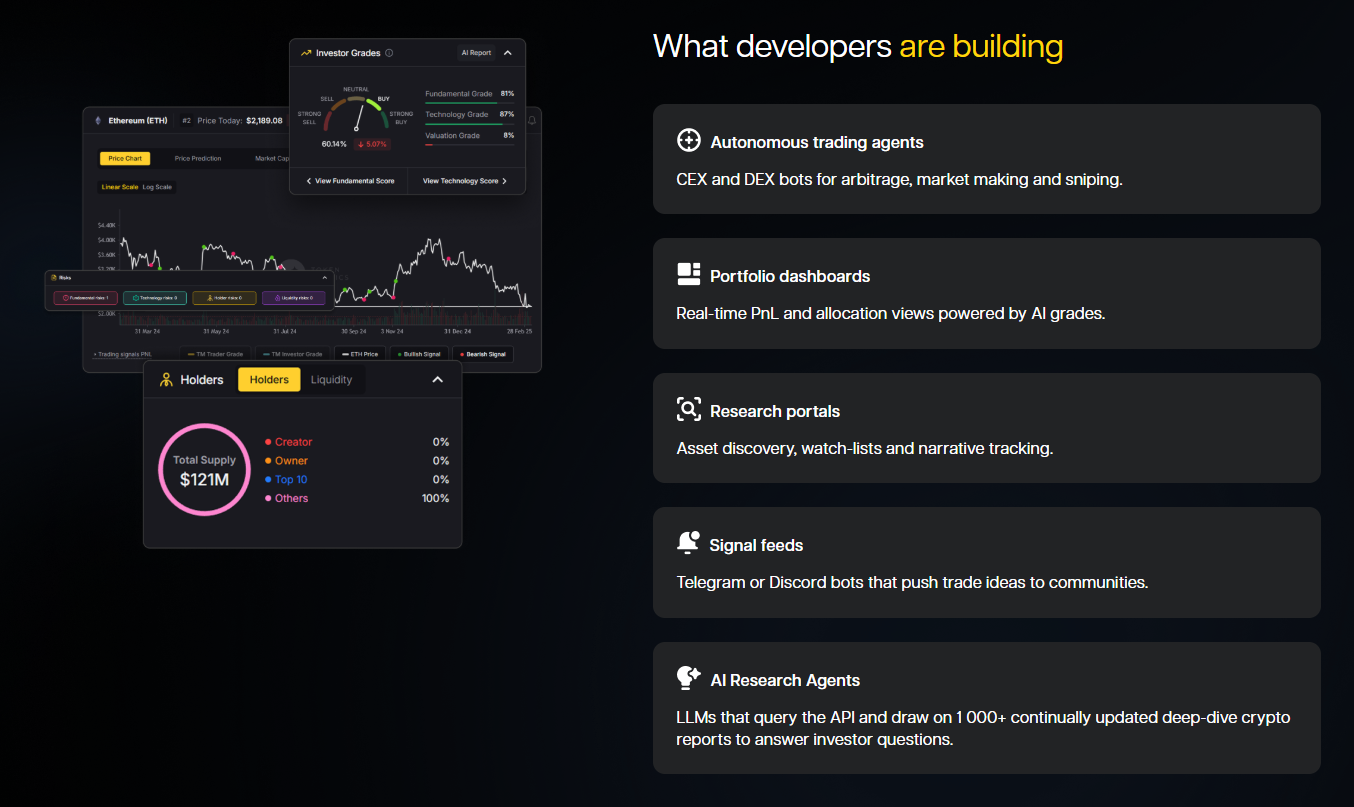
Use Cases: From Trading Bots to AI Agents

  • High-Frequency Trading Bots – Execute strategies using low-latency feeds and predictive signals.

  • DeFi Dashboards – Display liquidity flows and token activity in real time.

  • Risk Management Systems – Keep risk models updated second by second.

  • AI Agents – Power intelligent assistants with actionable streaming data.

Best Practices for Building With Fast APIs

  1. Use WebSockets – Relying only on REST endpoints introduces unnecessary delay.

  2. Benchmark During Volatility – Test APIs when the market is busiest.

  3. Optimize Request Handling – Cache where possible to avoid unnecessary calls.

  4. Monitor Latency – Use observability tools like Grafana or New Relic to track delays.

  5. Failover Strategy – Have a backup API (e.g., CoinGecko) if primary data slows.

Beyond Token Metrics: Other Tools to Explore

Token Metrics API excels at fast data + signals, but developers often combine it with other tools for a full-stack setup:

  • DefiLlama API – Best for free DeFi protocol data and yield metrics.

  • Dune Analytics – Query blockchain data in real time with SQL.

  • TradingView Webhooks – Add instant chart-based triggers for front ends.

  • Kaiko / Amberdata – Enterprise-grade APIs for institutional price feeds.

📌 Pro tip: Use Token Metrics for predictive signals, and pair it with TradingView or DefiLlama for visualization and DeFi-specific data.

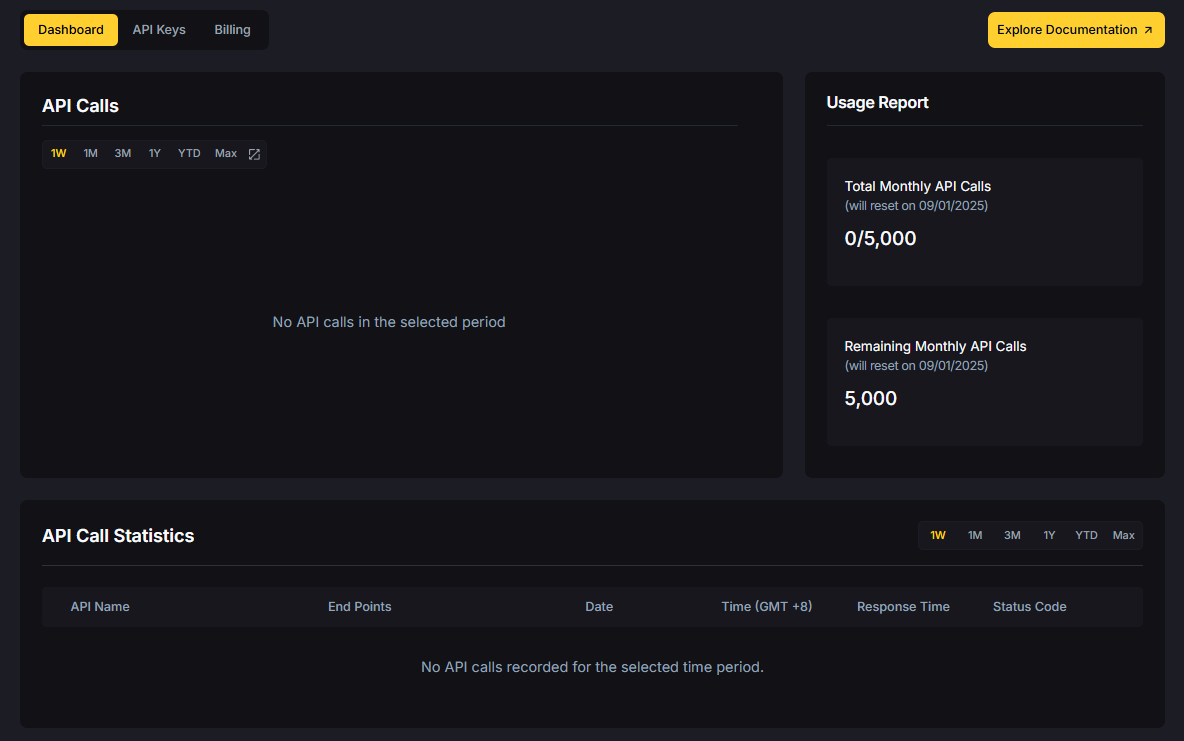
How to Start Using the Token Metrics Fast API

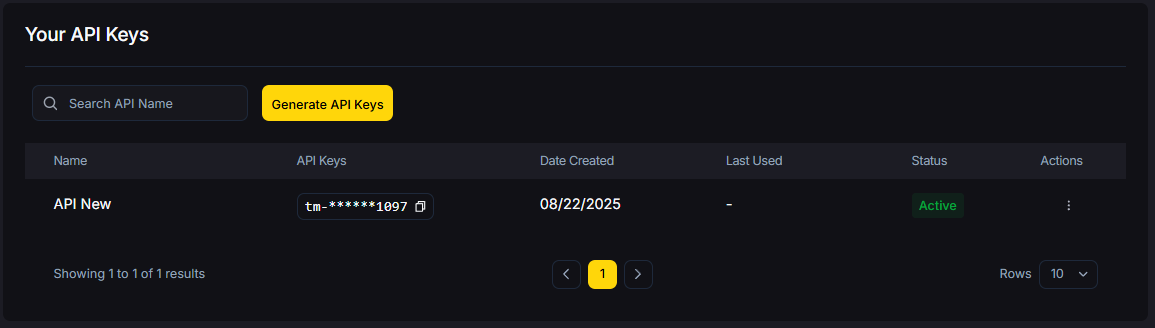
  1. Sign Up Free – Create a Token Metrics account.

  2. Generate Your API Key – Instantly available in your dashboard.

  3. Choose WebSockets or REST – Based on your use case.

  4. Start Building – Bots, dashboards, or risk models with sub-second data.

👉 Get Your Free Token Metrics API Key

Scaling Fast With Paid Plans & X.402

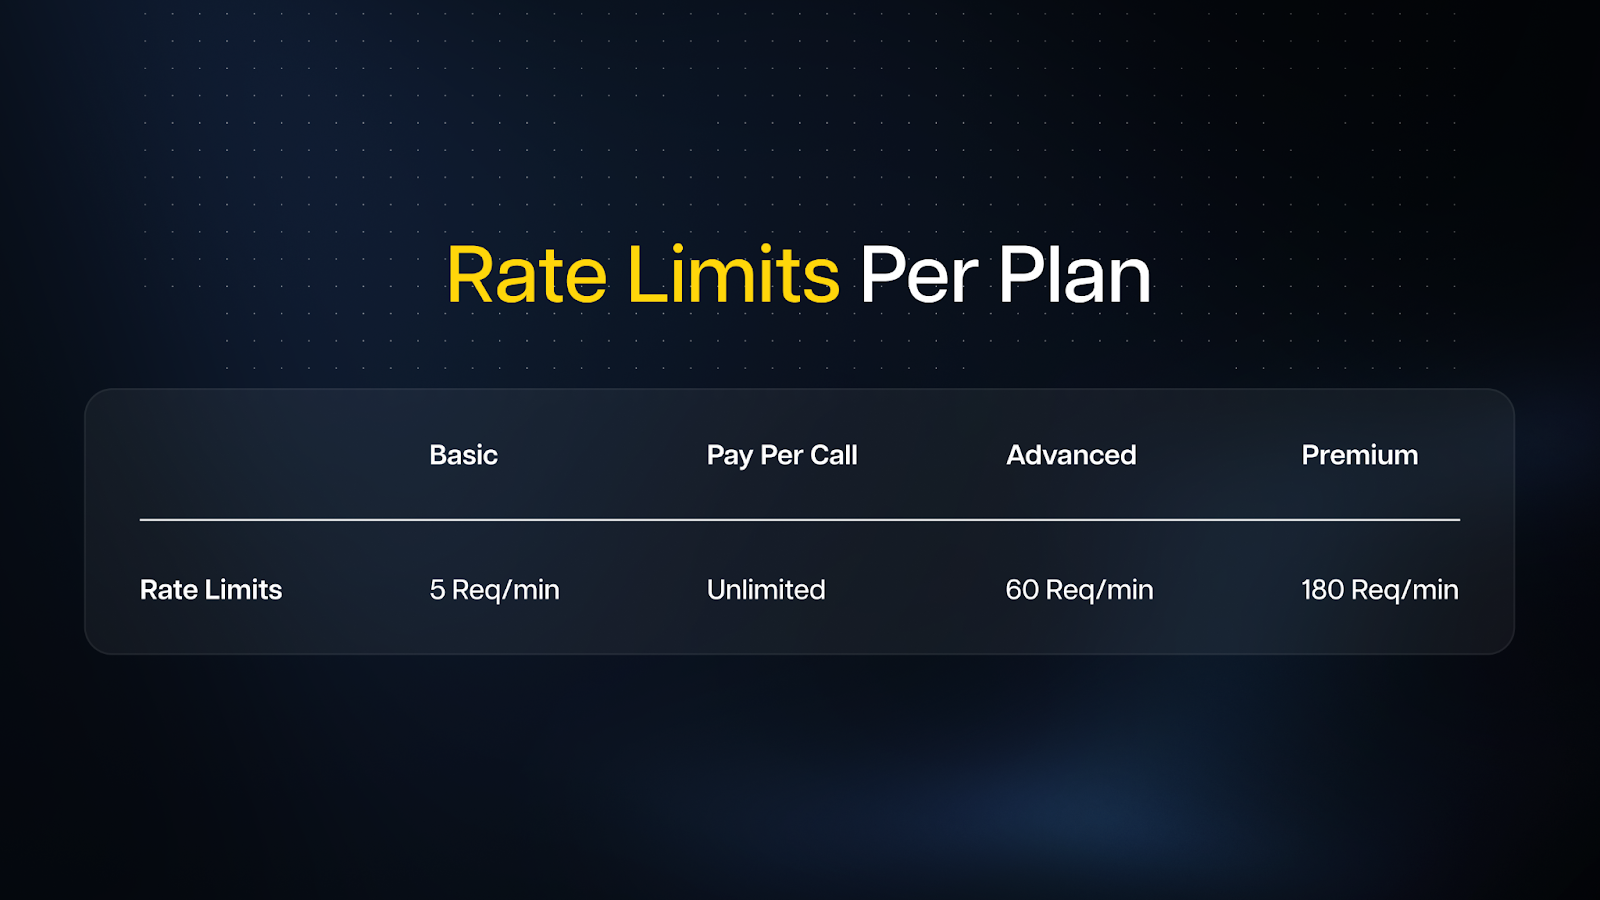
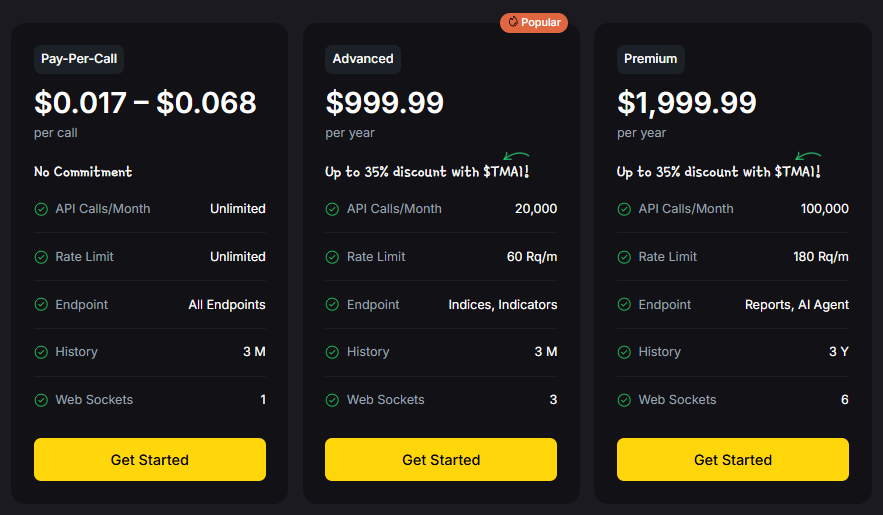
When free limits aren’t enough, Token Metrics offers:

  • Pay-Per-Call (X.402) – From $0.017 per call, unlimited usage, all endpoints, and 3 months of history.

  • Advanced Plan ($999.99/year) – 20,000 calls/month, indices & indicators, 3 WebSockets.

  • Premium Plan ($1,999.99/year) – 100,000 calls/month, AI agent + reports, 3 years of history.

📌 Why X.402 matters: You can start scaling instantly with no upfront cost—just pay per call as you grow.

Build With the Fastest Insights in Crypto

In crypto, speed without intelligence is noise. With Token Metrics Fast Crypto API, you get sub-second price data + AI-driven insights, giving your trading bots, dashboards, and AI agents the real-time edge they need.

👉 Start Free With Token Metrics API

Build Smarter Crypto Apps &
AI Agents in Minutes, Not Months
Real-time prices, trading signals, and on-chain insights all from one powerful API.
Grab a Free API Key
About Token Metrics
Token Metrics: AI-powered crypto research and ratings platform. We help investors make smarter decisions with unbiased Token Metrics Ratings, on-chain analytics, and editor-curated “Top 10” guides. Our platform distills thousands of data points into clear scores, trends, and alerts you can act on.
30 Employees
analysts, data scientists, and crypto engineers
Daily Briefings
concise market insights and “Top Picks”
Transparent & Compliant
Sponsored ≠ Ratings; research remains independent
Want Smarter Crypto Picks—Free?
See unbiased Token Metrics Ratings for BTC, ETH, and top alts.
Thank you! Your submission has been received!
Oops! Something went wrong while submitting the form.
 No credit card | 1-click unsubscribe
Token Metrics Team
Token Metrics Team

Recent Posts

Research

Predicting Toncoin Price in 2027: Scenario Analysis & On-Chain Scores

Token Metrics Team
7 min read

Toncoin Valuation Framework: Market Cap Scenarios

Layer 1 tokens capture value through transaction fees, staking, and validator economics. TON uses proof-of-stake and a multi-blockchain architecture integrated with Telegram services. Token Metrics scenarios model TON outcomes across different total crypto market sizes, reflecting adoption and transaction demand by 2027.


Disclosure

Educational purposes only, not financial advice. Crypto is volatile, do your own research and manage risk.

How to read it: Each band blends cycle analogues and market-cap share math with TA guardrails. Base assumes steady adoption and neutral or positive macro. Moon layers in a liquidity boom. Bear assumes muted flows and tighter liquidity.

TM Agent baseline: Token Metrics TM Grade is 74%, Buy, and the trading signal is bullish, indicating positive short-term momentum and strong overall project quality. Concise 12-month numeric view, scenarios cluster roughly between $5 and $14, with a base case near $9.

Live details: Token Details

Key Takeaways

  • Scenario driven, outcomes hinge on total crypto market cap, higher liquidity and adoption lift the bands.
  • Fundamentals: Fundamental Grade 80.88% (Community 83%, Tokenomics N/A, Exchange 100%, VC 84%, DeFi Scanner 85%).
  • Technology: Technology Grade 77.11% (Activity 55%, Repository 72%, Collaboration 73%, Security N/A, DeFi Scanner 85%).
  • TM Agent gist: bullish signal, ranges cluster around $5 to $14 with a base case near $9.
  • Education only, not financial advice.

Scenario Analysis

8T: At an 8 trillion dollar total crypto market cap, TON projects to $4.36 in bear conditions, $6.28 in the base case, and $8.20 in bullish scenarios.  

16T: At 16 trillion, the range expands to $8.54 (bear), $14.30 (base), and $20.07 (moon).  

23T: The 23 trillion tier shows $12.72, $22.33, and $31.94 respectively.  

31T: In the maximum liquidity scenario at 31 trillion, TON reaches $16.89 (bear), $30.35 (base), or $43.80 (moon).  

What Is Toncoin?

The Open Network is a blockchain designed to support fast, low-cost transactions and a scalable ecosystem of decentralized applications. It integrates with digital services and messaging platforms to reach a broad user base, emphasizing high throughput and accessibility.

TON uses a proof-of-stake consensus mechanism with a multi-blockchain architecture. The TON token powers network activity, facilitating transactions, staking, and governance, and is integrated into Telegram-based services for user-friendly in-app payments and wallets.

Token Metrics AI Analysis

Token Metrics AI provides additional context on Toncoin's technical positioning and market dynamics.

Vision: The vision for Toncoin and The Open Network is to create a fast, secure, and scalable blockchain that enables seamless digital transactions and decentralized services, accessible to millions through integration with everyday communication tools like Telegram.

Problem: Many blockchain networks face limitations in speed, cost, and user accessibility, hindering mainstream adoption. Toncoin aims to address the friction of slow transaction times and high fees seen on older networks, while also lowering the barrier to entry for non-technical users who want to engage with decentralized applications and digital assets.

Solution: TON uses a proof-of-stake consensus mechanism with a multi-blockchain architecture to achieve high scalability and fast finality. The network supports smart contracts, decentralized storage, and domain naming, enabling a wide range of applications. Toncoin facilitates transactions, staking, and network governance, and is integrated into Telegram-based services, allowing for in-app payments and wallet functionality through user-friendly interfaces.

Market Analysis: Toncoin operates in the competitive layer-1 blockchain space, often compared to high-performance networks like Solana and Avalanche, though it differentiates itself through deep integration with Telegram's ecosystem. Its potential for mass adoption stems from access to hundreds of millions of Telegram users, which could drive network effects and utility usage. Unlike meme tokens, Toncoin's value is tied to infrastructure and real-world application rather than speculation or community hype. However, its growth depends on sustained development, regulatory clarity, and actual user engagement within Telegram. Competition from established blockchains and shifting market narratives around scalability and decentralization remain key risks. As a top-tier blockchain by ecosystem potential, Toncoin's market position is influenced more by integration milestones and user adoption than direct price dynamics.

Fundamental and Technology Snapshot from Token Metrics

Fundamental Grade: 80.88% (Community 83%, Tokenomics N/A, Exchange 100%, VC 84%, DeFi Scanner 85%).  

Technology Grade: 77.11% (Activity 55%, Repository 72%, Collaboration 73%, Security N/A, DeFi Scanner 85%).  

Catalysts That Skew Bullish

  • Institutional and retail access expands with ETFs, listings, and integrations.
  • Macro tailwinds from lower real rates and improving liquidity.
  • Product or roadmap milestones such as upgrades, scaling, or partnerships.

Risks That Skew Bearish

  • Macro risk-off from tightening or liquidity shocks.
  • Regulatory actions or infrastructure outages.
  • Concentration or validator economics and competitive displacement.

FAQs

How does TON accrue value?

Value accrual mechanisms include transaction fees, validator staking rewards, and governance alignment described for TON in the documentation. As Toncoin usage grows through transactions and user activity, TON can capture network fees and staking yields while coordinating governance. Effectiveness depends on sustained adoption and network throughput.

What price could TON reach in the moon case?

Moon case projections range from $8.20 at 8T to $43.80 at 31T. These scenarios require maximum market cap expansion and strong network adoption with robust liquidity conditions. Not financial advice.  

Next Steps

Track live grades and signals: Token Details

Secure your TON with Ledger

Disclosure

Educational purposes only, not financial advice. Crypto is volatile, do your own research and manage risk.

How Token Metrics Can Help

Token Metrics combines fundamental, technical, and on-chain AI-powered analysis for actionable ratings, signals, and research. Use our data platform for scenario-based investing, backtested grades, and bespoke insights for digital asset markets.

Research

Cronos Long-Term Price Prediction: 2027 Targets & Token Metrics Analysis

Token Metrics Team
9 min read

Portfolio Context for Cronos: Diversification in the 2027 Landscape

Layer 1 tokens like Cronos represent bets on specific blockchain architectures winning developer and user mindshare. CRO carries both systematic crypto risk and unsystematic risk from Cronos's technical roadmap execution and ecosystem growth. Multi-chain thesis suggests diversifying across several L1s rather than concentrating in one, since predicting which chains will dominate remains difficult.

The projections below show how CRO might perform under different market cap scenarios. While Cronos may have strong fundamentals, prudent portfolio construction balances L1 exposure across Ethereum, competing smart contract platforms, and Bitcoin to capture the sector without overexposure to any single chain's fate.


Disclosure

Educational purposes only, not financial advice. Crypto is volatile, do your own research and manage risk.

How to read it: Each band blends cycle analogues and market-cap share math with TA guardrails. Base assumes steady adoption and neutral or positive macro. Moon layers in a liquidity boom. Bear assumes muted flows and tighter liquidity.

TM Agent baseline: Token Metrics scenarios center roughly between $0.03 and $0.28, with a base case near $0.10, assuming steady ecosystem growth, continued cross-chain demand, and no major security incidents.

Live details: Token Details 

The Case for Diversified Index Exposure

Portfolio theory teaches that diversification is the only free lunch in investing. CRO concentration violates this principle by tying your crypto returns to one protocol's fate. Token Metrics Indices blend Cronos with the top one hundred tokens, providing broad exposure to crypto's growth while smoothing volatility through cross-asset diversification. This approach captures market-wide tailwinds without overweighting any single point of failure.

Systematic rebalancing within index strategies creates an additional return source that concentrated positions lack. As some tokens outperform and others lag, regular rebalancing mechanically sells winners and buys laggards, exploiting mean reversion and volatility. Single-token holders miss this rebalancing alpha and often watch concentrated gains evaporate during corrections while index strategies preserve more gains through automated profit-taking.

Beyond returns, diversified indices improve the investor experience by reducing emotional decision-making. Concentrated CRO positions subject you to severe drawdowns that trigger panic selling at bottoms. Indices smooth the ride through natural diversification, making it easier to maintain exposure through full market cycles.

Get early access

What Is Cronos?

Cronos is an EVM-compatible blockchain built to support decentralized applications with high throughput and low transaction costs. The network is designed to bridge the gap between crypto and traditional finance, offering interoperability with Ethereum and Cosmos ecosystems. Its focus on scalability and developer-friendly infrastructure aims to attract DeFi, NFT, and gaming projects.

CRO serves as the native utility token of the Cronos ecosystem, used for transaction fees, staking, and governance. It enables users to participate in network security, pay for smart contract execution, and access services within the Cronos DeFi ecosystem. Common usage patterns include staking for rewards, providing liquidity in DeFi protocols, and facilitating cross-chain transfers.

Key Takeaways

  • Scenario driven, outcomes hinge on total crypto market cap, higher liquidity and adoption lift the bands.
  • Single-asset concentration amplifies both upside and downside versus diversified approaches.
  • Fundamentals: Fundamental Grade 72.71% (Community 55%, Tokenomics 60%, Exchange 100%, VC N/A, DeFi Scanner 83%).
  • Technology: Technology Grade 81.41% (Activity 64%, Repository 74%, Collaboration 82%, Security N/A, DeFi Scanner 83%).
  • TM Agent gist: Base near $0.10 amid steady growth.
  • Education only, not financial advice.

Scenario Analysis

At an 8 trillion dollar total crypto market cap, CRO projects to $0.14 in bear conditions, $0.29 in the base case, and $0.34 in bullish scenarios.  

Doubling the market to 16 trillion expands the range to $0.43 (bear), $0.57 (base), and $0.71 (moon).  

At 23 trillion, the scenarios show $0.62, $0.85, and $1.09 respectively.  

In the maximum liquidity scenario of 31 trillion, CRO could reach $0.81 (bear), $1.13 (base), or $1.46 (moon).  

These ranges illustrate potential outcomes for concentrated CRO positions, but investors should weigh whether single-asset exposure matches their risk tolerance or whether diversified strategies better suit their objectives.

Fundamental and Technology Snapshot from Token Metrics

Fundamental Grade: 72.71% (Community 55%, Tokenomics 60%, Exchange 100%, VC N/A, DeFi Scanner 83%).  

Technology Grade: 81.41% (Activity 64%, Repository 74%, Collaboration 82%, Security N/A, DeFi Scanner 83%).  

Catalysts That Skew Bullish

  • Institutional and retail access expands with ETFs, listings, and integrations.
  • Macro tailwinds from lower real rates and improving liquidity.
  • Product or roadmap milestones such as upgrades, scaling, or partnerships.

Risks That Skew Bearish

  • Macro risk-off from tightening or liquidity shocks.
  • Regulatory actions or infrastructure outages.
  • Concentration or validator economics and competitive displacement.
  • Protocol-specific execution risk and competitive pressure from alternatives.

FAQs

Can CRO reach $1?

Based on the scenarios, CRO could reach $1 in the 23T moon case where it projects to $1.09, and in the 31T scenarios where the base case is $1.13 and the moon case is $1.46. These outcomes require both broad market cap expansion and Cronos maintaining competitive position. Not financial advice.

What's the risk/reward profile for CRO?

Risk/reward spans from $0.14 in the lowest bear case to $1.46 in the highest moon case. Downside risks include regulatory or infrastructure shocks and competitive displacement, while upside drivers include liquidity expansion and roadmap execution. Concentrated positions amplify both tails, while diversified strategies smooth outcomes.

What gives CRO value?

CRO accrues value through transaction fees, staking, and governance utility across the Cronos ecosystem. Demand drivers include DeFi activity, cross-chain usage, and network services. While these fundamentals matter, diversified portfolios capture value accrual across multiple tokens rather than betting on one protocol's success.  

Next Steps

Disclosure
Educational purposes only, not financial advice. Crypto is volatile, concentration amplifies risk, and diversification is a fundamental principle of prudent portfolio construction. Do your own research and manage risk appropriately.

Research

How High Can Shiba Inu Go by 2027? Scenario-Based Forecast

Token Metrics Team
6 min read

Understanding Shiba Inu's Speculative Nature

Shiba Inu operates as a community-driven meme token where price action stems primarily from social sentiment, attention cycles, and speculative trading rather than fundamental value drivers. SHIB exhibits extreme volatility with no defensive characteristics or revenue-generating mechanisms typical of utility tokens. Token Metrics scenarios below provide technical Price Predictions across different market cap environments, though meme tokens correlate more strongly with viral trends and community engagement than systematic market cap models. Positions in SHIB should be sized as high-risk speculative bets with potential for total loss.


Disclosure

Educational purposes only, not financial advice. Crypto is volatile, do your own research and manage risk.

How to read it: Each band blends cycle analogues and market-cap share math with TA guardrails. Base assumes steady adoption and neutral or positive macro. Moon layers in a liquidity boom. Bear assumes muted flows and tighter liquidity. For meme tokens, actual outcomes depend heavily on social trends and community momentum beyond what market cap models capture.

TM Agent baseline: Token Metrics TM Grade is 24.1%, Sell, with a bearish trading signal. The concise 12‑month numeric view centers between

TM Agent numeric view: scenarios center roughly between $0.000005 and $0.000035, with a base case near $0.000012.

Live details: Token Details 

Key Takeaways

  • Highly speculative asset driven by sentiment and attention rather than fundamentals.
  • Scenario driven, outcomes hinge on total crypto market cap and viral momentum.
  • Extreme volatility characteristic - SHIB can experience double-digit percentage moves daily.
  • TM Agent gist: Bearish short term, $0.000005–$0.000035 range.
  • Entertainment risk only, not financial advice.

Scenario Analysis

Token Metrics scenarios provide technical price bands across market cap tiers:

8T: At 8 trillion total crypto market cap, SHIB projects to $0.041998 (bear), $0.042366 (base), and $0.042734 (moon).  

16T: At 16 trillion total crypto market cap, SHIB projects to $0.043973 (bear), $0.045077 (base), and $0.046182 (moon).  

23T: At 23 trillion total crypto market cap, SHIB projects to $0.045948 (bear), $0.047789 (base), and $0.049629 (moon).  

31T: At 31 trillion total crypto market cap, SHIB projects to $0.047923 (bear), $0.051050 (base), and $0.051307 (moon).  

These technical ranges assume meme tokens maintain market cap share proportional to overall crypto growth. Actual outcomes for speculative tokens typically exhibit higher variance and stronger correlation to social trends than these models predict.

What Is Shiba Inu?

Shiba Inu is a meme-born crypto project that centers on community and speculative culture. Unlike utility tokens with specific use cases, SHIB operates primarily as a speculative asset and community symbol. The project focuses on community engagement and entertainment value.

SHIB has demonstrated viral moments and community loyalty within the broader meme token category. The token trades on community sentiment and attention cycles more than fundamentals. Market performance depends heavily on social media attention and broader meme coin cycles.

Risks That Skew Bearish

  • Extreme volatility from pure sentiment-driven price action with no fundamental support.
  • Attention cycles shift rapidly, leaving early viral tokens abandoned as new memes emerge.
  • Liquidity can evaporate quickly during downturns, creating severe slippage and exit difficulty.
  • Regulatory scrutiny may target meme tokens as securities or gambling instruments.
  • Macro risk-off environments hit speculative assets hardest, with meme coins showing largest drawdowns.
  • Community fragmentation or developer abandonment can eliminate remaining narrative support.

Make Your Next Move with Token Metrics

Token Metrics provides technical analysis, scenario math, and rigorous risk evaluation for hundreds of crypto tokens. Want to dig deeper? Explore our powerful AI-powered ratings and scenario tools here.

FAQs

Will SHIB 10x from here?

Answer: At current price of $0.041027, a 10x reaches $0.41027. This level does not appear in any of the listed bear, base, or moon scenarios across 8T, 16T, 23T, or 31T tiers. Meme tokens can 10x rapidly during viral moments but can also lose 90%+ just as quickly. Position sizing for potential total loss is critical. Not financial advice.

What are the biggest risks to SHIB?

Answer: Primary risks include attention shifting to newer memes, community fragmentation, developer abandonment, regulatory crackdowns, and liquidity collapse during downturns. Unlike utility tokens with defensive characteristics, SHIB has zero fundamental floor. Price can approach zero if community interest disappears. Total loss is a realistic outcome. Not financial advice.  

Next Steps

Disclosure

Educational purposes only, not financial advice. SHIB is a highly speculative asset with extreme volatility and high risk of total loss. Meme tokens operate as entertainment and gambling instruments rather than investments. Only allocate capital you can afford to lose entirely. Do your own research and manage risk appropriately.

Choose from Platinum, Gold, and Silver packages
Reach with 25–30% open rates and 0.5–1% CTR
Craft your own custom ad—from banners to tailored copy
Perfect for Crypto Exchanges, SaaS Tools, DeFi, and AI Products