


Fundamental Grade Crypto API: Invest with Conviction Using Real Project Signals
%201.svg)
%201.svg)


Most traders chase price action; Fundamental Grade Crypto API helps you see the business behind the token—community traction, tokenomics design, exchange presence, VC signals, and DeFi health—consolidated into one score you can query in code. In a few minutes, you’ll fetch Fundamental Grade, render it in your product, and ship a due-diligence UX that drives trust. Start by grabbing your key at the Get API Key page, Run Hello-TM to verify your first call, then Clone a Template to go live fast.
What You’ll Build in 2 Minutes
A minimal script to fetch Fundamental Grade from /v2/fundamental-grade for any symbol (e.g., BTC).
- Optional curl to smoke-test your key in seconds.
- A drop-in pattern to display the grade + key drivers in dashboards, screeners, and research tools.
Endpoints to consider next:
- /v2/tm-grade (technical/sentiment/momentum)
- /v2/price-prediction (scenario planning)
- /v2/resistance-support (risk levels)
- /v2/quantmetrics (risk/return stats)
Why This Matters
Beyond price, toward quality. Markets are noisy—hype rises and fades. Fundamental Grade consolidates hard-to-track signals (community growth, token distribution, liquidity venues, investor quality, DeFi integrations) into a clear, comparable score. You get a fast “is this worth time and capital?” answer for screening, allocation, and monitoring.
Build trust into your product. Whether you run an investor terminal, exchange research tab, or a portfolio tool, Fundamental Grade lets users justify positions. Pair it with TM Grade or Quantmetrics for a balanced picture: what to buy (fundamentals) and when to act (signals/levels).
Where to Find The Fundamental Grade
The Fundamental Grade is easily accessible in the top right of the API Reference. Grab the cURL request for seamless access!
Build Smarter Crypto Apps & AI Agents with Token Metrics
Token Metrics provides real-time prices, trading signals, and on-chain insights all from one powerful API. Grab a Free API Key
How It Works (Under the Hood)
Fundamental Grade aggregates multiple project-quality signals into a normalized score and label (e.g., Strong / Average / Weak). Typical sub-signals include:
- Community: momentum across channels (dev activity/user traction signals where applicable).
- Tokenomics: supply schedule, distribution, unlock dynamics, incentives.
- Exchange Presence: venue coverage, depth/liquidity proxies.
- VC/Investor Signals: quality/durability of backing and ecosystem support.
- DeFi Health: integrations, TVL context, composability footprint.
At query time, you call /v2/fundamental-grade with a symbol; responses include the overall score plus component scores you can visualize. For dashboards with many assets, batch fetches and short-TTL caching keep pages responsive. If you push alerts (e.g., “Fundamental Grade upgraded”), prefer webhooks or queued jobs to avoid hammering the API.
Production Checklist
- Rate limits: Know plan caps; add client throttling and request queues.
- Retries/backoff: Exponential backoff + jitter; surface actionable error messages.
- Idempotency: Prevent duplicate downstream actions on retried calls.
- Caching: Use memory/Redis/KV with short TTLs; pre-warm popular symbols.
- Webhooks & jobs: For alerts, use signed webhooks or scheduled jobs; log delivery outcomes.
- Pagination/Bulk: When covering many tokens, paginate or process in batches.
- Error catalog: Map 4xx/5xx to user-visible fixes; log request IDs.
- Observability: Track p95/p99 and error rate per endpoint; alert on spikes.
- Security: Keep API keys in secrets managers; rotate regularly.
Use Cases & Patterns
- Screener Maker: Rank tokens by Fundamental Grade, filter by market cap/sector, and add “rising fundamentals” badges for discovery.
- Dashboard Builder: On each token page, show the headline grade with a component chart; link to methodology for transparency.
- Research & PM Tools: Flag downgrades/upgrades to prompt re-evaluation; attach notes to component changes (e.g., DeFi health drop).
- Allocator / Risk: Require a minimum Fundamental Grade before inclusion; rebalance only when grade crosses thresholds.
- Community/Discord: Post weekly upgrades as digest messages with links back to your app.
Next Steps
- Get API Key — generate a key and start free.
- Run Hello-TM — verify your first successful call.
- Clone a Template — deploy a screener or token page today.
- Watch the demo: VIDEO_URL_HERE
- Compare plans: Scale confidently with API plans.
FAQs
1) What does the Fundamental Grade API return?
A JSON payload with the overall score/grade plus component scores (e.g., community, tokenomics, exchange presence, VC backing, DeFi health) and timestamps. Use the overall grade for ranking and component scores for explanations.
2) How fast is the endpoint? Do you publish SLOs?
The API is engineered for predictable latency. For high-traffic dashboards, add short-TTL caching and batch requests; for alerts, use jobs/webhooks to minimize round-trips.
3) Can I combine Fundamental Grade with TM Grade or signals?
Yes. A common pattern is Fundamental Grade for quality filter + TM Grade for technical/sentiment context + Trading Signals for timing and Support/Resistance for risk placement.
4) How “accurate” is the grade?
It’s an opinionated synthesis of multiple inputs—not financial advice. Historical studies can inform usage, but past performance doesn’t guarantee future results. Always layer risk management and testing.
5) Do you offer SDKs and examples?
You can use REST directly (see JS/Python above). The docs include quickstarts, Postman, and ready-to-clone templates—start with Run Hello-TM.
AI Agents in Minutes, Not Months

.svg)


%201.svg)
Create Your Free Token Metrics Account


.png)
Recent Posts
Best Yield Marketplaces for Real-World Assets (RWAs) in 2025
- What this guide covers: A comprehensive evaluation of 10 leading platforms that enable tokenized real-world asset trading and yield generation across private credit, treasuries, real estate, and structured finance
- Quick verdict: Ondo Finance for institutional-grade treasury exposure at ~5% APY, Maple Finance for crypto-collateralized credit facilities delivering 9-12% net yields, Goldfinch Prime for diversified access to private credit funds from Apollo and Ares
- One key limitation to know: Many RWA platforms enforce strict accreditation requirements (minimum $50K-200K) and geographic restrictions, particularly excluding US investors from certain products due to securities regulations
Why Yield Marketplaces for RWAs Matter in January 2025
The real-world asset tokenization market has experienced explosive growth, surging from $85 million in April 2020 to over $25 billion by mid-2025—representing a staggering 245-fold increase driven primarily by institutional demand for yield, transparency, and regulatory clarity. Private credit dominates at approximately 61% of total tokenized assets, followed by treasuries at 30%, with major asset managers like BlackRock, Apollo, and Franklin Templeton now actively tokenizing institutional-grade products.
The convergence of traditional finance and decentralized infrastructure has created unprecedented opportunities for investors seeking stable, real-world yields without exposure to cryptocurrency volatility. The tokenized RWA market is projected to reach between $9.43 trillion and $18.9 trillion by 2030, with regulatory frameworks in Singapore, Hong Kong, and Dubai providing clear pathways for compliant innovation.
For crypto-native investors, RWA yield marketplaces offer a critical bridge to sustainable income streams backed by productive assets rather than purely speculative token emissions. Traditional allocators gain 24/7 access to fractional ownership, instant settlement, and programmable compliance—advantages impossible in legacy financial infrastructure.
How We Evaluated These Providers
We assessed platforms across six weighted criteria totaling 100 points:
- Yield Quality & Sustainability (30%): Consistency of returns, asset backing, historical performance, and correlation to traditional markets
- Security & Risk Management (25%): Custody solutions, audit history, legal recourse, collateralization ratios, and default handling protocols
- Asset Coverage & Diversity (15%): Range of underlying assets, tranching options, and exposure across credit curves
- Accessibility & Costs (15%): Minimum investments, fee structures, geographic availability, and KYC requirements
- Liquidity & Redemption (10%): Secondary market depth, withdrawal timelines, and tokenization standards
- Infrastructure & Compliance (5%): Regulatory licenses, blockchain integrations, and institutional partnerships
Data sources: Official platform documentation, on-chain analytics from RWA.xyz and DeFiLlama, third-party audits, and regulatory filings. Research conducted October 2024-January 2025.
Verification approach: Every fee structure, yield figure, and regional restriction cited was verified on official platform pages or regulatory disclosures. Unverifiable claims were excluded.
The Contenders: Quick Comparison
Provider Reviews by Use Case
For Treasury-Backed Stability (4-5% Yield)
Top Pick: Ondo Finance — Institutional Treasury Tokenization PioneerOverview
Ondo Finance manages over $1.6 billion in tokenized assets, offering institutional-grade access to US Treasury exposure through OUSG (backed by BlackRock's BUIDL fund) and USDY (a yield-bearing stablecoin). The platform bridges TradFi stability with DeFi composability through multi-chain deployment across Ethereum, Solana, Base, and XRP Ledger.
Ideal For
- Institutional allocators seeking low-volatility dollar exposure
- DeFi protocols requiring yield-bearing collateral
- Treasuries managing idle stablecoin holdings
- Investors prioritizing regulatory compliance and brand-name backing
Standout Features
- Approximately 5% APY from short-term US Treasuries with daily interest payouts via rebasing mechanism
- Integration with Ripple's RLUSD stablecoin for instant minting and redemption 24/7
- Comprehensive SEC-registered infrastructure through acquisition of Oasis Pro, including broker-dealer, ATS, and transfer agent licenses
- Strategic partnerships including anchor position in Fidelity's FDIT tokenized money market fund and launch of Ondo Global Markets for tokenized equities
Pricing
Management fees embedded in net yield; typical 0.15-0.30% annual fee depending on product. OUSG requires $100K minimum; USDY accessible at lower thresholds with 4.29% APY.
Availability
Global except US persons for certain products. Ethereum, Solana, Polygon, Aptos, Sei, Base, XRP Ledger, and Sui supported.
Worth Noting
OUSG designed for qualified purchasers with extended lockup periods; less suitable for retail or high-frequency traders. Platform prioritizes institutional relationships over retail accessibility.
Alternatives to Consider: Franklin Templeton BENJI, OpenEden TBILL
Runner-Up: Franklin Templeton BENJI — Legacy Asset Manager Innovation
Overview
Franklin Templeton's $775 million Franklin OnChain U.S. Government Money Fund (BENJI) pioneered tokenized mutual funds in 2021, offering exposure to US government securities across eight blockchains with patent-pending intraday yield calculation.
Ideal For
- Investors seeking regulated 40 Act fund structure
- Collateral managers requiring second-by-second yield accrual
- Multi-chain strategies needing broad blockchain compatibility
- Users prioritizing traditional asset manager credibility
Standout Features
- Intraday yield tracking down to the second, enabling proportional earnings even for partial-day holdings
- Direct stablecoin purchases and redemptions with wallet-to-wallet transfer capability
- 63% of AUM deployed on Stellar Network for optimal cost efficiency
- Integrated with DeFi protocols for collateral and leverage applications
Pricing
7-day current yield approximately 4.5-5.5% gross; 0.25% management fee. No minimum investment restrictions beyond standard mutual fund requirements.
Availability
Global availability with specific KYC requirements. Active on Stellar, Ethereum, Arbitrum, Base, Avalanche, Polygon, Aptos, Solana, BNB Chain.
Worth Noting
Traditional mutual fund constraints apply including daily NAV calculations and potential redemption delays during market stress.
Alternatives to Consider: Backed bIB01, Superstate Short Duration Government Securities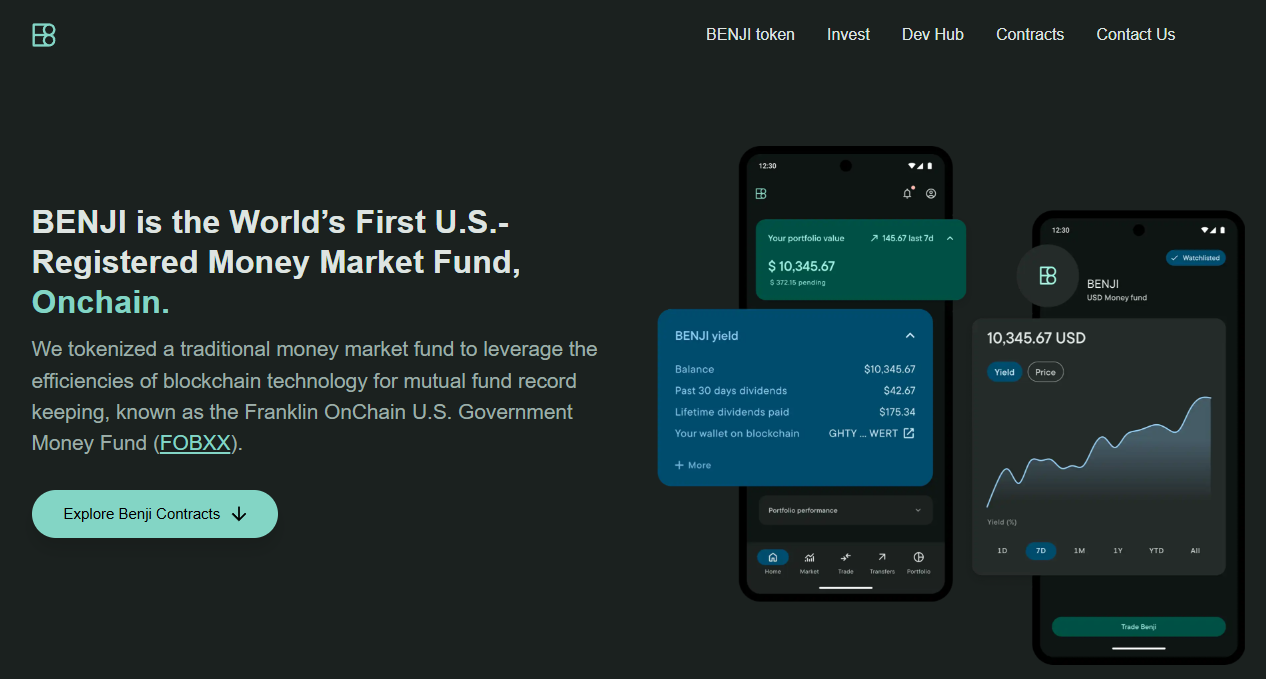
For Institutional Credit Exposure (8-12% Yield)
Top Pick: Maple Finance — Premier Crypto-Collateralized LendingOverview
Maple Finance manages over $4 billion in assets, specializing in institutional over-collateralized lending backed by Bitcoin, Ethereum, Solana, and XRP, targeting $100 billion in annual loan volume by 2030. The platform introduced SyrupUSDC for permissionless retail access alongside KYC-gated institutional pools.
Ideal For
- Institutional lenders seeking exposure to cryptocurrency-backed credit
- Liquidity providers comfortable with smart contract risk
- Allocators targeting floating-rate, senior-secured structures
- Investors seeking alternatives to traditional stablecoin farming
Standout Features
- Consistent 9-12% net yields through undercollateralized institutional facilities and structured credit products
- Strategic integration with Aave's $40 billion protocol bringing syrupUSDT to Plasma instance and syrupUSDC to core markets
- Partnerships with Bitwise, Lido Finance (stETH-backed credit lines), and EtherFi (weETH collateral) expanding institutional adoption
- Robust risk management combining decades of TradFi expertise with real-time on-chain monitoring
Pricing
Variable by pool; typical effective yields 9-12% after protocol fees. Minimum investments pool-dependent, generally $10K-$50K for retail syrup products.
Availability
Global with KYC requirements for lending. Institutional Maple requires accreditation; Syrup.fi open to broader participants.
Worth Noting
Platform transitioned from uncollateralized to over-collateralized model after 2022 market turmoil. Historical defaults impacted certain pools; robust recovery mechanisms now in place.
Alternatives to Consider: Credix (emerging markets), TrueFi (uncollateralized DeFi)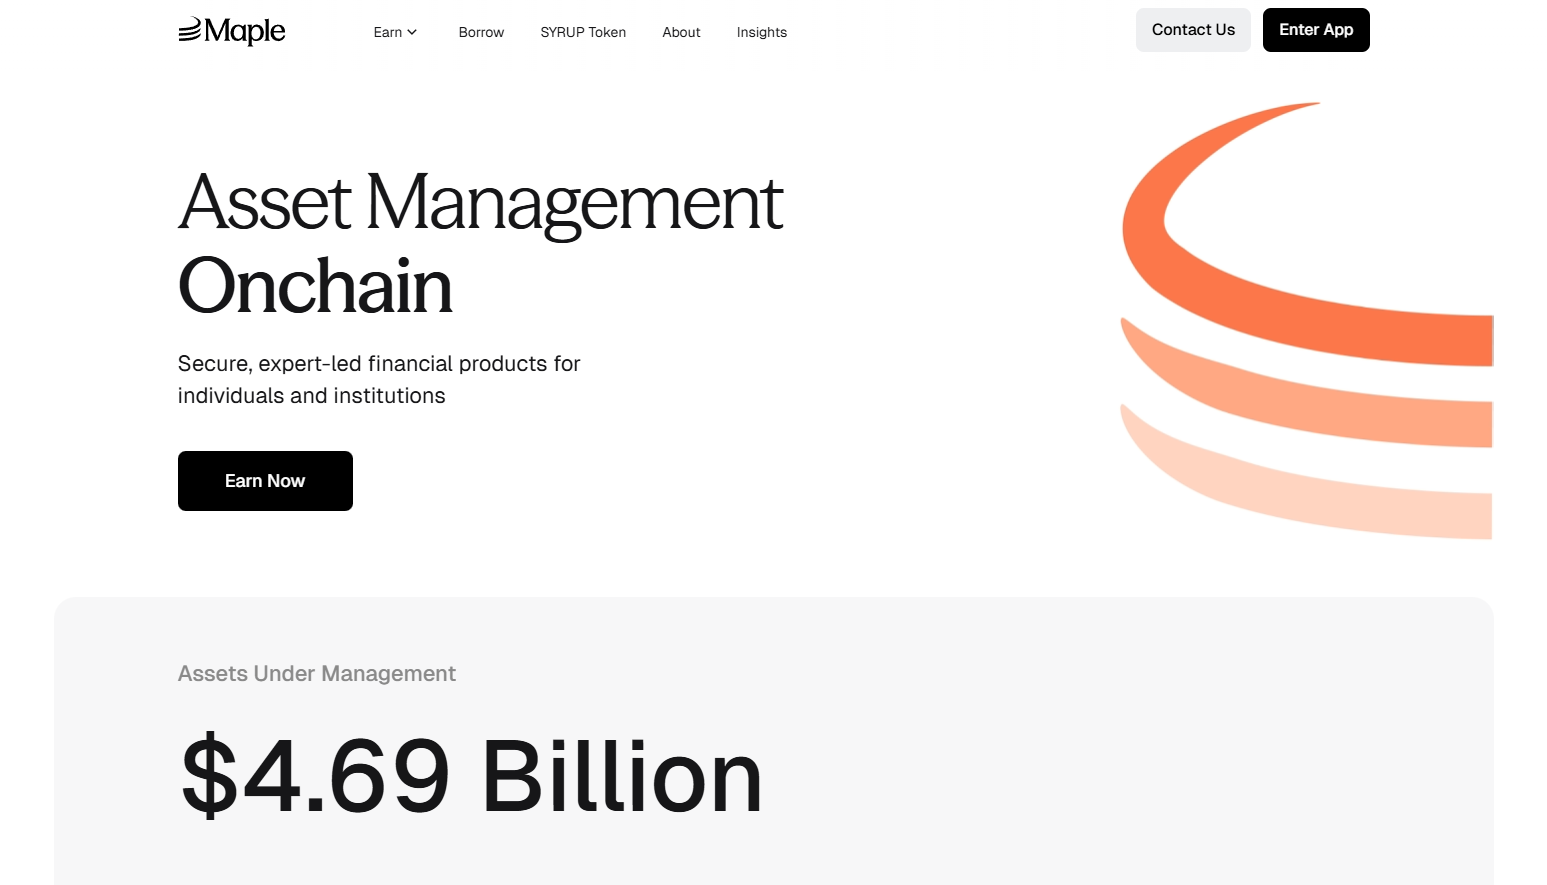
Runner-Up: Goldfinch Prime — Institutional Private Credit Access
Overview
Goldfinch Prime aggregates exposure to multi-billion dollar private credit funds from Ares, Apollo, Golub Capital, and KKR, providing on-chain access to institutional-grade senior secured loans with over $1 trillion in collective AUM.
Ideal For
- Non-US investors seeking diversified private credit exposure
- Allocators targeting institutional fund performance without direct fund access
- Participants seeking uncorrelated yield to crypto markets
- Investors comfortable with longer lockup periods
Standout Features
- Exposure to 1000+ senior secured loans across industries through vetted fund managers with 10+ years experience
- Target returns of 9-12% net of fees with strict eligibility criteria including >90% senior secured portfolios and <0.75% target non-accrual rates
- Heron Finance manages fund selection and vetting while fund managers handle all underwriting and default resolution
- USDC-based deposits converted to proportional GPRIME tokens for continuous offering structure
Pricing
Net yields 9-12% after embedded management fees and profit sharing. Minimum investments vary by pool structure; typically institutional minimums apply.
Availability
Non-US persons only due to regulatory structure. KYC and accreditation verification required.
Worth Noting
Exposure is indirect through fund shares rather than direct loan origination; fund managers absorb individual borrower default risk into aggregate yields. Liquidity limited compared to Treasury products.
Alternatives to Consider: Centrifuge private credit pools, Credix fintech lending
For Real Estate & Diversified Assets (6-10% Yield)
Top Pick: Centrifuge — Multi-Asset Tokenization InfrastructureOverview
Centrifuge operates as a multichain infrastructure platform enabling asset managers to tokenize real estate, trade finance, carbon credits, and structured credit with $1.2 billion TVL and recent 10x growth driven by the first on-chain CLO and tokenized S&P 500 index fund.
Ideal For
- Investors seeking exposure to asset-backed securities beyond treasuries
- Allocators comfortable evaluating tranched credit structures
- Participants prioritizing transparency and on-chain asset verification
- Portfolio managers wanting diversification across real-world credit types
Standout Features
- Asset-agnostic architecture supporting structured credit, real estate mortgages, US treasuries, carbon credits, and consumer finance with full collateralization and legal recourse for investors
- V3 platform enables cross-chain interoperability across Ethereum, Base, Arbitrum, Avalanche, BNB Chain, and Plume with integrated KYC and compliance-as-a-feature
- Senior/junior tranche structures allowing risk-return customization
- Partnership with Chronicle Labs for real-time price feeds and integration with Circle for USDC on/off-ramping
Pricing
Yields vary by pool and tranche: typically 6-8% for senior tranches, 10-14% for junior tranches. Management fees embedded; pool-specific minimums apply.
Availability
Global with KYC requirements. Pools may have additional jurisdictional restrictions based on underlying asset location.
Worth Noting
Platform complexity requires understanding of tranched structures and asset-specific risks. Less liquid credit instruments offer less frequent pricing updates than treasury products.
Alternatives to Consider: RealT (US residential real estate focus), Republic (equity crowdfunding)
For Emerging Market Credit (12-18% Yield)
Top Pick: Credix — Latin American Fintech LendingOverview
Credix specializes in providing credit facilities to fintech lenders in Latin America, offering high-yield exposure to underserved credit markets with institutional-grade underwriting and local market expertise.
Ideal For
- Sophisticated investors seeking higher risk-adjusted returns
- Allocators comfortable with emerging market credit risk
- Participants with extended investment horizons (12-24 months typical)
- Investors seeking geographic diversification from US/EU markets
Standout Features
- Target yields 12-18% reflecting emerging market risk premiums
- Focus on fintech infrastructure enabling financial inclusion
- Partnerships with established Latin American credit originators
- Robust due diligence and monitoring of borrower networks
Pricing
Pool-dependent yields typically 12-18% gross with management fees of 1-2%. Minimum investments generally $50K+ for accredited investors.
Availability
Non-US persons primarily; requires accreditation verification and enhanced KYC given emerging market exposure.
Worth Noting
Higher yields reflect higher credit and currency risk. Platform experienced challenges during regional economic volatility; enhanced risk controls now implemented.
Alternatives to Consider: Goldfinch V1 pools (emerging market focus), TrueFi uncollateralized pools
For Tokenization Infrastructure (Platform Providers)
Top Pick: Securitize — Industry-Leading Issuance PlatformOverview
Securitize has tokenized over $4.5 billion in assets for 1.2 million investors across 3,000+ clients, operating as an SEC-registered transfer agent with integrated ATS for secondary trading. The platform powers major offerings including BlackRock's BUIDL fund.
Ideal For
- Asset managers seeking turnkey tokenization solutions
- Issuers requiring SEC-compliant digital security infrastructure
- Institutional clients needing integrated custody and compliance
- Projects prioritizing regulatory alignment and brand credibility
Standout Features
- DS Protocol automates token issuance, transfer agent functions, and regulated secondary trading with $47 million funding led by BlackRock
- Recent launch of STAC tokenized AAA CLO fund with BNY custody demonstrating institutional adoption trajectory
- Comprehensive investor onboarding, KYC/AML, and reporting infrastructure
- Partnerships with major asset managers and integration with Zero Hash for fiat conversion
Pricing
Platform fees vary by issuance size and complexity; typically 0.5-2% of AUM plus basis point fees on transactions. White-label solutions available for enterprise clients.
Availability
Global operations with jurisdiction-specific compliance modules. Primary focus on US, EU, and APAC institutional markets.
Worth Noting
Securitize is an issuance platform rather than direct investment product; investors access opportunities through partner funds and offerings launched on the infrastructure.
Alternatives to Consider: Tokeny (EU-focused), Polymath/Polymesh (security token specialists)
Complete Provider Directory
- Backed Finance: European MiCA-compliant tokenization platform offering bIB01 (Swiss government bond exposure) and bC3M (commodity basket). Strong focus on regulatory alignment with modest 3-5% yields and low entry barriers.
- Swarm Markets: Decentralized platform enabling fractional ownership of real estate and private credit with $1K-$50K minimums. Emphasizes accessibility while maintaining compliance through distributed infrastructure.
- TrueFi: Uncollateralized lending protocol using on-chain credit scoring and portfolio diversification. Higher risk-return profile (8-15% targets) with full transparency of borrower pools and performance metrics.
- Archax: UK FCA-regulated platform for institutional tokenization of bonds, funds, and money markets. Focus on traditional finance compatibility with stringent accreditation requirements.
Making Your Selection: Key Questions
- What yield stability do you require?
Treasury-backed platforms (Ondo, Franklin Templeton) offer predictable 4-5% returns with minimal volatility. Credit-focused platforms (Maple, Goldfinch) target 9-12% but introduce credit risk and performance variability. - What is your risk tolerance for underlying collateral?
Government securities provide lowest risk; over-collateralized crypto loans add smart contract and liquidation risks; uncollateralized emerging market credit carries highest default potential. - Do you meet accreditation and minimum investment thresholds?
Many institutional products require $50K-$200K minimums and qualified purchaser status. Retail-accessible options like USDY and syrupUSDC lower barriers but may sacrifice yield. - What liquidity do you need?
Treasury tokens generally offer daily liquidity; private credit pools may have quarterly redemption windows; real estate tokenization can involve 12-24 month lockups. - How important is regulatory compliance?
Platforms like Ondo, Franklin Templeton, and Securitize prioritize SEC registration and traditional fund structures. Purely DeFi-native protocols offer less regulatory clarity but greater composability. - What blockchain ecosystems do you operate in?
Multi-chain deployment (Ondo, Centrifuge) provides flexibility; single-chain specialization (some Maple pools) may offer optimization but limits interoperability. - Do you have geographic restrictions?
US persons often excluded from highest-yield opportunities due to securities laws. European investors benefit from MiCA framework; APAC sees growing regulatory clarity. - What level of transparency do you require?
On-chain native protocols offer real-time asset verification; hybrid models may rely on periodic attestations and third-party audits. - Are you seeking passive income or active yield strategies?
Treasury staking provides set-and-forget returns; DeFi integrations enable leverage, collateral strategies, and yield optimization requiring active management. - How much operational complexity can you handle?
Single-platform solutions simplify but limit optionality; multi-protocol strategies maximize returns but require gas management, tax tracking, and security across multiple platforms.
Maximizing Your Setup with Token Metrics
Token Metrics provides critical intelligence for navigating RWA yield opportunities through data-driven analysis and market insights.
Research Phase: Leverage Token Metrics' fundamental analysis to evaluate tokenized asset protocols, comparing on-chain metrics, TVL trends, and yield sustainability indicators. Our RWA sector reports identify emerging platforms and highlight regulatory developments across jurisdictions.
Portfolio Construction: Use quantitative scoring to allocate across risk tiers—balancing stable treasury exposure with higher-yield credit products. Token Metrics' portfolio tools help optimize diversification while monitoring correlation to traditional crypto markets.
Ongoing Monitoring: Real-time alerts notify you of yield changes, protocol upgrades, and risk events. Our dashboard aggregates performance across multiple RWA platforms, tracking your yield-bearing positions alongside broader cryptocurrency holdings.
Risk Management: Token Metrics' risk analytics assess smart contract security, custody arrangements, and counterparty exposure. Our reports flag platforms with concerning yield sustainability metrics or operational red flags before they impact your capital.
Start your Token Metrics free trial to access institutional-grade RWA research and optimize your real-world asset allocation.
Essential Security Practices
- Custody Verification: Confirm that platforms use institutional-grade custodians (Coinbase Custody, BitGo, Fireblocks) for underlying assets. Verify proof-of-reserve attestations and third-party audits.
- Smart Contract Risk: Review audit reports from reputable firms (Trail of Bits, OpenZeppelin, Certora). Understand upgrade mechanisms and timelock protections on protocol contracts.
- Legal Structure Assessment: Examine SPV formation, bankruptcy remoteness, and investor recourse mechanisms. Ensure tokenization structure provides actual legal claim on underlying assets, not just economic exposure.
- Regulatory Compliance: Verify platforms maintain necessary licenses (broker-dealer, transfer agent, ATS) in relevant jurisdictions. Confirm offerings comply with securities laws in your domicile.
- Counterparty Risk: Understand who services loans, manages defaults, and handles liquidations. Evaluate track records of asset originators and credit underwriters.
- Liquidity Risk Management: Never allocate more than you can afford to lock up for stated redemption periods. Maintain buffer capital for market volatility and potential redemption delays.
- Tax Implications: Consult tax professionals on treatment of tokenized yield—may be classified as interest income, dividends, or capital gains depending on structure and jurisdiction.
- Geographic Restrictions: Verify you're eligible to participate based on residency. Using VPNs or misrepresenting location can result in frozen funds and legal liability.
- Platform Concentration: Diversify across multiple RWA providers to reduce single-point-of-failure risk. No single platform should represent majority of yield allocation.
- Documentation: Maintain records of all transactions, yield distributions, and platform communications for tax reporting and potential disputes.
This article is for research and educational purposes, not financial advice. RWA investments carry risks including loss of principal.
What to Avoid
- Ignoring minimum holding periods: Many RWA products enforce lockups or redemption windows. Treating them as liquid positions can leave you unable to access capital when needed.
- Chasing unsustainably high yields: Promised returns significantly above market rates often indicate excessive risk. Verify underlying asset performance and historical consistency before committing capital.
- Overlooking platform liquidity: Token existence on-chain doesn't guarantee exit liquidity. Check secondary market depth and historical spread between minting and redemption prices.
- Neglecting jurisdictional compliance: Accessing platforms not available in your region can result in frozen accounts and regulatory penalties. Always verify eligibility before depositing funds.
- Underestimating smart contract risk: Even well-audited protocols face exploitation risk. Size positions appropriately and monitor security incident disclosures across the ecosystem.
- Failing to verify asset backing: Don't rely on marketing claims. Demand proof-of-reserve, third-party attestations, and transparent reporting on underlying collateral.
- Concentrating in single asset class: Over-allocating to one RWA category (e.g., all private credit) eliminates diversification benefits. Balance across treasuries, credit, and real estate where possible.
- Ignoring fee structures: Management fees, performance fees, and transaction costs compound over time. Calculate net yields after all costs when comparing platforms.
Reader Questions Answered
What's the difference between tokenized treasuries and yield-bearing stablecoins?
Tokenized treasuries (like OUSG) represent direct ownership of US Treasury securities with yield passed through to holders. Yield-bearing stablecoins (like USDY) maintain $1 peg while distributing treasury yields via rebasing or airdrops. Treasuries may fluctuate slightly with NAV; yield stablecoins prioritize price stability.
Are RWA yields taxable differently than crypto staking rewards?
Likely yes, though tax treatment varies by jurisdiction. RWA yields from treasuries or credit facilities often classified as interest income taxed at ordinary rates. Crypto staking may be treated as income at receipt or capital gains at sale depending on location. Consult tax professionals for specific guidance.
Can I use tokenized RWAs as collateral in DeFi protocols?
Increasingly yes. Platforms like Maple, Ondo (via Flux Finance), and Centrifuge enable using tokenized assets as DeFi collateral. However, support varies by protocol and asset—USDY and OUSG see broader integration than niche real estate tokens. Liquidation risks apply if collateral value drops.
What happens if the platform goes bankrupt?
Properly structured tokenization isolates assets in bankruptcy-remote SPVs, protecting investor claims even if platform operator fails. However, redemption processes may be delayed and require legal navigation. This is why verifying legal structure and custodial arrangements is critical.
How liquid are RWA tokens compared to stablecoins?
Significantly less liquid. While stablecoins have billions in daily DEX volume, most RWA tokens trade thinly or only through platform-controlled redemption mechanisms. Treasury tokens offer better liquidity than private credit or real estate, but all lag traditional stablecoins substantially.
Do I need to be an accredited investor?
Depends on the platform and your location. US-based offerings often require accreditation; international platforms may have lower barriers. Products like USDY, syrupUSDC, and BENJI target broader accessibility, while institutional credit pools restrict to qualified purchasers.
What are the main risks that could cause loss of principal?
(1) Underlying asset default (credit risk), (2) smart contract exploitation, (3) platform insolvency without proper asset segregation, (4) regulatory action freezing operations, (5) stablecoin de-pegging for yield products denominated in USDC/USDT, (6) liquidation cascades in collateralized structures.
How do yields compare to traditional finance alternatives?
Tokenized treasuries (4-5%) match conventional money market funds but with 24/7 access. Private credit RWAs (9-12%) offer premiums over corporate bonds due to illiquidity and platform novelty. Emerging market RWA yields (12-18%) comparable to EM debt funds with added smart contract risk.
Bottom Line
Real-world asset yield marketplaces represent the maturation of blockchain infrastructure beyond speculation into productive finance. For investors seeking stable, asset-backed returns uncorrelated to cryptocurrency volatility, platforms like Ondo Finance and Franklin Templeton deliver institutional-grade treasury exposure with DeFi composability. Those comfortable with credit risk can access superior yields through Maple Finance's collateralized institutional lending or Goldfinch Prime's diversified private credit exposure.
The key to success: match platform selection to your specific risk tolerance, liquidity needs, and regulatory constraints. Treasury products suit conservative allocators prioritizing capital preservation; credit platforms reward investors accepting higher risk for enhanced returns; multi-asset infrastructure like Centrifuge offers diversification across real-world credit types.
Start with smaller allocations to understand platform mechanics, redemption processes, and yield consistency before committing substantial capital. The RWA sector's rapid growth will continue creating opportunities, but also attracting lower-quality offerings—due diligence remains paramount.
Related Resources:
- Best Cryptocurrency Exchanges 2025
- Top Derivatives Platforms 2025
- Top Institutional Custody Providers 2025
About This Research
Methodology: This guide evaluated 20+ RWA platforms through analysis of official documentation, on-chain data, regulatory filings, and third-party audits. Platforms selected represent meaningful TVL (>$100M), regulatory compliance, and operational track record. Final selection prioritized diversity across asset classes and investor accessibility tiers.
Research Sources:
- Ondo Finance: Product documentation, tokenomics, OUSG/USDY specifications, Oasis Pro acquisition disclosure
- Maple Finance: Platform whitepaper, syrupUSDC mechanics, Aave integration announcement, CEO interviews
- Centrifuge: V3 technical documentation, pool analytics, Republic partnership details
- Goldfinch: Prime pool specifications, fund manager criteria, Heron Finance structure
- Franklin Templeton: BENJI platform technical details, intraday yield patent documentation, multi-chain deployment
- Securitize: DS Protocol documentation, STAC fund launch details, BlackRock partnership announcements
- RWA.xyz: Platform TVL data, tokenization metrics, market growth analysis
- DeFiLlama: Protocol TVL tracking, historical performance data
- BCG/Ripple: RWA market projections and industry research
- VanEck, Coinbase, Binance: Sector research reports on RWA growth trajectories
All data current as of January 2025. Platform features and yields subject to change; verify current terms on official websites before investing.

Top Gold & Commodity-Backed Tokens (2025)
Who this guide is for. Crypto investors and treasurers comparing gold-backed tokens and other commodity-backed assets that can be audited and, in many cases, redeemed for metal.
Top three picks. PAX Gold (PAXG) for regulated, bar-linked redemption; Tether Gold (XAUt) for broad awareness and simple fees; Kinesis (KAU/KAG) for spend-and-yield use cases.
Key caveat. Redemption minimums, custody locations, and fees vary by issuer; always confirm regional eligibility and schedules on the official pages.
Introduction: Why Commodity-Backed Tokens Matter in 2025
Gold-backed tokens give on-chain ownership exposure to vaulted bullion with transparent allocation and, often, physical redemption, blending the inflation hedge of metals with crypto liquidity. In 2025, they’re used for hedging, collateral, cross-border settlement, and “digital cash” backed by tangible assets. A commodity-backed token is a blockchain token that represents title to a specific quantity of a real-world commodity (for example, 1 troy ounce or 1 gram of gold) held by a custodian, typically with published fees, vault locations, and redemption rules. Our picks prioritize liquidity, security controls, breadth of metals, cost transparency, and global accessibility.
Best Commodity-Backed Tokens in November 2025 (Comparison Table)

We excluded defunct or sunset projects (e.g., PMGT; CACHE Gold ceased backing CGT on Sept 30, 2025). (perthmint.com)
Top 10 Gold & Commodity-Backed Tokens in November 2025
1) PAX Gold (PAXG) — Best for bar-linked redemption & regulatory posture
Why Use It. PAXG links each token to specific LBMA Good Delivery bars stored in London, offering direct bar redemption (institutional minimums apply) or USD redemption at spot. Paxos publishes fee schedules and notes no storage fee charged to customers at this time. (paxos.com)
Best For. Institutions; HNW hedgers; DeFi users needing reputable collateral.
Notable Features. LBMA bars; serial-number linkage; custodied in London; fiat redemption option. (paxos.com)
Fees Notes. Creation/destruction fees; no storage fee currently per issuer help center. (help.paxos.com)
Regions. Global (issuer KYC).
Consider If. You can meet bar redemption minimums and UK vault logistics. (help.paxos.com)
Alternatives. Tether Gold (XAUt); VNX Gold (VNXAU).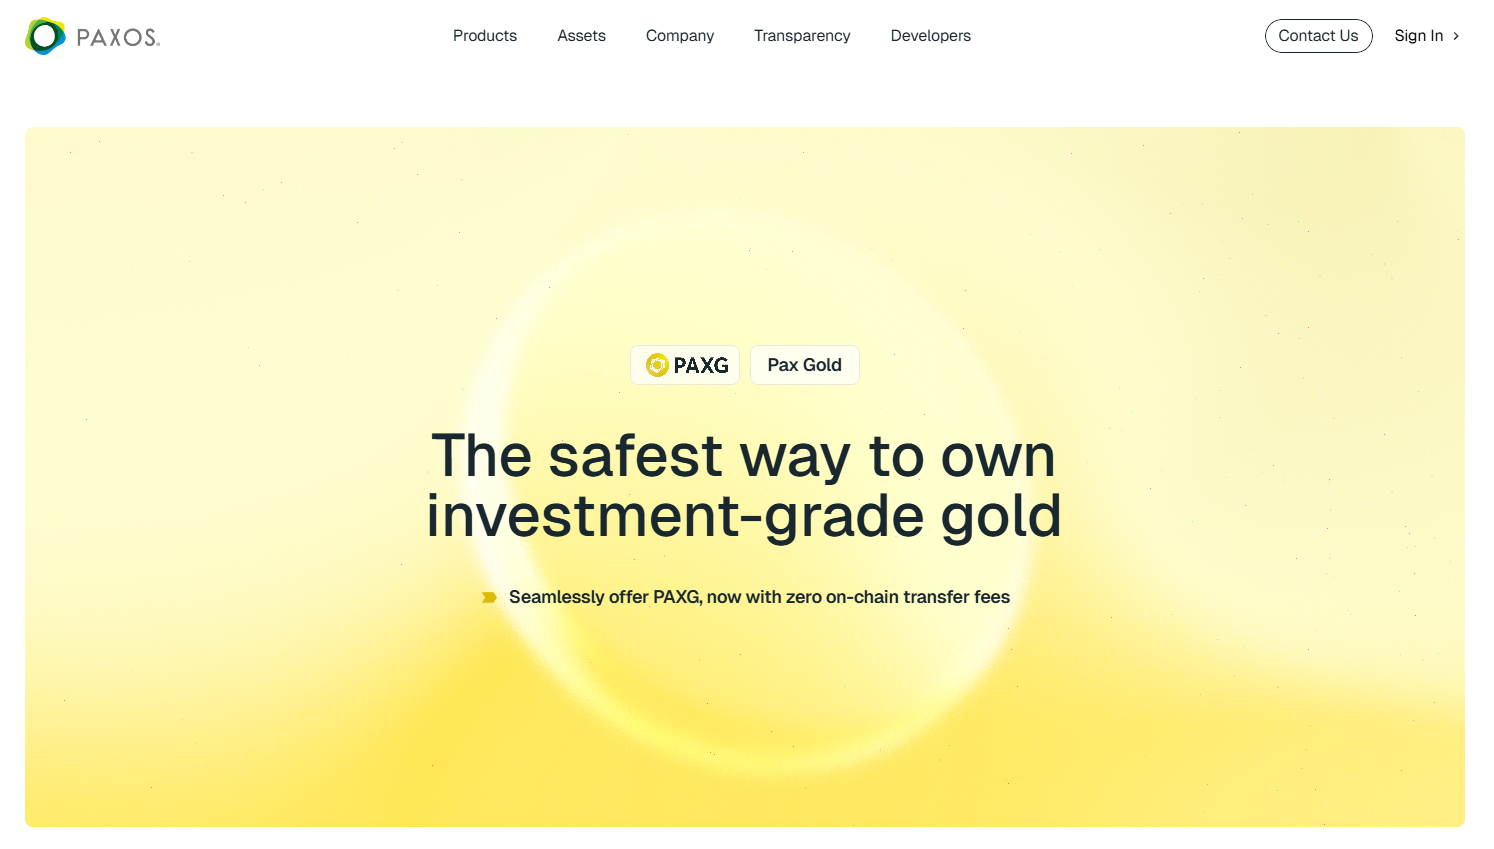
2) Tether Gold (XAUt) — Best for simple pricing & broad availability
Why Use It. XAUt represents allocated gold and can be redeemed for physical gold or USD; Tether publishes a straightforward 0.25% creation/redemption fee and a one-time verification fee for onboarding. FAQs outline redemption mechanics and bar specifics. (Tether)
Best For. Traders seeking brand familiarity; cross-chain users (ETH/TRON).
Notable Features. Bar metadata; physical or USD redemption; no custody fee disclosed beyond the transaction fee. (Tether)
Fees Notes. 25 bps create/redeem; separate KYC verification fee. (Tether)
Regions. Global (issuer KYC).
Consider If. You need clear fee math but don’t require bar-specific allocation like PAXG.
Alternatives. PAX Gold (PAXG); Kinesis (KAU).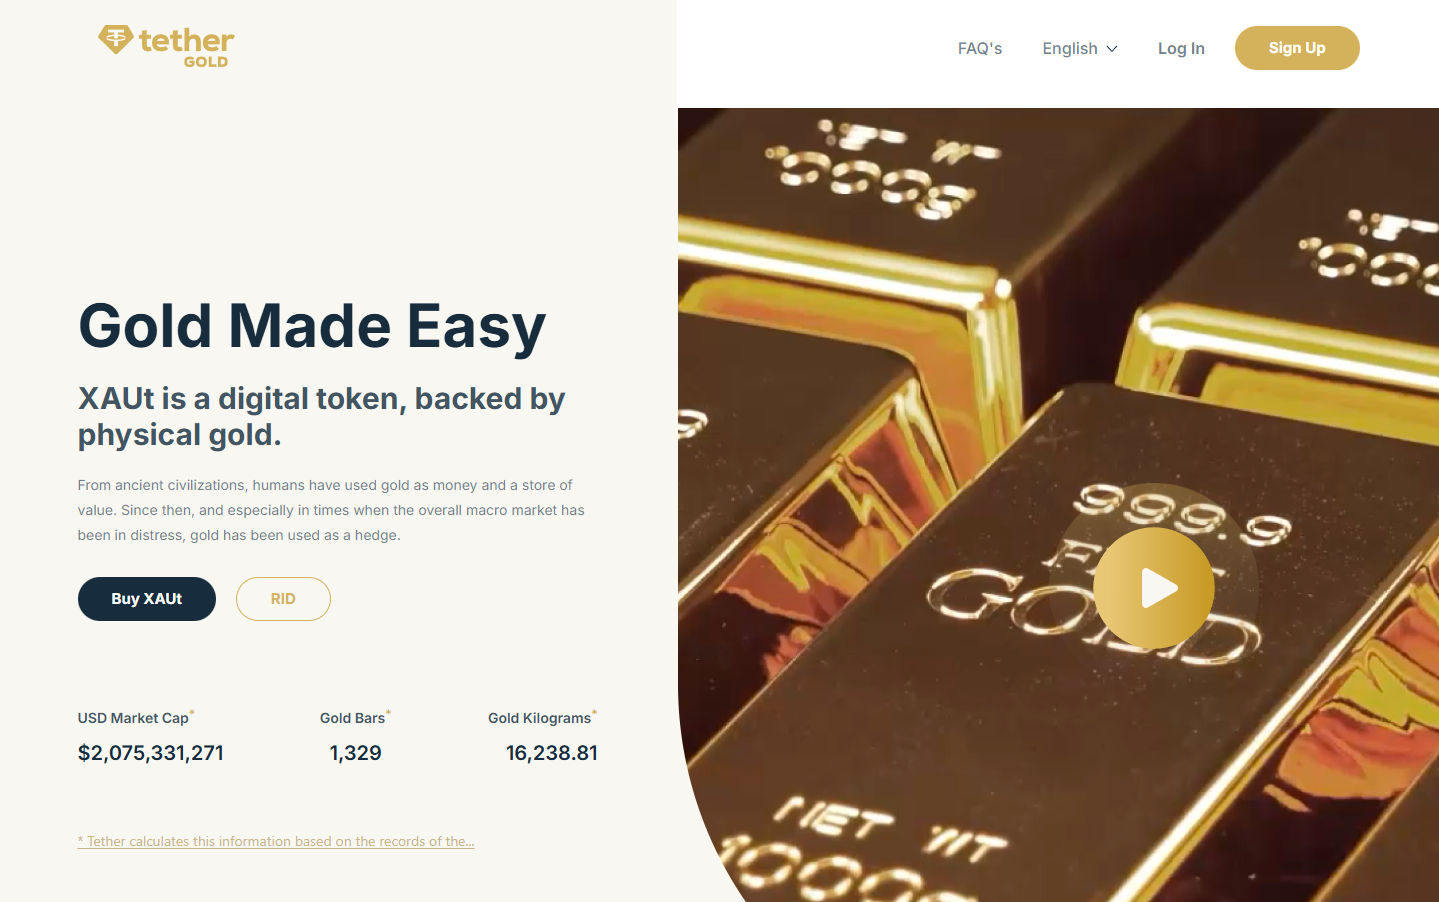
3) Kinesis KAU (Gold) / KAG (Silver) — Best for spend-and-yield utility
Why Use It. Kinesis combines metal-backed tokens with an exchange, cards, and yields funded from platform fees (published yield-share). Trading and precious metals transactions show ~0.22% execution fees on official schedules. (Kinesis)
Best For. Users wanting to spend gold/silver, earn monthly yields, and keep fees predictable.
Notable Features. Fee-share yield (published); exchange, card rails; gold & silver pairs. (Kinesis)
Fees Notes. ~0.22% buy/sell/trade; other fees per schedule. (Kinesis)
Regions. Global (platform KYC/availability).
Consider If. You prefer an integrated platform over a standalone token.
Alternatives. VNX (VNXAU/VNXAG); Aurus (tXAU/tXAG).
4) Comtech Gold (CGO) — Best for XDC ecosystem & Shariah-compliant framework
Why Use It. CGO tokenizes 1g gold units on the XDC (XRC-20) network, with a published fee structure for mint/redeem (0.50%), transfers (0.50%), and custody notes in FAQs. Documentation details creation/redemption and delivery fees. (comtechgold.com)
Best For. XDC builders; users needing Shariah-compliant structuring.
Notable Features. On-chain proofing; fee schedule; vault delivery options. (comtechgold.com)
Fees Notes. 0.50% mint/redeem; 0.50% transfer; custody terms disclosed. (comtechgold.com)
Regions. Global (issuer terms apply).
Consider If. You’re comfortable with XDC rails and issuer fee model.
Alternatives. PAXG; VNXAU.
5) VNX Gold (VNXAU) — Best for EEA vaulting & multi-chain issuance
Why Use It. VNXAU gives direct ownership of allocated bars stored in Liechtenstein with a public allocation lookup tool. VNX runs on Ethereum, Polygon, Q, and Solana, and has communications on redemption and delivery. (VNX)
Best For. EEA users; diversification across chains.
Notable Features. Allocation lookup by serial; segregated AAA-jurisdiction vault; multi-chain. (VNX)
Fees Notes. See VNX pricing and product pages for current schedules.
Regions. EEA emphasis; global availability varies by KYC.
Consider If. You want EEA custody and serial-level transparency.
Alternatives. PAXG; XAUt.
6) Aurus tGOLD (tXAU) / tSILVER (tXAG) — Best for gram-denominated multi-metal exposure
Why Use It. Aurus issues 1-gram tokens backed by vaulted gold and silver with insured, audited storage. tGOLD and tSILVER support multi-chain DeFi integrations and a mobile app, with ecosystem partners for mint/redeem. (AURUS)
Best For. DeFi users; small-denomination accumulation; multi-metal portfolios (includes platinum via tXPT).
Notable Features. 1g units; insured vaulted metals; app & dashboard; partner network. (AURUS)
Fees Notes. Exchange/network fees; issuer/partner fees may apply.
Regions. Global (partner KYC where required).
Consider If. You want gram-level flexibility and cross-chain access.
Alternatives. Kinesis; VNX.
7) Gold Silver Standard (AUS/AGS) — Best for Australia-based custody & simple redemption
Why Use It. Tokens AUS (gold) and AGS (silver) are backed by allocated bullion held in Australian high-security vaults with $0 storage and transfer at the issuer level and partner-facilitated redemptions. (goldsilverstandard.com)
Best For. AUD-centric investors; straightforward physical pickup/delivery via partners.
Notable Features. 1g linkage; local redemption via Ainslie partners; Australia-first focus. (goldsilverstandard.com)
Fees Notes. Issuer lists $0 storage/transfer; exchange and redemption partner fees may apply. (goldsilverstandard.com)
Regions. Australia focus; global varies.
Consider If. You need straightforward redemption in Australia.
Alternatives. PAXG; VNXAU.
8) VNX Silver (VNXAG) — Best for EEA silver allocation & transparency tools
Why Use It. VNXAG mirrors the VNXAU model for silver, backed by allocated metal with the same allocation lookup tooling and multi-chain issuance. (VNX)
Best For. EEA investors prioritizing silver in segregated storage.
Notable Features. Allocation lookup; EEA custody; multi-chain support. (VNX)
Fees Notes. See VNX site for current schedules.
Regions. EEA emphasis; global varies.
Consider If. You want EEA-vaulted silver with serial-level transparency.
Alternatives. KAG; tXAG.
9) VeraOne (VRO) — Best for euro-area buyers wanting 1-gram ERC-20
Why Use It. VRO is an ERC-20 token pegged to 1 gram of LBMA-standard gold, issued by a long-standing French precious-metal group; materials describe secured storage and regular audits. (VeraOne)
Best For. EU users; gram-based savings; euro on-ramps.
Notable Features. 1g linkage; audited storage; EU presence. (VeraOne)
Fees Notes. Issuer materials outline model; confirm current fees on site.
Regions. EU focus; global access varies.
Consider If. You want EU branding and ERC-20 simplicity.
Alternatives. PAXG; VNXAU.
10) AgAu — Best for Swiss custody & peer-to-peer design
Why Use It. AgAu outlines 1:1 backed gold and silver tokens with Swiss custody and a peer-to-peer payment focus; docs and reports describe convertibility and audited reserves. (agau.io)
Best For. Users seeking Swiss jurisdiction and payments-style UX.
Notable Features. Swiss issuer; P2P spend; audit & documents hub. (agau.io)
Fees Notes. See issuer documentation for fees and redemption steps.
Regions. Global (jurisdictional checks apply).
Consider If. You want Swiss custody with payments emphasis.
Alternatives. VNXAU; AUS.
Decision Guide: Best by Use Case
- Regulated, bar-specific redemption: PAX Gold (PAXG). (paxos.com)
- Simple fee schedule & brand familiarity: Tether Gold (XAUt). (Tether)
- Spend metals + monthly fee-share yield: Kinesis (KAU/KAG). (Kinesis)
- XDC network users: Comtech Gold (CGO). (comtechgold.com)
- EEA custody & allocation lookup: VNX (VNXAU/VNXAG). (VNX)
- Gram-based, multi-metal DeFi: Aurus (tXAU/tXAG). (AURUS)
- Australia-centric custody & pickup: Gold Silver Standard (AUS/AGS). (goldsilverstandard.com)
- EU 1-gram ERC-20: VeraOne (VRO). (VeraOne)
- Swiss custody & P2P payments: AgAu. (agau.io)
How to Choose the Right Commodity-Backed Token (Checklist)
- ☐ Region eligibility and KYC match your profile.
- ☐ Underlying metal type and unit (ounce vs gram).
- ☐ Redemption rules: minimums, delivery locations, timelines.
- ☐ Custody: vault jurisdiction, insurer, LBMA accreditation.
- ☐ Fee transparency: creation, redemption, storage, transfer, network.
- ☐ Audit/attestation cadence and allocation lookup tools.
- ☐ Chains supported and DeFi integration needs.
- ☐ Support channels and documentation depth.
Red flags: vague custody details, unclear redemption, or discontinued programs.
Use Token Metrics With Any Commodity-Backed Token
- AI Ratings to screen metal-linked assets and related ecosystem tokens.
- Narrative Detection to spot inflows to on-chain RWAs.
- Portfolio Optimization to size metal exposure vs. crypto beta.
- Alerts & Signals to time entries/exits around macro prints.
Workflow: Research → Select issuer → Execute on-chain or via platform → Monitor with alerts.
CTA: Start free trial to screen assets and time entries with AI.
Security & Compliance Tips
- Use official issuer URLs only; beware look-alikes.
- Confirm fee schedules and redemption procedures before buying. (Tether)
- Verify vaulting jurisdiction and any bar-serial lookup tools. (VNX)
- Mind network fees, bridge risks, and exchange withdrawal rules.
- Keep custody keys secure; whitelist issuer addresses.
- If staking or yielding, confirm source of yield and counterparty exposure. (Kinesis)
This article is for research/education, not financial advice.
Beginner Mistakes to Avoid
- Treating all metal tokens as equal—redemption and custody differ widely.
- Ignoring region and KYC limits until you try to redeem.
- Overlooking minimums (e.g., full LBMA bars vs. gram redemptions). (help.paxos.com)
- Confusing defunct tokens with active ones (e.g., PMGT sunset; CGT backing ceased). (perthmint.com)
- Forgetting network/transfer fees when arbitraging across chains.
- Using unofficial contracts on the wrong chain.
How We Picked (Methodology & Scoring)
- Liquidity — 30%. Exchange presence, on-chain activity, practical tradability.
- Security — 25%. Custody details, audits/attestations, LBMA alignment, redemption design.
- Coverage — 15%. Metals (gold/silver/platinum), chains, tooling.
- Costs — 15%. Creation/redemption/storage/transfer and transparency of schedules.
- UX — 10%. Apps, dashboards, redemption flows.
- Support — 5%. Docs, status pages, human support.
We relied on official product, docs, fees, FAQ, and disclosure pages, cross-checking market datasets only for context. Last updated November 2025.
FAQs
What are gold-backed tokens?
They are blockchain tokens that represent ownership of a specific quantity of vaulted, insured gold, typically with published fees and, in some cases, physical redemption options.
Are gold-backed tokens safer than stablecoins?
They can diversify away from fiat risk, but introduce custody and redemption dependencies. Safety depends on the issuer’s vaulting, audits, legal structure, and your ability to redeem.
What fees should I expect?
Common fees include creation/redemption, possible storage, transfer, and network fees. Examples: XAUt lists 0.25% create/redeem; Paxos publishes creation/destruction fees and notes no storage fee currently. Always check the live schedules. (Tether)
Can I redeem tokens for a real gold bar?
Some issuers support bar redemption with minimum sizes and location constraints (e.g., LBMA bar logistics in London for PAXG). Others support gram-level redemption via partners. (help.paxos.com)
Which chains are supported?
Varies: PAXG (Ethereum), XAUt (Ethereum/TRON), VNX (Ethereum/Polygon/Q/Solana), Aurus (multi-chain), CGO (XDC), Kinesis (native + exchange listings). (paxos.com)
Are there discontinued tokens I should avoid?
Yes. PMGT has been discontinued; CACHE Gold (CGT) ceased backing as of Sept 30, 2025. Verify project status before buying. (perthmint.com)
Conclusion + Related Reads
Choose PAXG for bar-linked redemption and strong disclosures, XAUt for simple fees and brand reach, or Kinesis if you want to spend metals and earn fee-share yields. For EEA vaulting with allocation lookup, VNX is compelling; for gram-based DeFi exposure, Aurus is versatile.
Related Reads:

Top RWA Tokenization Platforms (2025)
Who this guide is for. Teams and investors evaluating RWA tokenization platforms—issuers and infrastructure bringing Treasuries, funds, real estate, and other off-chain assets on-chain—across access tiers (retail, accredited, QP) and regions.
Top three picks.
- Securitize — institutional rails (transfer agent/broker-dealer) behind flagship tokenized funds.
- Ondo Finance — tokenized Treasuries and cash-equivalents with clear docs and eligibility flows.
- Franklin Templeton (Benji) — on-chain registered money market fund access for U.S. investors.
One caveat. Fees, eligibility (U.S., EU, APAC), and redemption workflows vary widely—always verify your region and investor status on the official product page before transacting. (Securitize)
Introduction
RWA tokenization platforms issue or enable compliant, on-chain representations of real-world assets such as U.S. Treasuries, money market funds, public securities, real estate, and gold. In 2025, the category matters because it brings 24/7 settlement, composability, and transparent audit rails to traditionally siloed markets—while preserving regulatory guardrails like KYC/AML and transfer restrictions. The primary keyword “RWA tokenization platforms” captures commercial-investigational intent: who issues what, on which chains, in which regions, with what fees and controls.
Definition (snippet-ready): An RWA tokenization platform is an issuer or infrastructure provider that brings off-chain assets on-chain under documented legal, custody, and compliance frameworks, with mint/redeem and transfer controls stated in official materials.
How We Picked (Methodology & Scoring)
We scored each platform using official product, docs, pricing, security/licensing, and status pages (and cross-checked volumes with market datasets when needed). We prioritized current availability and clear disclosures.
Scoring weights (sum = 100):
- Liquidity — 30%: scale, mint/redeem pathways, composability.
- Security — 25%: audits, custodians, transfer agent/broker-dealer status, disclosures.
- Coverage — 15%: asset types (T-bills, funds, gold, stocks, real estate), chains.
- Costs — 15%: stated fees and expense ratios; network fees.
- UX — 10%: onboarding, docs, transparency dashboards.
- Support — 5%: regions, KYC help, contact channels.
Freshness: Last updated November 2025.
Best RWA tokenization platforms in November 2025 (Comparison Table)
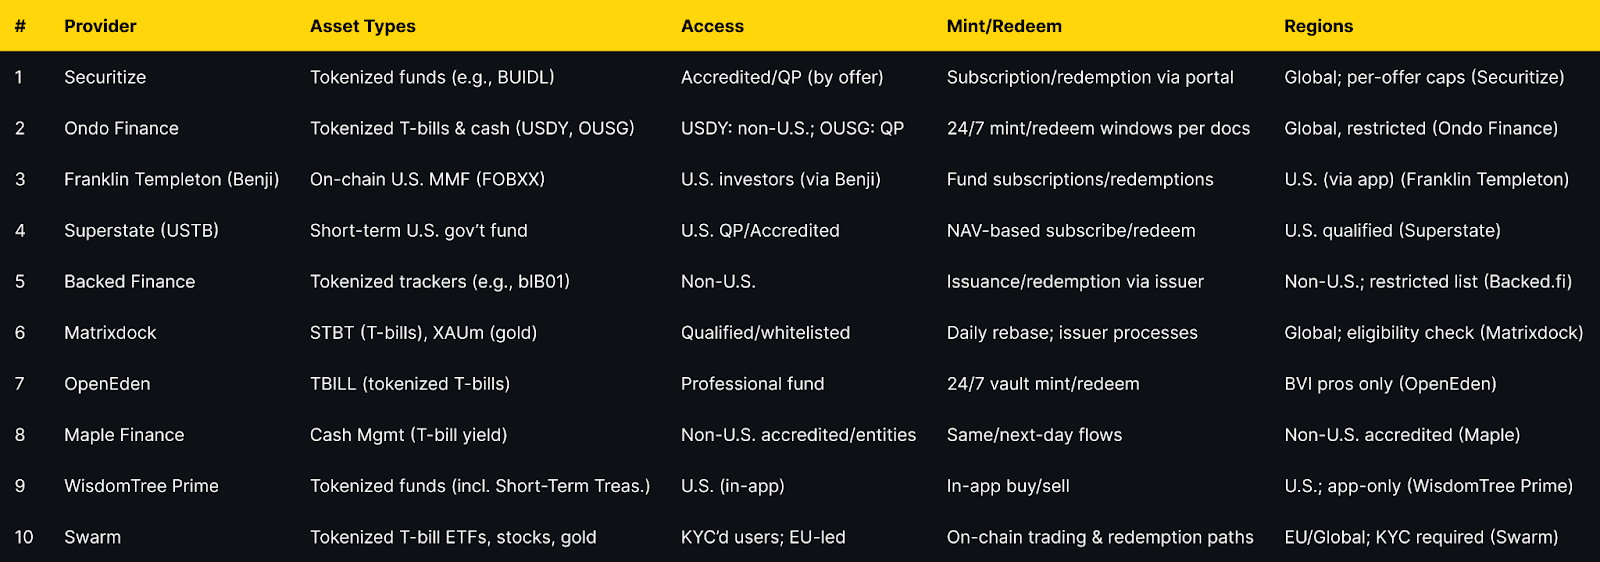
Top 10 RWA tokenization platforms in November 2025
1. Securitize — Best for institutional-grade tokenized funds
Why Use It. Securitize provides regulated rails (transfer agent/broker-dealer) behind marquee tokenized funds like BlackRock’s BUIDL, with investor onboarding, cap-table/TA services, and compliant transfer controls for secondary liquidity where permitted. (Securitize)
Best For. Asset managers, QP/Accredited investors, enterprises wanting full-stack issuance and servicing.
Notable Features. Transfer agent role; broker-dealer marketplace; issuer/investor portals; compliance & reporting. (digitize.securitize.io)
Consider If. You need institutional governance and regulated distribution rather than retail-first access.
Fees Notes. Fund expense ratios and issuer/platform fees vary by offering.
Regions. Global, with per-offering eligibility and disclosures.
Alternatives. WisdomTree Prime; Ondo Finance.
2. Ondo Finance — Best for diversified tokenized Treasuries & cash-equivalents
Why Use It. OUSG gives QPs exposure to short-term Treasuries/money market funds; USDY offers a tokenized note with cash-equivalent backing, with clear eligibility and 24/7 mint/redeem mechanics documented. (Ondo Finance)
Best For. DAOs and treasuries, QPs, non-U.S. entities seeking on-chain cash management.
Notable Features. USDY/ONS products; rTokens (rebasing); detailed fees/tax sections; multi-chain support. (docs.ondo.finance)
Consider If. U.S. persons generally restricted for USDY; confirm status before onboarding. (Ondo Finance)
Fees Notes. Management/operational fees per product docs; plus network fees. (docs.ondo.finance)
Regions. Global with restrictions (e.g., no USDY for U.S. persons). (Ondo Finance)
Alternatives. Superstate; OpenEden.
3. Franklin Templeton — Benji — Best for U.S. on-chain money market access
Why Use It. The Franklin OnChain U.S. Government Money Fund (FOBXX) is a registered fund whose shares are represented on-chain (BENJI), allowing U.S. investors to access a money market fund with blockchain-based recordkeeping. (digitalassets.franklintempleton.com)
Best For. U.S. treasurers and advisors needing a regulated on-chain cash vehicle.
Notable Features. US-registered fund; Stellar/Polygon rails; Benji contracts/app. (digitalassets.franklintempleton.com)
Consider If. Access is via Franklin’s app; availability and eligibility are U.S.-focused. (digitalassets.franklintempleton.com)
Fees Notes. Standard money market fund expense ratio; see fund page. (franklintempleton.com)
Regions. U.S. investors (see Benji). (digitalassets.franklintempleton.com)
Alternatives. WisdomTree Prime; Securitize-hosted offerings.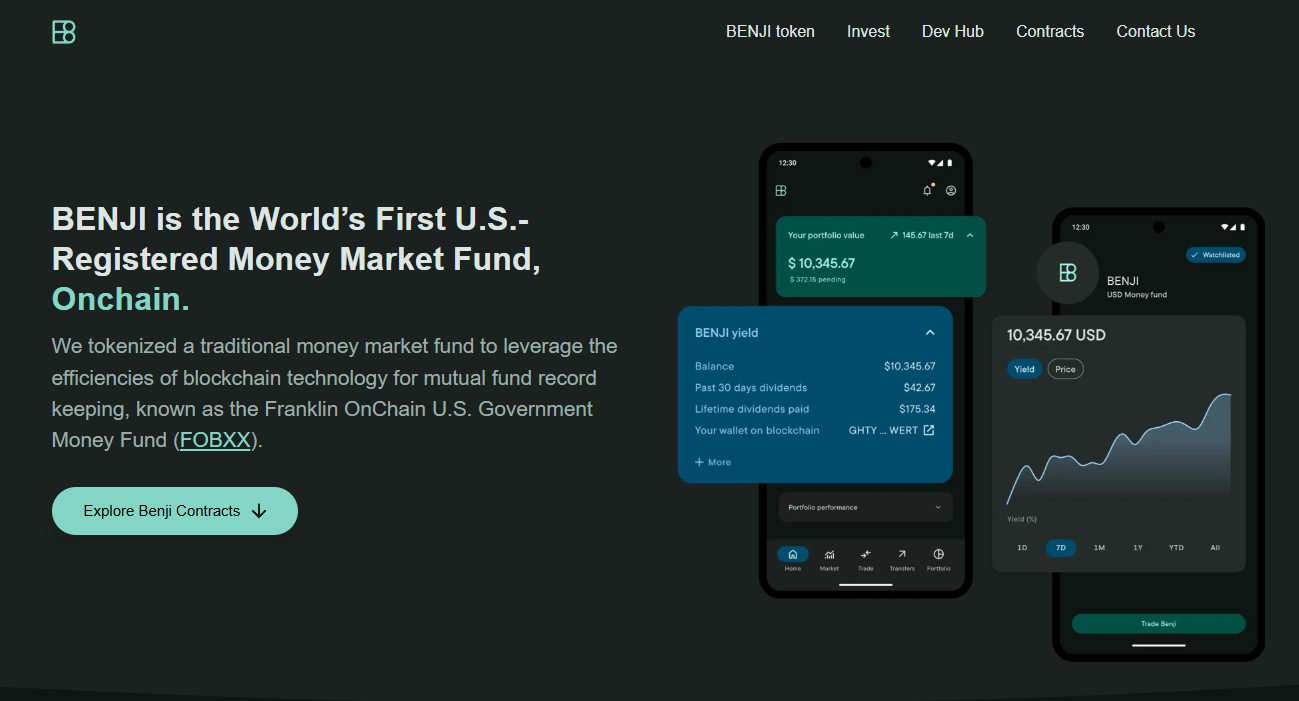
4. Superstate (USTB) — Best for U.S. Qualified Purchasers
Why Use It. USTB offers U.S. Qualified Purchasers access to short-duration U.S. government securities through a tokenized fund on Ethereum, with institutional processes and NAV-based subscriptions/redemptions. (superstate.com)
Best For. U.S. QPs, fund treasurers, trading firms.
Notable Features. Ethereum issuance; QP onboarding; short-duration Treasury focus. (superstate.com)
Consider If. Available to QPs; verify accreditation and subscription steps. (superstate.com)
Fees Notes. Fund expenses apply; see official page. (superstate.com)
Regions. U.S. (Qualified Purchasers). (superstate.com)
Alternatives. Ondo OUSG; WisdomTree Prime funds.
5. Backed Finance — Best for tokenized trackers of public securities
Why Use It. Backed issues ERC-20 trackers like bIB01 (iShares $ Treasury 0-1yr UCITS ETF) with explicit regional restrictions and product pages that state legal structure and disclosures. (backed.fi)
Best For. Non-U.S. entities seeking tokenized ETF-style exposure with issuer support.
Notable Features. Tokenized trackers and AMCs; legal docs; chain integrations. (backed.fi)
Consider If. Not available to U.S. persons; restricted countries listed. (assets.backed.fi)
Fees Notes. Issuer/admin fees per product; plus network fees. (backed.fi)
Regions. Non-U.S.; sanctions list enforced. (assets.backed.fi)
Alternatives. Swarm; Matrixdock STBT.
6. Matrixdock — Best for T-bills and gold under one issuer
Why Use It. STBT provides short-term U.S. Treasury exposure with a 1:1 USD peg and daily rebasing, while XAUm tokenizes LBMA-grade physical gold—both under a clear issuer framework. (matrixdock.com)
Best For. Treasury management with optional gold allocation on the same rails.
Notable Features. STBT daily rebase; peg policy; gold custodial disclosures. (matrixdock.com)
Consider If. Whitelisting/eligibility apply; confirm region and KYC. (matrixdock.com)
Fees Notes. Issuer fees per product pages; network fees. (matrixdock.com)
Regions. Global with eligibility controls. (matrixdock.com)
Alternatives. OpenEden; Ondo OUSG.
7. OpenEden — Best for professional-grade tokenized T-bills
Why Use It. TBILL is structured as a regulated Professional Fund (BVI) with a 24/7 smart-contract vault for mint/redeem and a transparency dashboard, targeting professional investors. (openeden.com)
Best For. Professional/offshore funds and DAOs requiring programmatic access.
Notable Features. BVI Professional Fund status; real-time transparency; vault UI. (openeden.com)
Consider If. Professional-investor eligibility required; check docs before onboarding. (openeden.com)
Fees Notes. Fund and platform fees; plus network fees. (openeden.com)
Regions. BVI-regulated; cross-border access subject to status. (openeden.com)
Alternatives. Matrixdock; Ondo.
8. Maple Finance — Cash Management — Best for non-U.S. accredited entities seeking T-bill yield
Why Use It. Maple’s Cash Management provides non-U.S. accredited participants on-chain access to T-bill and repo yields, with updates enabling immediate servicing when liquidity is available and next-day withdrawals operationally. (maple.finance)
Best For. Non-U.S. corporates, DAOs, and funds optimizing idle stablecoin cash.
Notable Features. Fast onboarding; immediate interest accrual; no lock-up; institutional borrower SPV. (maple.finance)
Consider If. U.S. investors are excluded; confirm accreditation and entity status. (maple.finance)
Fees Notes. Management/operational fees netted from yield; network fees. (maple.finance)
Regions. Non-U.S. accredited/entities. (maple.finance)
Alternatives. OpenEden; Ondo.
9. WisdomTree Prime (Digital Funds) — Best for app-native tokenized fund access in the U.S.
Why Use It. The Prime app offers tokenized digital funds—including Short-Term Treasury—purchased and held in-app, bringing tokenized funds to retail U.S. users under an SEC-registered umbrella. (WisdomTree Prime)
Best For. U.S. retail/in-app users seeking tokenized fixed income and equity funds.
Notable Features. In-app buy/sell; multiple Treasury maturities; composability paths emerging. (WisdomTree Prime)
Consider If. App-only access; availability subject to U.S. coverage and disclosures. (WisdomTree Prime)
Fees Notes. Fund expense ratios; standard network fees for on-chain interactions. (wisdomtree.com)
Regions. U.S. (Prime app). (WisdomTree Prime)
Alternatives. Franklin Benji; Securitize.
10. Swarm — Best for compliant on-chain trading of tokenized T-bill ETFs and equities
Why Use It. Swarm enables compliant, on-chain access to tokenized U.S. Treasury ETFs, public stocks, and gold, with KYC’d access and DeFi-compatible rails documented in its platform materials and docs. (swarm.com)
Best For. EU-led users, crypto funds, and builders needing tokenized public market exposure.
Notable Features. dOTC protocol; product pages for T-bill ETFs; documented KYC/flows. (swarm.com)
Consider If. Regional and KYC requirements apply; yields are variable per underlying ETF. (swarm.com)
Fees Notes. Platform/product fees; network fees. (swarm.com)
Regions. EU/Global with KYC. (swarm.com)
Alternatives. Backed Finance; Ondo.
Decision Guide: Best By Use Case
- Regulated U.S. access (retail): Franklin Benji, WisdomTree Prime. (digitalassets.franklintempleton.com)
- U.S. Qualified Purchasers: Superstate USTB, Ondo OUSG. (superstate.com)
- Non-U.S. accredited entities: Maple Cash Management, Backed Finance. (maple.finance)
- Always-on T-bill vault with pro fund wrapper: OpenEden TBILL. (openeden.com)
- Treasuries + gold under one roof: Matrixdock (STBT, XAUm). (matrixdock.com)
- Tokenized public stocks & bond ETFs in DeFi: Swarm, Backed Finance. (swarm.com)
- Issuer/infrastructure for enterprises: Securitize (transfer agent + BD). (digitize.securitize.io)
How to Choose the Right RWA Tokenization Platform (Checklist)
- Region eligibility (U.S./EU/APAC and investor status: retail, accredited, QP) is clearly stated.
- Asset coverage matches mandate (T-bills, money market funds, ETFs, gold, real estate).
- Mint/redeem mechanics and settlement windows are documented.
- Fees: expense ratios, issuer fees, spreads, on-chain network costs are explicit.
- Security posture: custodians, audits, transfer agent/broker-dealer status, disclosures.
- Transparency: NAV, holdings, attestation or daily rebasing and dashboards.
- Chain support: EVM/L2s/other; composability needs.
- Support & docs: onboarding, KYC, status pages.
Red flags: vague eligibility, missing fee tables, no custody/disclosure detail.
Use Token Metrics With Any Category
- AI Ratings to screen assets tied to each platform’s tokens.
- Narrative Detection to spot early RWA flows across chains.
- Portfolio Optimization to size cash-equivalents vs. risk assets.
- Alerts & Signals to time rotations into yield-bearing RWAs.
CTA — Indices Focus: Prefer diversified exposure? Explore Token Metrics Indices.
Security & Compliance Tips
- Transact only via official portals/URLs and verified contracts listed in docs. (digitalassets.franklintempleton.com)
- Confirm eligibility (U.S./non-U.S., accredited/QP) and sanctioned-country restrictions before minting. (assets.backed.fi)
- Review custody and role separation (issuer, TA, broker-dealer) and audit reports where available. (digitize.securitize.io)
- Understand redemption windows, rebase mechanics, and NAV policies. (matrixdock.com)
- Track fund expenses and on-chain network fees; they impact net yield. (franklintempleton.com)
- Bookmark status/docs pages for incident updates and parameter changes.
This article is for research/education, not financial advice.
Beginner Mistakes to Avoid
- Treating all RWA tokens as “stablecoins”—yields, risks, and redemption rights differ.
- Ignoring eligibility rules, then getting stuck at redemption.
- Skipping issuer docs and relying only on dashboards.
- Assuming 1:1 liquidity at all times without reading fund/issuer terms.
- Mixing retail wallets with institutional KYC accounts without a plan.
- Overlooking chain/bridge risks when moving RWA tokens across L2s.
How We Picked (Methodology & Scoring)
We built an initial universe (~20 issuers/infrastructure) and selected 10 based on the SCORING_WEIGHTS above. We verified asset coverage, eligibility, fees, redemption, and regions on official pages only (listed below). Third-party datasets were used for cross-checks but are not linked.
FAQs
What are RWA tokenization platforms?
Issuers or infrastructure that bring real-world assets (like Treasuries, funds, gold, or equities) on-chain under a legal/compliance framework, with stated mint/redeem processes and transfer rules. See each official page for specifics. (Securitize)
Are they safe for retail?
Some are U.S. retail-friendly (e.g., Franklin Benji, WisdomTree Prime), while others are restricted to accredited investors, QPs, or non-U.S. persons. Always check the eligibility page before onboarding. (digitalassets.franklintempleton.com)
What fees should I expect?
Expect fund expense ratios or issuer/admin fees plus on-chain network fees. Some products rebase yield; others adjust NAV. Review each product’s fees section. (docs.ondo.finance)
Where are these tokens available?
Most run on Ethereum or compatible L2s, with some on Stellar/Polygon via app rails. Regions vary (U.S., EU, offshore professional). (digitalassets.franklintempleton.com)
Can I redeem 24/7?
Many have 24/7 mint/redeem requests; actual settlement follows fund terms, banking hours, and liquidity windows. Check each product’s redemption section. (app.openeden.com)
Conclusion + Related Reads
If you want institutional rails and broad issuer support, start with Securitize. For T-bill exposure with clear docs, consider Ondo or Superstate (QP). U.S. retail can explore Franklin Benji or WisdomTree Prime. Diversifiers can add Matrixdock (Treasuries + gold) or OpenEden (pro fund vault). Builders needing tokenized equities/ETFs should evaluate Swarm and Backed.
Related Reads (Token Metrics):


Get Your Brand in Front of 150,000+ Crypto Investors!

9450 SW Gemini Dr
PMB 59348
Beaverton, Oregon 97008-7105 US
.svg)
No Credit Card Required


Online Payment


SSL Encrypted
.png)
Products
Subscribe to Newsletter
Token Metrics Media LLC is a regular publication of information, analysis, and commentary focused especially on blockchain technology and business, cryptocurrency, blockchain-based tokens, market trends, and trading strategies.
Token Metrics Media LLC does not provide individually tailored investment advice and does not take a subscriber’s or anyone’s personal circumstances into consideration when discussing investments; nor is Token Metrics Advisers LLC registered as an investment adviser or broker-dealer in any jurisdiction.
Information contained herein is not an offer or solicitation to buy, hold, or sell any security. The Token Metrics team has advised and invested in many blockchain companies. A complete list of their advisory roles and current holdings can be viewed here: https://tokenmetrics.com/disclosures.html/
Token Metrics Media LLC relies on information from various sources believed to be reliable, including clients and third parties, but cannot guarantee the accuracy and completeness of that information. Additionally, Token Metrics Media LLC does not provide tax advice, and investors are encouraged to consult with their personal tax advisors.
All investing involves risk, including the possible loss of money you invest, and past performance does not guarantee future performance. Ratings and price predictions are provided for informational and illustrative purposes, and may not reflect actual future performance.