Crypto Basics

How Cryptos and Meme Coins Are Shaping the 2025 Crypto Market

Explore how smart money tracking, meme coins, and sector rotations are driving the 2025 crypto cycle—and what traders need to know to stay ahead.
Token Metrics Team
5 min
MIN

Introduction
With Bitcoin in price discovery and meme coins dominating short-term trends, crypto markets in 2025 are in a new phase of the cycle. At Token Metrics, we’ve been tracking smart money, emerging tokens, and high-conviction sectors like DeFi, AI, and meme assets. This post breaks down what we’re seeing—and how traders are adapting.

Current Market Sentiment

Bitcoin remains strong, with ETH and SOL following closely. Our models suggest:

  • ETH base case: $5,700
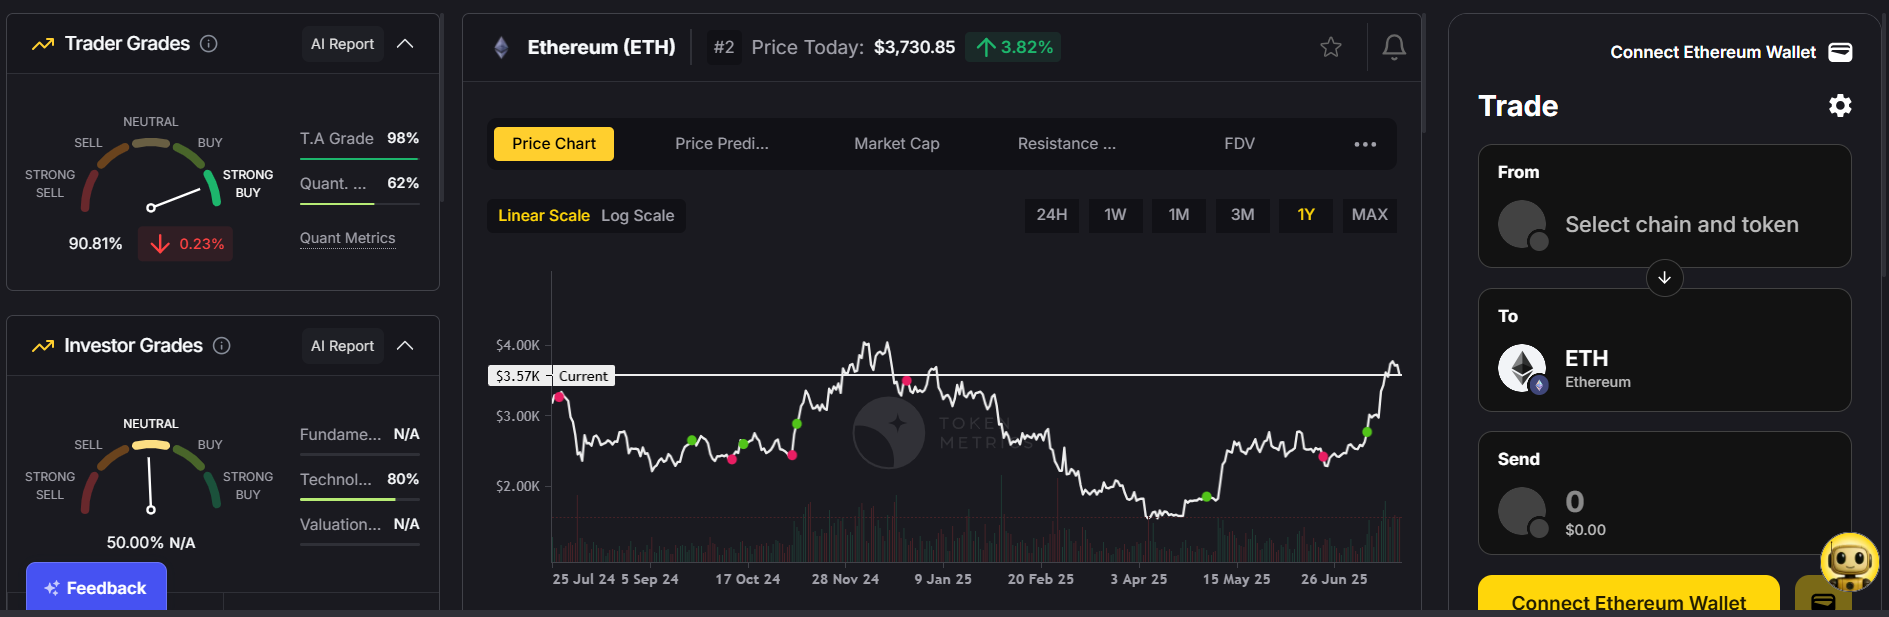

  • SOL base case: $630


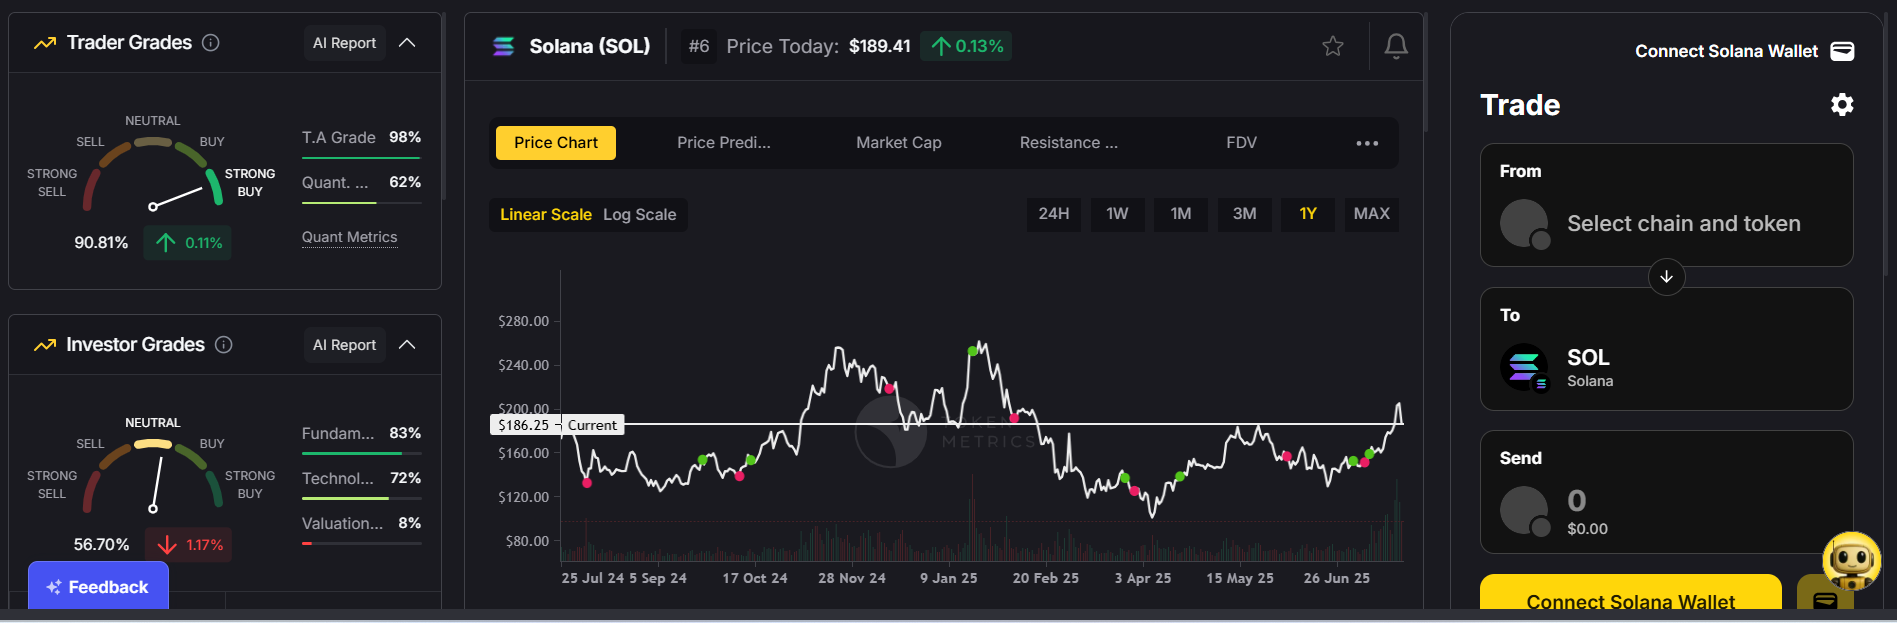
  • Market cap projection: $8–14 trillion

Despite regulatory noise, crypto’s fundamentals—liquidity, user growth, and capital rotation—remain bullish.

Meme Coin Resurgence

Meme coins are leading short-term market action. Among the top gainers:

  • LoFi (SUI Ecosystem): Under $50M FTV, high liquidity, listed on Kraken and KuCoin
  • Sign, Gradient, Zerebro: Mixed quality; require caution

While volatility is high, top-performing meme coins on new chains often yield strong short-term returns—especially when backed by rising ecosystems like SUI.

Smart Money Tracking with Nansen

We’ve doubled down on using platforms like Nansen to follow profitable wallet cohorts. These tools help us identify early-stage tokens with smart money inflows. Key indicators:

  • Positive net inflow from smart wallets
  • Low concentration in top 100 holders
  • Distribution to non-suspicious fresh wallets
  • Whale cohort accumulation

We also track wallet activity over time to confirm whether top-performing wallets are accumulating or exiting positions.

Deep Dives Over Speculation

While meme coins grab headlines, we’re also analyzing sectors with long-term viability:

  • AI Agents (e.g., Fractal AI, Swarms)
  • Real-World Asset Stablecoins (e.g., USUAL with 9% APY)
  • Narrative Ecosystems (e.g., Hedera’s DEX activity surge)

We balance high-risk meme trades with deep fundamental research into projects gaining traction on-chain and in product development.

Sector Watch: Hedera Ecosystem

The Hedera (HBAR) ecosystem recently saw a 5x spike in DEX volume. Tokens like:

  • SaucerSwap (DEX)
  • HashPack (wallet)
  • Bonzo (lending)

are trending upward. While TVL remains low, increased volume may spark price momentum.

We’re not rotating capital aggressively here yet, but we’re watching closely for sustained on-chain activity.

Capital Flow Outlook

Altcoin rotation often follows BTC consolidation. With BTC and ETH leading the charge, we expect:

  • Meme coins and DeFi tokens to lead early-stage alt rotations
  • AI and DePin narratives to pick up mid-cycle
  • ETH and SOL outperformance in layer-1 competition

Internal price models and momentum indicators support further upside, assuming macro remains stable and regulatory conditions don’t sharply deteriorate.

Conclusion

The current cycle rewards those who combine quantitative analysis, on-chain tracking, and strong narrative awareness. Whether trading LoFi for a quick flip or accumulating tokens like Fractal AI or USUAL for a thesis-driven hold, the key is staying ahead of trends without abandoning discipline.

Build Smarter Crypto Apps &
AI Agents in Minutes, Not Months
Real-time prices, trading signals, and on-chain insights all from one powerful API.
Grab a Free API Key
Token Metrics Team
Token Metrics Team

Recent Posts

Research

How to Find the Next 10x Crypto Token with Token Metrics

Token Metrics Team
4 min
MIN

Every crypto investor dreams of discovering that one hidden gem — the token that goes from unknown to unstoppable, delivering 10x or even 50x returns. But with over 25,000 cryptocurrencies on the market in 2025, the big question remains: how do you actually find the one that will moon before the crowd catches on?

That’s where Token Metrics steps in.

By combining AI-powered crypto signals, narrative filters, advanced grading systems, and deep-dive analytics, Token Metrics makes it easier than ever to identify high-potential projects early — and trade them with confidence.

Whether you’re a retail trader looking for your first big win, or a seasoned investor building a crypto portfolio, Token Metrics gives you the tools to make smarter, faster, and more profitable decisions.

The 10x Formula: What Really Drives Explosive Growth in Crypto?

Not every token is destined for greatness. But nearly every 10x token follows a pattern before it takes off. At Token Metrics, we’ve studied thousands of chart patterns, price trends, and fundamental indicators to isolate the key ingredients most 10x tokens share before they explode:

🔥 1. Bold Signal Trigger

These are early-stage AI signals generated when a token begins to show strong upside potential. Token Metrics’ AI tracks market data, price momentum, sentiment, and technical indicators to identify early breakout signals.

📈 2. High Trader & Investor Grades

  • Trader Grade reflects short-term price action, momentum, and volume.
  • Investor Grade scores long-term potential based on liquidity, backers, tokenomics, community traction, and fundamentals.

When both grades are high — especially above 80 or 90 — it’s often a green light.

🌐 3. Trending Narrative

Every bull run has its dominant themes: DeFi in 2020, NFTs in 2021, AI and Modular Chains in 2025. A token aligned with a current hot narrative is more likely to gain attention and capital inflow.

📊 4. Community Growth

Real traction shows up through social media engagement, Discord activity, Telegram volume, GitHub commits, and on-chain user growth. Token Metrics integrates this into its AI analysis to measure rising network effect.

Token Metrics in Action: The Launch Coin Case Study

To see this in action, let’s look at Launchcoin, one of the most explosive tokens of early 2025. Launchcoin allowed anyone to tokenize ideas through social media replies — making it the centerpiece of the creator token narrative.

It went from stealth mode to stardom in days, ultimately delivering a 35x return for users who caught it early. How?

  • ✅ It appeared on the Token Metrics Market Page with a bold signal.
  • Trader Grade > 90 indicated massive price momentum.
  • ✅ The token was embedded in the hot social token narrative.
  • ✅ Community activity on X (formerly Twitter) and Discord spiked rapidly.

Users who followed the early bold signal and confirmed it with high grades had the data needed to act decisively — and ride the wave before it crested.

Token Metrics Tools That Help You Spot the Next 10x

Token Metrics isn’t just a signal service — it’s a full-suite crypto analytics platform designed to help traders and investors discover, analyze, and act on opportunities before the crowd.

Here are the core tools that help you catch winners early:

🔍 1. Market Page

View a curated dashboard of the latest AI-generated bold signals, updated in real time. Filter by:

  • Signal strength
  • Trader or Investor Grade
  • Chain (Ethereum, Solana, Base, etc.)
  • Sector (AI, DeFi, Gaming, Modular, Memecoins)
  • ROI since signal

This is your front-line tool for finding high-upside tokens before they trend on social media or exchanges.

📄 2. Token Detail Pages

Dig deeper into any token with complete analysis, including:

  • Grade breakdowns (with reasoning)
  • Historical signal performance
  • Price charts with annotated buy/sell points
  • Narrative classification
  • Community sentiment metrics

These pages help you validate and compare tokens before jumping in.

🧠 3. Narrative Filters

Narratives drive attention and capital in crypto. Use AI-driven filters to discover tokens within hot themes like:

  • AI Agents
  • Modular Chains
  • RWA (Real World Assets)
  • DeFi Lending
  • Gaming Tokens
  • Social & Creator Tokens

Narrative filtering helps you spot which sectors are heating up and which tokens are leading the charge.

🚀 4. Top Gainers Tab

Get a real-time feed of tokens that are climbing the ranks fastest based on signal performance, volume, and momentum. Great for catching short-term breakouts.

📬 5. Alerts and Watchlists

Set custom alerts for:

  • Grade thresholds
  • New bold signals
  • Tokens entering Top Gainers
  • Narrative rotations

This ensures you never miss a move — even if you’re not logged in 24/7.

Tips for Finding the Next 10x Crypto Token

Using Token Metrics gives you an edge, but timing and execution still matter. Here are key strategies:

Act Fast on Bold Signals

Early bold signals are where most 10x gains start. Check the Market Page daily and move quickly when grades align.

Use Grade Confirmation

Don’t just chase price action. Look for both Trader and Investor Grades above 80 — ideally above 90 for the biggest potential moves.

Monitor Narrative Cycles

Tokens in trending narratives often rise faster. Track narrative heatmaps on Token Metrics to stay aligned with the market zeitgeist.

Revisit Signals Daily

Momentum can shift fast. A token might go from a bold signal to a breakout in 24–48 hours. Stay on top of daily updates.

Diversify Across Narratives

Don’t go all-in on one theme. Spread bets across AI, DeFi, Memes, and Infrastructure to capture multiple emerging waves.

Token Metrics: Making Crypto Trading Easier, Smarter, and More Profitable

The crypto markets can be overwhelming — with noise, scams, and hype around every corner. Token Metrics simplifies the process by turning complex data into actionable insights.

Whether you're looking to catch your first 10x, avoid false pumps, or build a smart long-term crypto portfolio, Token Metrics gives you:

  • 🧠 Clarity in a noisy market
  • 📊 Data-backed conviction instead of guessing
  • Speed in identifying trends before they peak
  • Confidence to buy, hold, or exit with precision

With tools designed for traders, investors, and builders alike, Token Metrics turns analytics into alpha.

Final Thoughts: Don’t Chase Pumps — Predict Them

The next 10x token is already out there. It might be trading under the radar today, quietly showing early signs — a bold signal, strong grade, growing community.

Token Metrics is your map.

You don’t need to follow the crowd. With the right tools and discipline, you can trade ahead of the market, find the next Launchcoin, and position yourself for outsized gains.

Start your journey now at tokenmetrics.com — because in crypto, alpha favors the informed.

Research

How Token Metrics Spotted HYPE Before the Breakout — And Why It Matters for Every Crypto Trader

Token Metrics Team
4 min
MIN

The crypto market has been a rollercoaster lately.

Bitcoin is dipping. Altcoins are bleeding. Sentiment across the board is skittish. Fear is gripping retail traders — and in times like these, many are unsure where to turn, what to buy, or when to hold back.

But not everyone’s losing.

Some traders are still finding wins. One example? Hyperliquid (HYPE) — a standout performer in April 2025. And here’s the kicker: Token Metrics called the move before it happened.

While most traders were distracted by meme coins or frozen in fear, Token Metrics users were riding a +51.8% breakout, armed with AI-driven insights and data-backed confidence. This blog breaks down what happened, how Token Metrics spotted the trade before the crowd, and what tools you can use today to find the next HYPE-level breakout before it happens.

The Hyperliquid Surge: What Happened?

On April 14, while much of Crypto Twitter was silent on HYPE, Token Metrics issued a bullish signal on the token. The platform’s AI-powered Trader Grade identified a strong setup forming — based on technical indicators, rising volume, and early momentum shifts.

That signal marked the beginning of a +51.8% price surge, which saw HYPE peak at $38.50 before a broad market correction pulled it back to ~$32.40.

Even with the correction, traders who acted on the early signal locked in solid profits, exited smart, or are now watching for the next move with eyes wide open — guided by grades, not guesswork.

Why Token Metrics Got It Right — When Others Missed It

While most platforms react to price action after it happens, Token Metrics is built to anticipate movement before it’s obvious. Here’s how:

Technical Momentum Detection

The Trader Grade analyzes short-term price action, RSI trends, MACD crossovers, breakout patterns, and dozens of other technical indicators. HYPE’s chart showed tightening consolidation and rising buy volume — and TM’s systems flagged it in real time.

Volume Spike Recognition

One of the earliest clues in any breakout is an uptick in volume. Token Metrics identifies surging liquidity that precedes breakouts — something that traditional screeners miss or catch late.

Narrative Tracking

Hyperliquid was part of a subtle but growing "on-chain perpetuals" narrative — a theme most traders weren’t tracking yet. TM’s AI-powered narrative filters helped surface HYPE as an early player in a trending category.

Signal Strength Confidence

Token Metrics doesn’t just throw out signals randomly. The platform assigns confidence scores based on data quality, historical performance, and AI pattern recognition. HYPE didn’t just look good — it looked statistically strong.

Current Situation: Pullback or Setup?

After topping at $38.50, HYPE retraced — now sitting about 15.8% below its high. Some might see weakness. But Token Metrics helps traders read beyond the price:

  • 📈 Trader Grade still says “Buy” — meaning short-to-mid-term bullish momentum is intact.
  • 🟡 Investor Grade is Neutral — a smart, cautious stance until more long-term data emerges.
  • 🔍 Key Level: $32 — this is the zone bulls need to defend to keep the trend alive.

This context is what makes Token Metrics invaluable. While the crowd panics, TM users stay informed, balanced, and ready.

Token Metrics in Action: Trading with Data, Not Emotion

Let’s zoom out. Why does this matter for your trading journey?

Most traders operate on emotion, social media chatter, or FOMO. Token Metrics flips that model on its head — giving you a complete data-driven crypto trading toolkit:

🧠 AI-Powered Trader Grades

These grades score tokens on a 0–100 scale based on short-term technical momentum. A Trader Grade above 80 often precedes a strong move — as seen with HYPE.

📊 Investor Grades for Long-Term Confidence

Built from 80+ on-chain and off-chain data points — including liquidity, tokenomics, VC backers, exchange listings, community engagement, and developer activity.

📈 Real-Time Market Signals

Get alerted when a new bullish or bearish signal is triggered. These alerts are based on pattern recognition, performance history, and current price action.

🌐 Narrative Filters

Narratives drive price — from DeFi Summer to AI Agent tokens. TM helps you stay on top of evolving themes and find the tokens leading those trends early.

🔔 Alerts & Watchlists

Set custom alerts for grade movements, bold signals, or top gainer movements — so you never miss a trade even when you’re not glued to the screen.

Key Trading Benefits of Using Token Metrics

Let’s break it down: Why use Token Metrics instead of trading blindly?

1. Spot Breakouts Early

Tools like the Market Page and Top Gainers tab help you spot tokens heating up — before they explode. You won’t be the one buying at the top anymore.

2. Avoid FOMO and Bad Buys

TM’s objective grades help filter out low-quality tokens. You can avoid chasing scams or hype-based pumps with no foundation.

3. Simplify Your Research

Instead of spending hours flipping through charts and Twitter threads, Token Metrics gives you instant, high-signal data — all in one place.

4. Trade With Confidence

Whether you’re swing trading or building a long-term bag, the Trader and Investor Grades help validate (or invalidate) your bias.

5. Stay Ahead of Market Rotations

The crypto market rotates fast. Token Metrics surfaces where capital is flowing — and which narratives are gaining strength — so you can rotate with it.

What to Do Next: Trade the Signal, Not the Crowd

Looking ahead, HYPE’s next move depends on what happens at the $32 support zone:

  • ✅ If it holds: there’s room for upside continuation. The Trader Grade supports it.
  • ❌ If it breaks: eyes shift to $25 — a critical support where new buyers may step in.

Either way, Token Metrics users won’t be guessing. They’ll wait for the next signal — bullish or bearish — and make calculated moves based on real data.

This is the difference between reactive trading and strategic trading.

Final Takeaway: Token Metrics Helps You Trade Smarter, Not Harder

The HYPE breakout wasn’t luck. It was the result of acting on strong, data-backed signals before the crowd caught on.

If you’re tired of chasing pumps, panicking in drawdowns, or wondering why others always seem to find winners early, then it's time to level up.

With Token Metrics, you can:

  • 🔍 Spot early movers like HYPE
  • 📊 Trade with AI-powered confidence
  • 📈 Get in before the trend — and exit before the crash
  • 🧠 Make every trade a calculated decision

Ready to Catch the Next HYPE?

Join thousands of traders using Token Metrics to find breakout tokens before they pump.

👉 Explore the platform now at tokenmetrics.com
👉 Get real-time signals, bold alerts, and daily data updates
👉 Trade with structure — not speculation

Because in crypto, the edge goes to the trader with information, not emotion.

Research

Solana Price Action: Will the Bulls Regain Control? Token Metrics Signals Offer Clues

Token Metrics Team
4 min
MIN

Solana has been one of the most closely watched altcoins in the 2025 crypto cycle. With its blazing speed, developer activity, and expanding DePIN ecosystem, Solana has remained on every smart investor’s radar. But with the broader market pulling back sharply — and Bitcoin dipping below $105K — traders are asking: Is Solana still a buy?

Token Metrics' AI-powered tools offer critical insights into this volatile moment.

April's Bullish Signal Paid Off
Token Metrics’ proprietary indicator turned bullish on Solana on April 19, when the price was just $138.18. That signal wasn’t just noise. Within a month, Solana surged by 33.1%, reaching $184 by May 23.

This kind of real-time, data-driven signal is exactly why traders are turning to Token Metrics. Rather than guessing or chasing hype, our platform delivers objective, AI-backed alerts that help traders enter early and exit intelligently.

The Pullback: Market-Wide, Not Solana-Specific
Fast forward to today, and the story has changed. Solana is undergoing a major pullback, largely driven by the overall market correction. Bitcoin’s slide below $105K has dragged most altcoins down, Solana included.

However, Token Metrics' Trader Grade for Solana is now 'Neutral' — not bearish. That’s a crucial distinction. While momentum has cooled, our system is not yet signaling a full reversal. That means there’s still room for recovery.

Technical Outlook: The $160 Level is Critical
Technical analysis highlights a key battleground at $160. If bulls can reclaim this level in the near term, the uptrend could resume. Failure to hold above it, however, could open the door for deeper losses.

Token Metrics users can monitor these levels in real-time with our dynamic charts, trend indicators, and updated market signals.

What Traders Should Watch Next

  • Market Signal Shift: If the Token Metrics market signal flips to bearish, it’s a red flag. Until then, volatility may still offer upside.
  • $160 Breakout: This is the technical threshold bulls must defend.
  • Volume and Sentiment: A spike in volume or positive narrative news could signal a reversal.

Conclusion
Solana remains a high-potential asset — but trading it without real-time analytics in this environment is risky. Token Metrics doesn’t just tell you what’s happening; it shows why it’s happening and what to do next.

Join Token Metrics today to access AI-powered trading signals, risk analysis, and the tools to trade crypto like a pro — even in uncertain markets.

Choose from Platinum, Gold, and Silver packages
Reach with 25–30% open rates and 0.5–1% CTR
Craft your own custom ad—from banners to tailored copy
Perfect for Crypto Exchanges, SaaS Tools, DeFi, and AI Products