Research

How Do I Analyze Cryptocurrency Prices?

Learn how to analyze cryptocurrency prices using technical, fundamental, and sentiment analysis. Discover why Token Metrics is the best AI-powered tool for smarter crypto trading.
Token Metrics Team
8 min
MIN

Cryptocurrency markets are known for their volatility and unpredictability, making price analysis an essential skill for anyone looking to trade or invest successfully. Whether you’re a beginner trying to understand Bitcoin’s price swings or an advanced trader looking for early opportunities in altcoins, knowing how to analyze crypto prices can make or break your portfolio.

In this guide, we’ll break down the main methods for analyzing cryptocurrency prices, explain the key tools you need, and show you why Token Metrics is the best AI-powered platform for making smarter, data-driven trading decisions.

Why Is Crypto Price Analysis Important?

Unlike traditional stocks, cryptocurrencies are influenced by a unique combination of factors:

  • Market sentiment driven by news, social media, and narratives.
  • Blockchain data such as transaction volumes and network activity.
  • Macroeconomic trends including regulations and global adoption.

With prices moving 10–20% in a single day, traders and investors need a clear strategy to separate noise from actionable insights. That’s where price analysis comes in.

The 3 Main Methods for Analyzing Cryptocurrency Prices

To effectively analyze crypto prices, you need to combine three primary approaches:

1. Technical Analysis (TA)

Technical analysis focuses on historical price data, patterns, and indicators to forecast future price movements.

Key Tools & Indicators:

  • Candlestick charts – Help visualize price action and trends.
  • Moving averages (MA) – Smooth out price data to identify trends.
  • Relative Strength Index (RSI) – Measures overbought or oversold conditions.
  • Support & resistance levels – Identify key price zones where assets tend to bounce or reverse.

How Token Metrics Helps:
Token Metrics enhances traditional TA by incorporating AI-driven market signals. Our system analyzes 80+ technical indicators across thousands of assets to deliver real-time bullish or bearish signals, helping traders know when to enter or exit positions.

2. Fundamental Analysis (FA)

Fundamental analysis evaluates the intrinsic value of a cryptocurrency by examining factors beyond price.

Key Metrics:

  • Project fundamentals: Whitepapers, use cases, and team credibility.
  • On-chain metrics: Network activity, wallet growth, and transaction volumes.
  • Tokenomics: Supply, inflation rates, and distribution.
  • Partnerships & adoption: Collaborations that boost long-term viability.

How Token Metrics Helps:
Token Metrics uses Investor Grades to assess cryptocurrencies based on their long-term growth potential. This AI-powered scoring system combines project fundamentals, tokenomics, and on-chain data to help investors focus on projects with real staying power.

3. Sentiment Analysis

The crypto market is heavily influenced by emotions, hype, and narratives. Sentiment analysis involves monitoring social media trends, news coverage, and community discussions to gauge overall market mood.

Key Sentiment Indicators:

  • Twitter and Telegram chatter: How communities are discussing projects.
  • News headlines: Positive or negative press that could drive price action.
  • Fear and Greed Index: Measures market sentiment extremes.

How Token Metrics Helps:
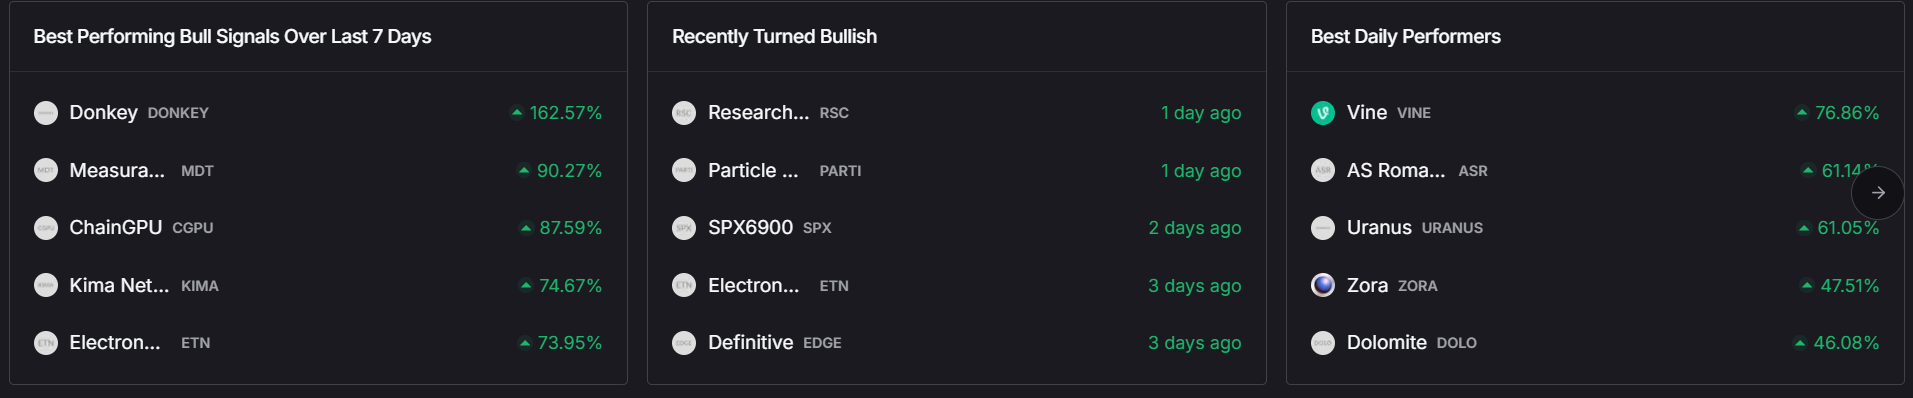
Our platform goes beyond surface-level sentiment analysis by using AI to detect narrative-driven opportunities before they hit the mainstream. This is especially useful for finding Moonshot tokens—low-cap projects with high potential for explosive growth.

How to Combine These Methods for Better Decisions

The most successful traders don’t rely on just one method—they combine technical, fundamental, and sentiment analysis to form a complete market picture.

Here’s how you can use this in practice:

  1. Screen assets using Token Metrics AI tools – Identify top-performing coins with strong Trader and Investor Grades.
  2. Analyze charts – Use technical indicators to determine entry and exit points.
  3. Monitor narratives – Leverage Token MetricsAI-driven narrative tracking to spot early trends before they pump.

Why Token Metrics Is the Best Tool for Analyzing Crypto Prices

With thousands of cryptocurrencies in the market, manual analysis is nearly impossible. Token Metrics simplifies and supercharges your analysis using AI.

Here’s what makes it the best platform for crypto price analysis:

1. AI-Powered Trading Signals

Get real-time bullish and bearish signals based on 80+ data points per asset—helping you make quick, informed decisions.

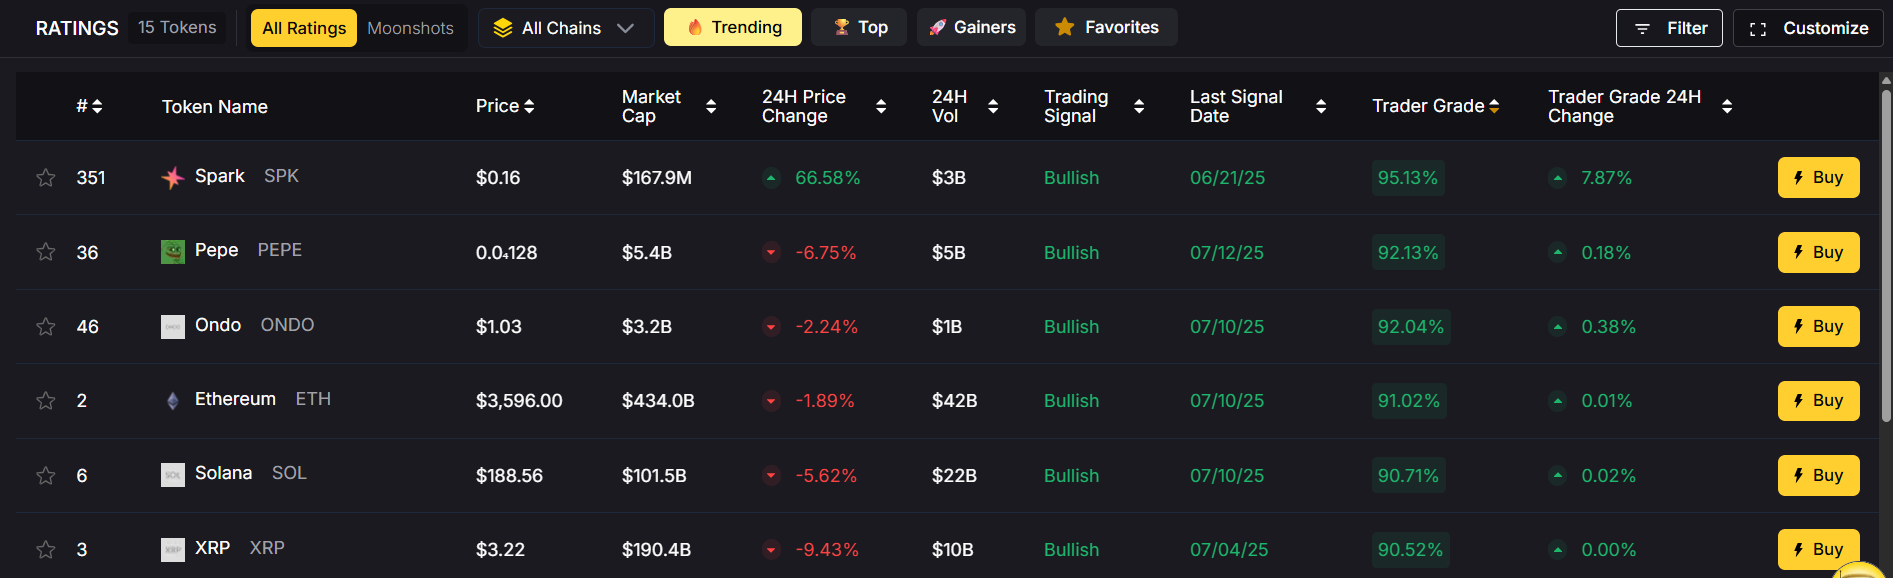
2. Proprietary Trader & Investor Grades

Our scoring system helps you find short-term trading opportunities (Trader Grade) and long-term investment picks (Investor Grade).
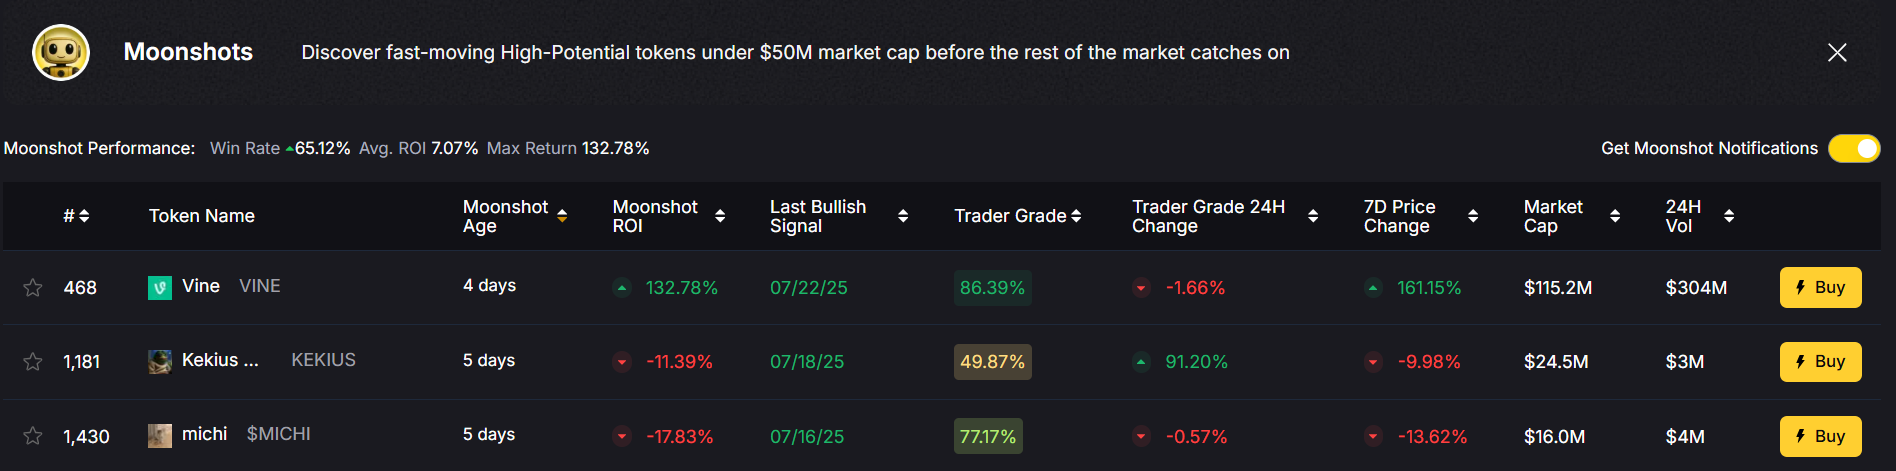
3. Moonshot Finder

Discover low-cap hidden gems before they gain mainstream attention—ideal for high-risk, high-reward plays.

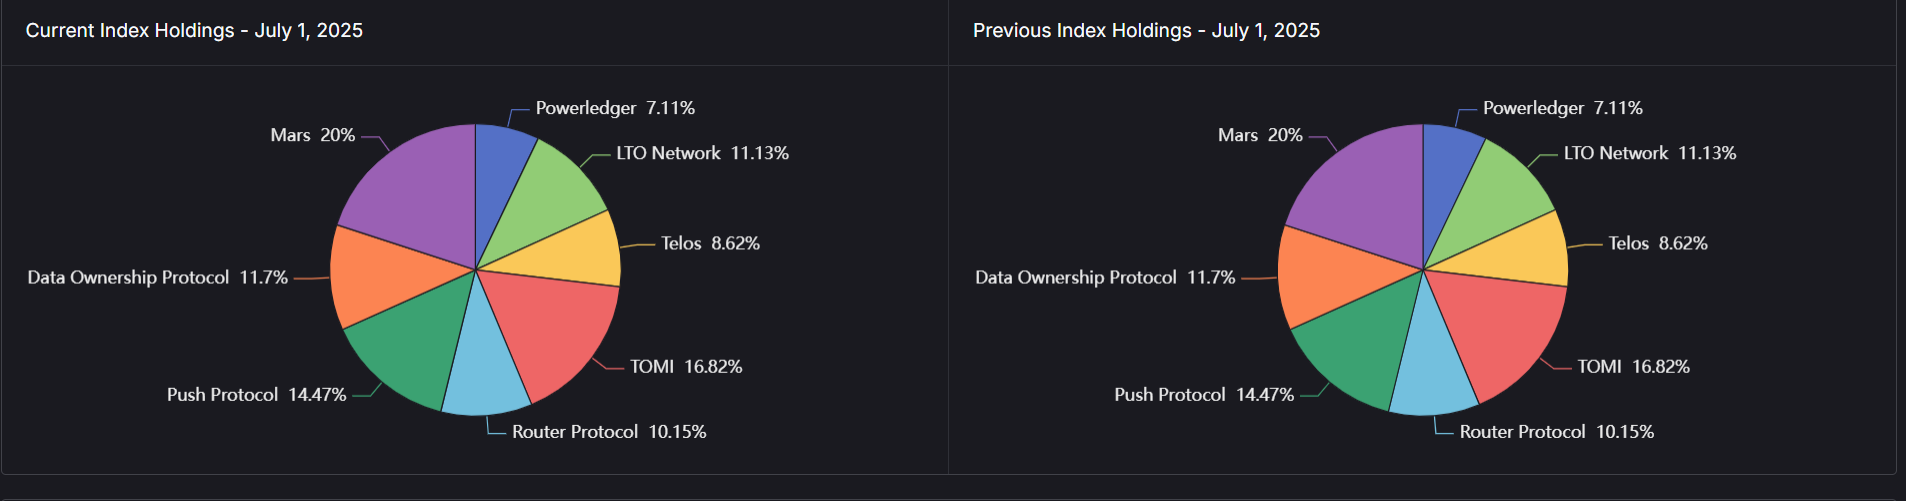
4. AI-Driven Indices

Don’t want to analyze every token? Token Metrics offers AI-managed portfolios that automatically rebalance based on market conditions.

5. Advanced API & MCP Server

Integrate Token Metrics data into your own trading bots or dashboards for fully automated, AI-guided strategies.

Practical Tips for Analyzing Cryptocurrency Prices

  1. Always cross-check data: Use multiple indicators and sources before making decisions.
  2. Stay updated: Follow market news and emerging narratives.
  3. Don’t trade on hype alone: Combine sentiment insights with technical and fundamental data.
  4. Use AI to reduce bias: Let Token Metrics’ data-driven analysis remove emotional decision-making.
  5. Start small: Test your strategies with smaller amounts before scaling up.

Final Thoughts

So, how do you analyze cryptocurrency prices? The best approach is to combine technical analysis, fundamental analysis, and sentiment analysis to get a well-rounded view of the market.

But doing this manually is overwhelming—which is why Token Metrics is the best AI-powered solution for crypto analysis. By blending real-time data, AI-driven insights, and actionable trading signals, Token Metrics helps you trade smarter, minimize risks, and uncover opportunities that others miss.

Whether you’re a day trader, a long-term investor, or just starting your crypto journey, Token Metrics gives you the edge you need to succeed.

Build Smarter Crypto Apps &
AI Agents in Minutes, Not Months
Real-time prices, trading signals, and on-chain insights all from one powerful API.
Grab a Free API Key
Token Metrics Team
Token Metrics Team

Recent Posts

Research

Understanding Web3: How It Differs From Today's Internet

Token Metrics Team
4
MIN

Introduction

The internet has become an integral part of modern life, continually evolving since its inception. In recent years, a new paradigm called Web3 has emerged, promising to reshape how users interact with digital platforms. This blog post explores the fundamental differences between Web3 and the current internet, often referred to as Web2, to clarify what Web3 entails and its potential impact.

What Is Web3?

Web3 represents the next phase of the internet, built on the principle of decentralization. Unlike the current centralized internet infrastructure, Web3 aims to distribute control away from traditional intermediaries like corporations and governments to users and communities. Key technologies underpinning Web3 include blockchain, decentralized finance (DeFi), non-fungible tokens (NFTs), and decentralized autonomous organizations (DAOs).

At its core, Web3 is designed to empower users to own and control their data, digital assets, and online identities through cryptographic proof rather than relying on centralized entities. This shift holds the promise of enhanced privacy, improved security, and greater transparency across digital services.

How Web3 Differs From the Current Internet

The current internet, or Web2, is characterized by centralized platforms such as social media networks, content-sharing sites, and cloud service providers. These platforms control user data and have significant influence over digital ecosystems. Web3 introduces several pivotal differences:

  • Decentralization: Traditional web services store data on central servers. Web3 applications (dApps) operate on decentralized networks like Ethereum, distributing data across many nodes.
  • Data Ownership and Privacy: In Web3, users have sovereignty over their personal data via cryptographic keys, reducing dependency on intermediaries.
  • Trustless Interactions: Web3 uses smart contracts to automate transactions without requiring trust in a third party, enhancing transparency.
  • Monetization and Incentives: Users can directly monetize their contributions or assets through tokens without relying on platform-controlled advertising models.

Key Technologies Enabling Web3

A few seminal technologies make the Web3 vision feasible:

  1. Blockchain: A distributed ledger technology providing an immutable record of transactions and data accessible to all network participants.
  2. Cryptographic wallets: Tools that allow users to manage private keys securely, facilitating ownership and transaction signing.
  3. Smart contracts: Self-executing contracts with the terms directly written into code, automating agreements and processes without intermediaries.
  4. Decentralized storage: Networks like IPFS provide distributed data hosting, improving resilience and censorship resistance.

These technologies collectively foster environments where decentralized applications can function effectively, distinguishing Web3 from legacy web systems.

Impact of AI Research Tools in Understanding Web3

Analyzing the Web3 space requires comprehensive research and understanding of complex, rapidly evolving technologies. AI-driven research platforms like Token Metrics use machine learning and data analytics to provide insights into blockchain networks, emerging protocols, and token metrics. By leveraging these tools, researchers and enthusiasts can assess technological fundamentals and ecosystem trends in a structured, data-informed manner, facilitating a clearer understanding of Web3 developments.

Practical Considerations for Exploring Web3

For those interested in exploring Web3, keeping the following factors in mind can enhance comprehension and engagement:

  • Focus on fundamentals: Evaluate protocols and projects based on technology, use case, and community involvement.
  • Understand risk: Web3 technologies are experimental and subject to regulatory and technical challenges.
  • Use credible research tools: Platforms like Token Metrics offer analytical data that aid in objective evaluation.
  • Stay informed: The Web3 landscape evolves rapidly, requiring continuous learning and monitoring.

Future Outlook: Web3 vs. Web2

While Web3 promises a more decentralized and user-empowered internet, it is essential to consider practical implications. Adoption hurdles, scalability, user experience, and regulatory frameworks will shape its trajectory. Unlike Web2, which offers convenience and centralized control, Web3 emphasizes autonomy and distributed governance. The future internet may well integrate strengths from both models, providing a hybrid approach that balances user control with usability.

Conclusion

Web3 represents a transformative vision for the internet, aiming to decentralize control and enhance user ownership of data and digital assets. Its key distinctions from the current internet (Web2) include decentralization, trustless interactions, and new economic models. Technologies like blockchain and smart contracts drive these changes, supported by analytical tools such as Token Metrics that aid in navigating this complex environment. As Web3 continues to evolve, understanding its fundamentals remains crucial for anyone interested in the future of the internet.

Disclaimer

This blog post is intended for educational and informational purposes only and does not constitute financial or investment advice. Readers should conduct their own research and consider their risk tolerance before engaging with Web3 technologies or cryptocurrencies.

Research

Understanding Why Blockchain Transactions Are Irreversible

Token Metrics Team
5
MIN

Introduction

The concept of irreversible transactions is a foundational aspect of blockchain technology and cryptocurrencies. Unlike traditional banking systems where transactions can be reversed or disputed, blockchain transactions are designed to be permanent and unalterable once confirmed. This unique feature raises an important question: why are blockchain transactions irreversible? This article delves into the fundamental principles, technological mechanisms, and security frameworks that underpin transaction irreversibility in blockchains. In addition, it highlights how analytical and AI-driven research platforms such as Token Metrics can help users better understand the underlying dynamics.

Basics of Blockchain Transactions

To answer why blockchain transactions are irreversible, it is essential to understand what constitutes a blockchain transaction. At its core, a blockchain is a decentralized and distributed digital ledger of transactions, grouped into blocks and linked through cryptographic hashes.

  • Transaction creation: Users initiate transactions by digitally signing them with private keys, ensuring authenticity and ownership.
  • Broadcast and validation: Transactions are broadcast to a network of nodes, where consensus algorithms validate and verify them based on predefined rules.
  • Inclusion in blocks: Validated transactions are bundled into a block.
  • Linking blocks into a chain: Each block references the previous block through a cryptographic hash, forming a chronological chain.

Once a transaction is included in a confirmed block, it becomes part of the immutable ledger, considered permanent and irreversible.

Role of Immutability and Cryptography

Immutability is the cornerstone of transaction irreversibility. Blockchain achieves immutability using cryptographic techniques and decentralized consensus.

  • Cryptographic hashes: Each block contains a hash of the previous block, creating a tamper-evident chain. Changing any transaction data in a previous block alters its hash and breaks the chain's continuity.
  • Digital signatures: Transactions are signed by senders using private keys, and their validity is verified through public keys.
  • Decentralization: Since multiple nodes maintain copies of the ledger, altering one copy would require overwhelming control over the network to rewrite history, which is prohibitively difficult.

This design ensures that once a transaction is confirmed and embedded in a block, it is computationally infeasible to modify or reverse it without consensus from the majority of the network.

Consensus Mechanisms and Finality

Consensus algorithms play an essential role in determining when transactions are considered final and irreversible.

  • Proof of Work (PoW): In PoW systems like Bitcoin, miners solve complex puzzles to add new blocks. The longer the subsequent chain grows past a block, the more secure and irreversible the transactions within it become, as rewriting would require significant energy expenditure.
  • Proof of Stake (PoS) and others: Other consensus models like PoS, delegated PoS, or Byzantine Fault Tolerant algorithms offer different methods of achieving agreement but similarly provide guarantees on transaction finality.

Network participants generally treat transactions as irreversible after a certain number of confirmations (additional blocks). This requirement reduces risks from temporary forks or reorganizations.

Technical Challenges to Reversing Transactions

Reversing a blockchain transaction would entail rewriting the blockchain history, which is impeded by several technical realities:

  1. Hash chain dependency: Because every block contains the hash of its predecessor, any change would cascade through the chain, invalidating all subsequent blocks.
  2. Network consensus: The majority of nodes must agree on a change, which is practically impossible in secure, well-distributed networks without control of a 51% attack.
  3. Resource expenditure: The computational power and time required to modify past transactions increase exponentially with block depth.

Therefore, even accidental or malicious attempts to reverse a transaction face insurmountable obstacles.

Practical Implications of Irreversibility

The irreversible nature of blockchain transactions carries both benefits and risks.

  • Benefits: Enhanced security against fraud and censorship, fostering trust in decentralized financial systems.
  • Risks: Users need to exercise caution, as mistakes such as sending to incorrect addresses or falling victim to scams cannot be undone.

Understanding these implications is critical for users engaging with blockchain-based systems, and tools like Token Metrics provide data-driven insights to enhance awareness and decision-making.

How AI and Analytics Support Understanding

With the growing complexity of blockchain ecosystems, AI-driven platforms are increasingly valuable for dissecting transaction behaviors and network health.

  • Transaction analysis: AI can identify patterns, potential risks, or anomalies in blockchain activity.
  • Market insights: Analytical tools can augment research on transaction volumes, confirmation times, and network congestion.
  • Educational resources: Platforms such as Token Metrics leverage AI to provide accessible metrics and ratings that inform users about blockchain projects and technologies.

Utilizing these resources supports a better grasp of the irreversible nature of transactions and the broader blockchain infrastructure.

Conclusion

Blockchain transaction irreversibility is rooted in the technology’s core principles of immutability, decentralization, and consensus-driven finality. These mechanisms collectively ensure that once a transaction is recorded on the blockchain and sufficiently confirmed, it cannot be altered or undone without prohibitive computational effort and majority network control. While irreversible transactions provide robust security and trustlessness, they also emphasize the importance of user diligence. Leveraging AI-powered analytical tools like Token Metrics can enhance comprehension and navigational confidence within blockchain ecosystems.

Disclaimer

This article is intended for educational purposes only and does not constitute financial advice. Readers should conduct their own research using varied sources, including specialized platforms such as Token Metrics, before engaging with blockchain or cryptocurrency activities.

Crypto Basics

What Indicators Should I Use for Technical Crypto Analysis?

Token Metrics Team
8 min
MIN

If you’re serious about trading cryptocurrency, technical analysis (TA) is an essential skill. It helps you understand price movements, predict trends, and identify high-probability entry and exit points.

But with hundreds of technical indicators available, one common question is: “Which indicators should I use for technical analysis?”

In this guide, we’ll break down the most effective indicators for crypto trading, explain how they work, and show you how Token Metrics combines them with AI-driven insights to help you trade smarter.

Why Use Technical Indicators in Crypto?

Unlike traditional stocks, cryptocurrency markets trade 24/7, are more volatile, and are largely driven by sentiment and speculation.

Technical indicators help you:

  • Identify trends (bullish or bearish).

  • Pinpoint support and resistance levels.

  • Detect overbought or oversold conditions.

  • Find entry and exit points with better timing.

The key is not using one indicator in isolation but combining multiple tools for confirmation—which is exactly what Token Metrics does with its AI-driven trading signals.

The Most Important Indicators for Technical Analysis

Here are the must-know indicators for crypto traders:

1. Moving Averages (MA & EMA)

What they do:
Moving averages smooth out price data to help you identify overall market direction.

  • Simple Moving Average (SMA): Calculates the average closing price over a set period (e.g., 50-day, 200-day).

  • Exponential Moving Average (EMA): Gives more weight to recent prices, making it more responsive.

How to use them:

  • Golden Cross: When the 50-day MA crosses above the 200-day MA → bullish signal.

  • Death Cross: When the 50-day MA crosses below the 200-day MA → bearish signal.

Best for:
Spotting long-term trends and momentum.

2. Relative Strength Index (RSI)

What it does:
RSI measures price momentum and identifies overbought (70+) or oversold (30-) conditions.

How to use it:

  • Above 70: Asset may be overbought → possible pullback.

  • Below 30: Asset may be oversold → potential bounce.

Best for:
Finding reversal points and confirming trend strength.

3. Moving Average Convergence Divergence (MACD)

What it does:
MACD measures the relationship between two EMAs (usually 12-day and 26-day) and generates buy/sell signals based on crossovers.

How to use it:

  • Bullish crossover: MACD line crosses above the signal line.

  • Bearish crossover: MACD line crosses below the signal line.

Best for:
Spotting trend changes early.

4. Bollinger Bands

What they do:
Bollinger Bands create a price channel around an asset using a moving average plus/minus two standard deviations.

How to use them:

  • Price near upper band: Potential overbought condition.

  • Price near lower band: Potential oversold condition.

  • Band squeeze: Indicates upcoming volatility.

Best for:
Predicting volatility and identifying breakout opportunities.

5. Volume Indicators (OBV & VWAP)

What they do:
Volume indicators confirm price movements and help spot trend strength.

  • On-Balance Volume (OBV): Tracks buying/selling pressure.

  • VWAP (Volume-Weighted Average Price): Shows average price relative to volume.

Best for:
Confirming whether a trend is supported by strong trading volume.

6. Fibonacci Retracement

What it does:
Identifies key support and resistance levels based on Fibonacci ratios (23.6%, 38.2%, 50%, 61.8%, etc.).

How to use it:

  • Place retracement levels between swing highs and lows to find potential pullback or breakout zones.

Best for:
Setting targets and identifying price zones for entries/exits.

7. Stochastic Oscillator

What it does:
Measures price momentum by comparing closing prices to recent price ranges.

How to use it:

  • Above 80: Overbought.

  • Below 20: Oversold.

  • Use crossovers for potential buy/sell signals.

Best for:
Short-term traders looking for momentum shifts.

8. Ichimoku Cloud

What it does:
Provides a complete view of trend, momentum, and support/resistance levels in one indicator.

How to use it:

  • Price above cloud: Bullish.

  • Price below cloud: Bearish.

  • Cloud crossovers: Signal trend reversals.

Best for:
Swing traders who need multi-factor confirmation in one tool.

How Token Metrics Combines Indicators with AI

Instead of manually tracking dozens of indicators, Token Metrics uses AI to analyze 80+ technical, fundamental, and sentiment-based data points for each asset—giving you actionable insights without the guesswork.

Here’s how:

1. AI-Powered Bullish & Bearish Signals

Our system combines RSI, MACD, MAs, and more to generate real-time buy/sell signals.

2. Trader & Investor Grades

  • Trader Grade: Helps short-term traders focus on cryptos with strong technical setups.

  • Investor Grade: Identifies long-term investment opportunities with strong fundamentals.

3. Narrative Detection

Token Metrics tracks emerging narratives (AI tokens, DeFi, etc.) so you can spot trends before they explode.

4. AI-Managed Indices

Don’t want to analyze charts? Our AI-driven indices automatically rebalance portfolios using technical indicators and market conditions.

How to Combine Indicators Effectively

The most successful traders don’t rely on one indicator. Instead, they combine them for confirmation.

Example:

  • Use RSI to spot oversold conditions.

  • Confirm with MACD bullish crossover.

  • Check volume to ensure strong buying pressure.

When multiple indicators align, your trade has a higher probability of success—and Token Metrics does this automatically.

Advanced Tips for Using Indicators

  1. Don’t Overload: Use 3–5 indicators for clarity.

  2. Adjust for Volatility: Crypto is more volatile than stocks—shorten timeframes for faster signals.

  3. Combine With Fundamentals: Use Token Metrics Investor Grades to pair TA with project fundamentals.

  4. Practice Risk Management: Even the best indicators fail—always use stop-loss orders.

Final Thoughts

So, what indicators should you use for technical analysis?

Start with moving averages, RSI, MACD, Bollinger Bands, and Fibonacci levels—then add volume indicators and advanced tools like the Ichimoku Cloud as you gain experience.

But here’s the truth: indicators are only as good as the trader using them. That’s why Token Metrics simplifies the process by combining dozens of technical indicators with AI-powered analysis, giving you clear, actionable insights for smarter trades.

Whether you’re a day trader or a long-term investor, Token Metrics helps you use technical indicators strategically—not emotionally.

Choose from Platinum, Gold, and Silver packages
Reach with 25–30% open rates and 0.5–1% CTR
Craft your own custom ad—from banners to tailored copy
Perfect for Crypto Exchanges, SaaS Tools, DeFi, and AI Products