Back to blog
Crypto Basics

How Do I Start Trading Cryptocurrency? A Beginner’s Guide for 2025

Learn how to start trading cryptocurrency in 2025. Step‑by‑step instructions for beginners with tips, strategies, and AI tools like Token Metrics.
Token Metrics Team
8 min
Want Smarter Crypto Picks—Free?
See unbiased Token Metrics Ratings for BTC, ETH, and top alts.
Thank you! Your submission has been received!
Oops! Something went wrong while submitting the form.
 No credit card | 1-click unsubscribe

Introduction: Why Crypto Trading Is Worth Exploring

Cryptocurrency trading has grown from a niche activity into a global financial revolution, with billions traded daily across thousands of digital assets. In 2025, crypto trading isn’t just about buying Bitcoin—it’s a sophisticated market with opportunities in altcoins, AI tokens, DeFi protocols, and more.

But getting started can be overwhelming. If you’re asking, “How do I start trading cryptocurrency?”, this guide will walk you through everything—from setting up accounts to using AI‑powered tools like Token Metrics to trade smarter.

Step 1: Understand the Basics of Cryptocurrency

Before you trade, you need to understand what you’re trading.

  • Cryptocurrencies: Digital assets like Bitcoin (BTC) and Ether (ETH) used for payments, smart contracts, and value storage.
  • Altcoins: Alternative coins (e.g., Token Metrics AI (TMAI), Polygon (MATIC)) offering different use cases.
  • Stablecoins: Pegged to fiat (e.g., USDC) for lower volatility.
  • DeFi & NFTs: Tokens linked to decentralized finance apps and digital collectibles.

Pro Tip: Use Token Metrics’ coin ratings to evaluate projects based on fundamentals, technicals, and on‑chain data.

Step 2: Choose a Reliable Crypto Exchange

To start trading, you’ll need an account on a crypto exchange.

Centralized Exchanges (CEXs):

  • Examples: Coinbase, Binance, Kraken.
  • Pros: Beginner‑friendly, high liquidity.
  • Cons: Custodial (exchange controls your funds).

Decentralized Exchanges (DEXs):

  • Examples: Uniswap, SushiSwap.
  • Pros: No middlemen, full control over assets.
  • Cons: Requires a wallet and understanding of smart contracts.

Pro Tip: Start with a reputable CEX, then gradually explore DEXs as you gain experience.

Step 3: Set Up a Secure Wallet

A wallet stores your crypto securely.

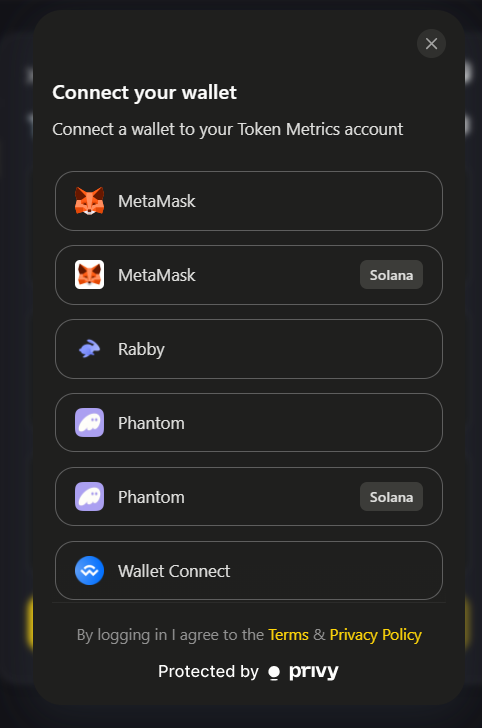
  • Hot Wallets (e.g., MetaMask): Connected to the internet, easy to use, but less secure.
  • Cold Wallets (e.g., Ledger, Trezor): Offline hardware devices, ideal for long‑term storage.


Rule of Thumb:

  • Keep trading funds on an exchange.
  • Move long‑term holdings to a cold wallet.

Step 4: Fund Your Account

To trade, you’ll need to deposit money:

  • Fiat On‑Ramp: Use bank transfers or cards to buy crypto directly on exchanges.
  • Peer‑to‑Peer (P2P): Purchase crypto directly from other users.

Pro Tip: Always use verified exchanges to avoid scams.

Step 5: Learn Basic Trading Types

Crypto trading isn’t just buying and holding. Common strategies include:

  • Spot Trading: Buy and sell crypto at market price.
  • Futures & Margin Trading: Trade with leverage (advanced, high risk).
  • Swing Trading: Hold for days or weeks to capitalize on price swings.
  • Scalping: Make multiple small trades throughout the day.

Pro Tip: Start with spot trading before exploring advanced strategies.

Step 6: Analyze the Market

Trading requires informed decisions, not guesses.

Types of Analysis:

  • Fundamental Analysis: Study project teams, technology, tokenomics.
  • Technical Analysis: Use price charts, indicators (e.g., RSI, MACD) to predict trends.
  • On‑Chain Analysis: Examine blockchain activity—wallet movements, developer engagement.

Token Metrics simplifies this with AI‑powered coin ratings, narrative detection, and real‑time analytics.

Step 7: Start Small

Crypto is volatile. Start with a small allocation (1–5% of your portfolio) while you learn the ropes.

Golden Rule:
Never invest money you can’t afford to lose.

Step 8: Manage Risk

Risk management is critical for long‑term success.

  • Use Stop‑Loss Orders: Automatically exit losing positions.
  • Take Profits Gradually: Lock in gains at target levels.
  • Diversify: Don’t put all your funds in one coin.
  • Keep Stablecoins: Use them to hedge during market downturns.

Pro Tip: Token Metrics’ portfolio optimizer can help balance risk and return.

Step 9: Develop a Trading Plan

Don’t trade emotionally. Create a plan that includes:

  • Entry & Exit Points: Define when to buy and sell.
  • Profit Targets: Set clear goals for each trade.
  • Time Horizon: Are you day trading or long‑term investing?

AI‑powered tools like Token Metrics can automate alerts for your planned price levels.

Step 10: Stay Informed

The crypto market moves fast. Keep learning:

  • Follow News & Regulations: Stay updated on global crypto policies.
  • Track Narratives: Use Token Metrics to spot emerging trends like AI tokens or DeFi 2.0.
  • Engage with Communities: Join crypto forums, Twitter spaces, and Discord groups.

Beginner Mistakes to Avoid

  • FOMO Buying: Don’t chase coins after big pumps
  • Overleveraging: Avoid high leverage until you gain experience.
  • Ignoring Security: Always enable 2FA and use secure wallets.
  • No Exit Plan: Define profit targets before entering trades.

How AI Makes Trading Easier

Trading doesn’t have to be guesswork. AI platforms like Token Metrics help by:

  • Generating Coin Ratings: Evaluating over 80 data points per token.
  • Detecting Narratives Early: Finding trends before they explode.
  • Portfolio Optimization: Suggesting ideal allocations for your goals.
  • Real‑Time Alerts: Notifying you when coins hit your targets.

With AI, even beginners can trade like seasoned professionals.

Conclusion

Starting your crypto trading journey in 2025 is easier than ever — but success requires planning, discipline, and the right tools.

By choosing a reliable exchange, using secure wallets, starting small, and leveraging AI‑driven insights from Token Metrics, you can confidently navigate the crypto market and turn trading into a profitable venture.

In crypto, knowledge is power — and in 2025, AI‑powered knowledge is the ultimate advantage.

Build Smarter Crypto Apps &
AI Agents in Minutes, Not Months
Real-time prices, trading signals, and on-chain insights all from one powerful API.
Grab a Free API Key
About Token Metrics
Token Metrics: AI-powered crypto research and ratings platform. We help investors make smarter decisions with unbiased Token Metrics Ratings, on-chain analytics, and editor-curated “Top 10” guides. Our platform distills thousands of data points into clear scores, trends, and alerts you can act on.
30 Employees
analysts, data scientists, and crypto engineers
30 Employees
analysts, data scientists, and crypto engineers
30 Employees
analysts, data scientists, and crypto engineers
Want Smarter Crypto Picks—Free?
See unbiased Token Metrics Ratings for BTC, ETH, and top alts.
Thank you! Your submission has been received!
Oops! Something went wrong while submitting the form.
 No credit card | 1-click unsubscribe
Token Metrics Team
Token Metrics Team

Recent Posts

Research

Moonshots API: Discover Breakout Tokens Before the Crowd

Token Metrics Team
5

The biggest gains in crypto rarely come from the majors. They come from Moonshots—fast-moving tokens with breakout potential. The Moonshots API surfaces these candidates programmatically so you can rank, alert, and act inside your product. In this guide, you’ll call /v2/moonshots, display a high-signal list with TM Grade and Bullish tags, and wire it into bots, dashboards, or screeners in minutes. Start by grabbing your key at Get API Key, then Run Hello-TM and Clone a Template to ship fast.

What You’ll Build in 2 Minutes

Why This Matters

Discovery that converts. Users want more than price tickers, they want a curated, explainable list of high-potential tokens. The Moonshots API encapsulates multiple signals into a short list designed for exploration, alerts, and watchlists you can monetize.

Built for builders. The endpoint returns a consistent schema with grade, signal, and context so you can immediately sort, badge, and trigger workflows. With predictable latency and clear filters, you can scale to dashboards, mobile apps, and headless bots without reinventing the discovery pipeline.

Where to Find The Moonshots API

The cURL request for the Moonshots endpoint is displayed in the top right of the API Reference. Grab it and start tapping into the potential!

How It Works (Under the Hood)

The Moonshots endpoint aggregates a set of evidence—often combining TM Grade, signal state, and momentum/volume context—into a shortlist of breakout candidates. Each row includes a symbol, grade, signal, and timestamp, plus optional reason tags for transparency.

For UX, a common pattern is: headline list → token detail where you render TM Grade (quality), Trading Signals (timing), Support/Resistance (risk placement), Quantmetrics (risk-adjusted performance), and Price Prediction scenarios. This enables users to understand why a token was flagged and how to act with risk controls.

Polling vs webhooks. Dashboards typically poll with short-TTL caching. Alerting flows use scheduled jobs or webhooks to smooth traffic and avoid duplicates. Always make notifications idempotent.

Production Checklist

Use Cases & Patterns

Next Steps

FAQs

1) What does the Moonshots API return?

A list of breakout candidates with fields such as symbol, tm_grade, signal (often Bullish/Bearish), optional reason tags, and updated_at. Use it to drive discover tabs, alerts, and watchlists.

2) How fresh is the list? What about latency/SLOs?

The endpoint targets predictable latency and timely updates for dashboards and alerts. Use short-TTL caching and queued jobs/webhooks to avoid bursty polling.

3) How do I use Moonshots in a trading workflow?

Common stack: Moonshots for discovery, Trading Signals for timing, Support/Resistance for SL/TP, Quantmetrics for sizing, and Price Prediction for scenario context. Always backtest and paper-trade first.

4) I saw results like “+241%” and a “7.5% average return.” Are these guaranteed?

No. Any historical results are illustrative and not guarantees of future performance. Markets are risky; use risk management and testing.

5) Can I filter the Moonshots list?

Yes—pass parameters like min_grade, signal, and limit (as supported) to tailor to your audience and keep pages fast.

6) Do you provide SDKs or examples?

REST works with JavaScript and Python snippets above. Docs include quickstarts, Postman collections, and templates—start with Run Hello-TM.

7) Pricing, limits, and enterprise SLAs?

Begin free and scale up. See API plans for rate limits and enterprise options.

Research

Support and Resistance API: Auto-Calculate Smart Levels for Better Trades

Token Metrics Team
4

Most traders still draw lines by hand in TradingView. The support and resistance API from Token Metrics auto-calculates clean support and resistance levels from one request, so your dashboard, bot, or alerts can react instantly. In minutes, you’ll call /v2/resistance-support, render actionable levels for any token, and wire them into stops, targets, or notifications. Start by grabbing your key on Get API Key, then Run Hello-TM and Clone a Template to ship a production-ready feature fast.

What You’ll Build in 2 Minutes

A minimal script that fetches Support/Resistance via /v2/resistance-support for a symbol (e.g., BTC, SOL).

  • A one-liner curl to smoke-test your key.
  • A UI pattern to display nearest support, nearest resistance, level strength, and last updated time.

Next Endpoints to add

  • /v2/trading-signals (entries/exits)
  • /v2/hourly-trading-signals (intraday updates)
  • /v2/tm-grade (single-score context)
  • /v2/quantmetrics (risk/return framing)

Why This Matters

Precision beats guesswork. Hand-drawn lines are subjective and slow. The support and resistance API standardizes levels across assets and timeframes, enabling deterministic stops and take-profits your users (and bots) can trust.

Production-ready by design. A simple REST shape, predictable latency, and clear semantics let you add levels to token pages, automate SL/TP alerts, and build rule-based execution with minimal glue code.

Where to Find

Need the Support and Resistance data? The cURL request for it is in the top right of the API Reference for quick access.

👉 Keep momentum: Get API KeyRun Hello-TMClone a Template

How It Works (Under the Hood)

The Support/Resistance endpoint analyzes recent price structure to produce discrete levels above and below current price, along with strength indicators you can use for priority and styling. Query /v2/resistance-support?symbol=<ASSET>&timeframe=<HORIZON> to receive arrays of level objects and timestamps.

Polling vs webhooks. For dashboards, short-TTL caching and batched fetches keep pages snappy. For bots and alerts, use queued jobs or webhooks (where applicable) to avoid noisy, bursty polling—especially around market opens and major events.

Production Checklist

  • Rate limits: Respect plan caps; add client-side throttling.
  • Retries/backoff: Exponential backoff with jitter for 429/5xx; log failures.
  • Idempotency: Make alerting and order logic idempotent to prevent duplicates.
  • Caching: Memory/Redis/KV with short TTLs; pre-warm top symbols.
  • Batching: Fetch multiple assets per cycle; parallelize within rate limits.
  • Threshold logic: Add %-of-price buffers (e.g., alert at 0.3–0.5% from level).
  • Error catalog: Map common 4xx/5xx to actionable user guidance; keep request IDs.
  • Observability: Track p95/p99; measure alert precision (touch vs approach).
  • Security: Store API keys in a secrets manager; rotate regularly.

Use Cases & Patterns

  • Bot Builder (Headless): Use nearest support for stop placement and nearest resistance for profit targets. Combine with /v2/trading-signals for entries/exits and size via Quantmetrics (volatility, drawdown).
  • Dashboard Builder (Product): Add a Levels widget to token pages; badge strength (e.g., High/Med/Low) and show last touch time. Color the price region (below support, between levels, above resistance) for instant context.
  • Screener Maker (Lightweight Tools): “Close to level” sort: highlight tokens within X% of a strong level. Toggle alerts for approach vs breakout events.
  • Risk Management: Create policy rules like “no new long if price is within 0.2% of strong resistance.” Export daily level snapshots for audit/compliance.

Next Steps

  • Get API Key — generate a key and start free.
  • Run Hello-TM — verify your first successful call.
  • Clone a Template — deploy a levels panel or alerts bot today.
  • Watch the demo: Compare plans: Scale confidently with API plans.

FAQs

1) What does the Support & Resistance API return?

A JSON payload with arrays of support and resistance levels for a symbol (and optional timeframe), each with a price and strength indicator, plus an update timestamp.

2) How timely are the levels? What are the latency/SLOs?

The endpoint targets predictable latency suitable for dashboards and alerts. Use short-TTL caching for UIs, and queued jobs or webhooks for alerting to smooth traffic.

3) How do I trigger alerts or trades from levels?

Common patterns: alert when price is within X% of a level, touches a level, or breaks beyond with confirmation. Always make downstream actions idempotent and respect rate limits.

4) Can I combine levels with other endpoints?

Yes—pair with /v2/trading-signals for timing, /v2/tm-grade for quality context, and /v2/quantmetrics for risk sizing. This yields a complete decide-plan-execute loop.

5) Which timeframe should I use?

Intraday bots prefer shorter horizons; swing/position dashboards use daily or higher-timeframe levels. Offer a timeframe toggle and cache results per setting.

6) Do you provide SDKs or examples?

Use the REST snippets above (JS/Python). The docs include quickstarts, Postman collections, and templates—start with Run Hello-TM.

7) Pricing, limits, and enterprise SLAs?

Begin free and scale as you grow. See API plans for rate limits and enterprise SLA options.

Disclaimer

This content is for educational purposes only and does not constitute financial advice. Always conduct your own research before making any trading decisions.

Research

Quantmetrics API: Measure Risk & Reward in One Call

Token Metrics Team
5

Most traders see price—quants see probabilities. The Quantmetrics API turns raw performance into risk-adjusted stats like Sharpe, Sortino, volatility, drawdown, and CAGR so you can compare tokens objectively and build smarter bots and dashboards. In minutes, you’ll query /v2/quantmetrics, render a clear performance snapshot, and ship a feature that customers trust. Start by grabbing your key at Get API Key, Run Hello-TM to verify your first call, then Clone a Template to go live fast.

What You’ll Build in 2 Minutes

  • A minimal script that fetches Quantmetrics for a token via /v2/quantmetrics (e.g., BTC, ETH, SOL).
  • A smoke-test curl you can paste into your terminal.
  • A UI pattern that displays Sharpe, Sortino, volatility, max drawdown, CAGR, and lookback window.

Next Endpoints to Add

  • /v2/tm-grade (one-score signal)
  • /v2/trading-signals
  • /v2/hourly-trading-signals (timing)
  • /v2/resistance-support (risk placement)
  • /v2/price-prediction (scenario planning)

Why This Matters

Risk-adjusted truth beats hype. Price alone hides tail risk and whipsaws. Quantmetrics compresses edge, risk, and consistency into metrics that travel across assets and timeframes—so you can rank universes, size positions, and communicate performance like a professional.

Built for dev speed

A clean REST schema, predictable latency, and easy auth mean you can plug Sharpe/Sortino into bots, dashboards, and screeners without maintaining your own analytics pipeline. Pair with caching and batching to serve fast pages at scale.

Where to Find

The Quant Metrics cURL request is located in the top right of the API Reference, allowing you to easily integrate it with your application.

Build Smarter Crypto Apps & AI Agents with Token Metrics

Token Metrics provides real-time prices, trading signals, and on-chain insights all from one powerful API. Grab a Free API Key

How It Works (Under the Hood)

Quantmetrics computes risk-adjusted performance over a chosen lookback (e.g., 30d, 90d, 1y). You’ll receive a JSON snapshot with core statistics:

  • Sharpe ratio: excess return per unit of total volatility.
  • Sortino ratio: penalizes downside volatility more than upside.
  • Volatility: standard deviation of returns over the window.
  • Max drawdown: worst peak-to-trough decline.
  • CAGR / performance snapshot: geometric growth rate and best/worst periods.

Call /v2/quantmetrics?symbol=<ASSET>&window=<LOOKBACK> to fetch the current snapshot. For dashboards spanning many tokens, batch symbols and apply short-TTL caching. If you generate alerts (e.g., “Sharpe crossed 1.5”), run a scheduled job and queue notifications to avoid bursty polling.

Production Checklist

  • Rate limits: Understand your tier caps; add client-side throttling and queues.
  • Retries & backoff: Exponential backoff with jitter; treat 429/5xx as transient.
  • Idempotency: Prevent duplicate downstream actions on retried jobs.
  • Caching: Memory/Redis/KV with short TTLs; pre-warm popular symbols and windows.
  • Batching: Fetch multiple symbols per cycle; parallelize carefully within limits.
  • Error catalog: Map 4xx/5xx to clear remediation; log request IDs for tracing.
  • Observability: Track p95/p99 latency and error rates; alert on drift.
  • Security: Store API keys in secrets managers; rotate regularly.

Use Cases & Patterns

  • Bot Builder (Headless): Gate entries by Sharpe ≥ threshold and drawdown ≤ limit, then trigger with /v2/trading-signals; size by inverse volatility.
  • Dashboard Builder (Product): Add a Quantmetrics panel to token pages; allow switching lookbacks (30d/90d/1y) and export CSV.
  • Screener Maker (Lightweight Tools): Top-N by Sortino with filters for volatility and sector; add alert toggles when thresholds cross.
  • Allocator/PM Tools: Blend CAGR, Sharpe, drawdown into a composite score to rank reallocations; show methodology for trust.
  • Research/Reporting: Weekly digest of tokens with Sharpe ↑, drawdown ↓, and volatility ↓.

Next Steps

  • Get API Key — start free and generate a key in seconds.
  • Run Hello-TM — verify your first successful call.
  • Clone a Template — deploy a screener or dashboard today.
  • Watch the demo: VIDEO_URL_HERE
  • Compare plans: Scale with API plans.

FAQs

1) What does the Quantmetrics API return?

A JSON snapshot of risk-adjusted metrics (e.g., Sharpe, Sortino, volatility, max drawdown, CAGR) for a symbol and lookback window—ideal for ranking, sizing, and dashboards.

2) How fresh are the stats? What about latency/SLOs?

Responses are engineered for predictable latency. For heavy UI usage, add short-TTL caching and batch requests; for alerts, use scheduled jobs or webhooks where available.

3) Can I use Quantmetrics to size positions in a live bot?

Yes—many quants size inversely to volatility or require Sharpe ≥ X to trade. Always backtest and paper-trade before going live; past results are illustrative, not guarantees.

4) Which lookback window should I choose?

Short windows (30–90d) adapt faster but are noisier; longer windows (6–12m) are steadier but slower to react. Offer users a toggle and cache each window.

5) Do you provide SDKs or examples?

REST is straightforward (JS/Python above). Docs include quickstarts, Postman collections, and templates—start with Run Hello-TM.

6) Polling vs webhooks for quant alerts?

Dashboards usually use cached polling. For threshold alerts (e.g., Sharpe crosses 1.0), run scheduled jobs and queue notifications to keep usage smooth and idempotent.

7) Pricing, limits, and enterprise SLAs?

Begin free and scale up. See API plans for rate limits and enterprise SLA options.

Disclaimer

All information provided in this blog is for educational purposes only. It is not intended as financial advice. Users should perform their own research and consult with licensed professionals before making any investment or trading decisions.

Choose from Platinum, Gold, and Silver packages
Reach with 25–30% open rates and 0.5–1% CTR
Craft your own custom ad—from banners to tailored copy
Perfect for Crypto Exchanges, SaaS Tools, DeFi, and AI Products