Back to blog
Crypto Basics

How Does Bitcoin Differ from Ethereum: A Comprehensive Guide

Discover the key differences between Bitcoin and Ethereum in our comprehensive comparison guide. Learn which cryptocurrency suits your needs better!
Talha Ahmad
6 min
Want Smarter Crypto Picks—Free?
See unbiased Token Metrics Ratings for BTC, ETH, and top alts.
Thank you! Your submission has been received!
Oops! Something went wrong while submitting the form.
 No credit card | 1-click unsubscribe

Bitcoin and Ethereum stand as the two most influential digital assets in the crypto market, commanding the largest market capitalization and driving innovation across the cryptocurrency space. While both leverage blockchain technology and represent leading digital assets, they serve fundamentally different purposes and operate through distinct technical architectures.

Understanding how bitcoin differs from ethereum requires examining their core philosophies, technical implementations, and real-world applications. Bitcoin functions primarily as a decentralized digital currency and store of value, while Ethereum operates as a flexible platform for smart contracts and decentralized applications. These fundamental differences ripple through every aspect of their design, from consensus mechanisms to investment considerations.

This comprehensive analysis explores the key differences between these blockchain pioneers, helping investors and enthusiasts understand their unique value propositions in the evolving global markets.

The image illustrates a comparison between Bitcoin and Ethereum, featuring their respective symbols alongside key differentiating features such as Bitcoin's fixed supply and role as "digital gold," and Ethereum's focus on smart contracts and decentralized applications. This visualization highlights the fundamental differences between these two major digital currencies within the blockchain technology landscape.

Core Purpose and Philosophy

Bitcoin was conceived as digital gold and a decentralized digital currency, launched in 2009 by the pseudonymous Satoshi Nakamoto. The bitcoin network was designed to address the fundamental problem of double-spending in digital transactions without requiring a central authority. Bitcoin aims to serve as an alternative to traditional monetary systems, emphasizing censorship resistance, predictability, and long-term value preservation.

Ethereum emerged in 2015 through the vision of Vitalik Buterin and the ethereum foundation, serving as a programmable blockchain platform for smart contracts and decentralized applications. Rather than competing directly with bitcoin as digital money, Ethereum positions itself as a “world computer” that can execute complex financial transactions and automate agreements through smart contract technology.

The philosophical divide runs deep: Bitcoin prioritizes security, decentralization, and conservative monetary policy with minimal changes to its core protocol. Bitcoin focuses on being the most secure and reliable digital asset, maintaining backward compatibility and requiring overwhelming consensus for any protocol modifications.

Ethereum emphasizes innovation, flexibility, and rapid development of decentralized technologies. Ethereum developers actively pursue technical improvements to enhance scalability, reduce energy consumption, and expand functionality. This approach enables Ethereum to evolve quickly but introduces more complexity and potential points of failure.

Bitcoin’s simplicity and laser focus on monetary use cases contrasts sharply with Ethereum’s ambitious goal to decentralize internet services and create a new foundation for digital finance and Web3 applications.

Technical Architecture Differences

The technical architecture reveals fundamental differences in how these networks operate and validate transactions. Bitcoin uses a Proof-of-Work consensus mechanism requiring energy-intensive mining operations, where bitcoin miners compete to solve cryptographic puzzles and secure the bitcoin blockchain. This process generates new blocks approximately every 10 minutes, ensuring predictable transaction settlement and robust security.

Ethereum originally used Proof-of-Work but completed its transition to Proof-of-Stake through “The Merge” in September 2022. The ethereum network now relies on validators who stake ETH to propose and validate new blocks every 12 seconds. This shift dramatically reduced ethereum’s energy consumption while enabling more rapid transaction processing and network upgrades.

Bitcoin supports limited scripting capabilities focused on secure value transfer and basic programmable transactions. Recent upgrades like Taproot have expanded Bitcoin’s scripting abilities while maintaining its conservative approach to functionality. The bitcoin blockchain prioritizes reliability and predictability over programmability.

Ethereum features Turing-complete smart contracts through the Ethereum Virtual Machine (EVM), enabling developers to build complex decentralized applications without intermediaries. The ethereum blockchain serves as the core infrastructure for thousands of decentralized finance protocols, NFT marketplaces, and Web3 applications.

Transaction throughput differs significantly: Bitcoin processes approximately 5-7 transactions per second on its base layer, while Ethereum handles 12-15 transactions per second. Both networks face scalability constraints on their base layers, leading to different approaches for increasing capacity.

The image depicts a network architecture diagram contrasting Bitcoin's mining process, characterized by bitcoin miners validating transactions on the bitcoin blockchain, with Ethereum's staking mechanism, where ethereum developers utilize a proof-of-stake consensus mechanism to secure the ethereum network. This visual representation highlights the fundamental differences in the consensus mechanisms of these two prominent digital currencies.

Supply Models and Monetary Policy

Bitcoin’s monetary policy represents one of its most distinctive features: a fixed supply capped at 21 million coins with halving events every four years that reduce new issuance. This finite supply creates predictable scarcity and positions bitcoin as a hedge against inflation and currency debasement. Bitcoin’s supply schedule remains unchanged since its launch, providing long-term certainty for holders.

Ethereum implements a dynamic supply model with no fixed cap, currently maintaining around 120 million ETH in circulation. Unlike bitcoin’s supply, Ethereum’s tokenomics have evolved significantly since launch. The implementation of EIP-1559 introduced fee burning, where a portion of transaction fees gets permanently removed from circulation, creating deflationary pressure during periods of high network activity.

Bitcoin’s halving events create predictable supply reduction approximately every four years, cutting mining rewards in half and historically driving significant price appreciation. These events are programmed into the protocol and cannot be changed without overwhelming network consensus.

Ethereum’s supply adjusts based on network usage and validator participation. During periods of high transaction volume and DeFi activity, ethereum’s fee burning can exceed new ETH issuance, making the native cryptocurrency deflationary. This mechanism ties ethereum’s monetary policy directly to network utility and adoption.

The contrasting approaches reflect each network’s priorities: Bitcoin emphasizes monetary predictability and long-term store of value characteristics, while Ethereum aligns its economics with platform usage and technological development.

Smart Contracts and Applications

Bitcoin supports basic scripting for simple programmable transactions, multi-signature wallets, and time-locked contracts. Recent technical improvements through Taproot have enhanced Bitcoin’s scripting capabilities while maintaining its focus on security and simplicity. These features enable applications like atomic swaps and more sophisticated payment channels, but Bitcoin deliberately limits complexity to preserve network security.

Ethereum pioneered smart contracts, enabling complex decentralized applications that operate without intermediaries or central control. Smart contract functionality allows developers to create autonomous financial protocols, governance systems, and digital asset management platforms. The ethereum blockchain hosts the vast majority of decentralized finance activity, NFT trading, and tokenized assets.

Ethereum’s programmability has spawned an entire ecosystem of decentralized applications across numerous sectors. DeFi protocols on Ethereum facilitate lending, borrowing, trading, and yield farming with billions of dollars in total value locked. NFT marketplaces, gaming platforms, and decentralized autonomous organizations (DAOs) represent additional use cases unique to programmable blockchains.

Bitcoin applications focus primarily on payments, store of value, and Layer-2 solutions like bitcoin’s lightning network. The Lightning Network enables instant, low-cost Bitcoin payments through payment channels, expanding Bitcoin’s utility for everyday transactions while preserving the main chain’s security and decentralization.

Ethereum’s flexibility enables diverse use cases from supply chain management to insurance protocols, but this complexity introduces additional security considerations and potential smart contract vulnerabilities that don’t exist in Bitcoin’s simpler model.

In the image, a group of developers is collaborating on smart contract code to create decentralized applications on the Ethereum blockchain. They are engaged in discussions about blockchain technology, focusing on the differences between Bitcoin and Ethereum, as they work to build innovative solutions in the crypto market.

Scalability Solutions

Bitcoin and Ethereum pursue different scaling philosophies to address throughput limitations. Bitcoin scales primarily through off-chain solutions that preserve the base layer’s simplicity, security, and decentralization. This approach maintains full node accessibility with minimal hardware requirements, ensuring anyone can validate the bitcoin network independently.

Bitcoin’s lightning network represents the primary scaling solution, creating payment channels that enable instant, low-cost transactions without broadcasting every payment to the main blockchain. While promising for micropayments and frequent transactions, the Lightning Network requires additional technical complexity and liquidity management.

Ethereum uses a multi-layered scaling approach combining Layer-2 rollups with planned on-chain improvements like sharding. Layer-2 solutions such as Arbitrum, Optimism, and Polygon process transactions off the main ethereum blockchain while inheriting its security guarantees. These scaling solutions already handle thousands of transactions per second with significantly lower fees.

Ethereum’s modular scaling architecture aims to boost capacity through multiple parallel solutions rather than increasing base layer throughput. This approach allows specialized Layer-2 networks to optimize for specific use cases while maintaining composability with the broader ethereum ecosystem.

The planned implementation of sharding will further increase ethereum’s capacity by dividing the network into multiple parallel chains. Combined with Layer-2 rollups, this architecture could enable millions of transactions per second across the ethereum network while maintaining decentralization and security.

Market Performance and Volatility

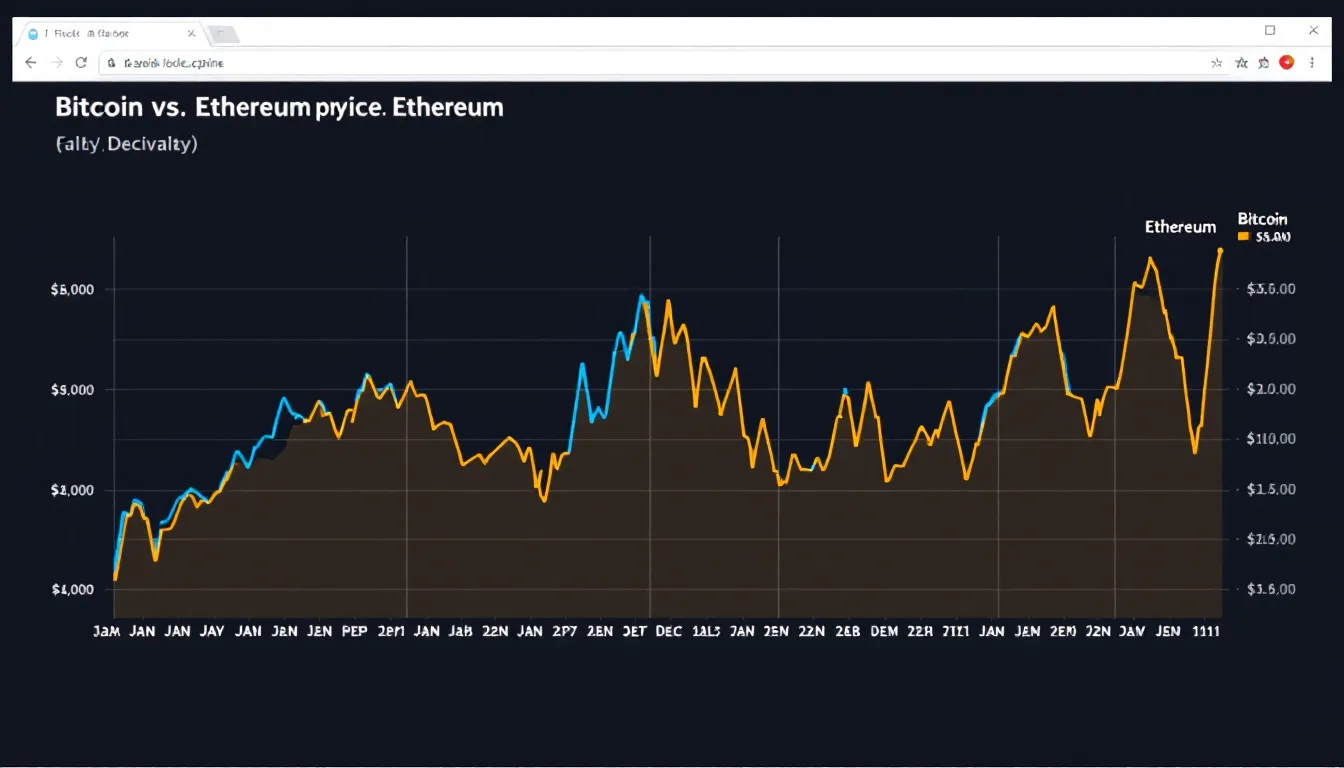
Bitcoin typically exhibits lower volatility compared to Ethereum and often serves as a portfolio diversifier during broader market uncertainty. As the original cryptocurrency and largest digital asset by market cap, Bitcoin tends to lead market cycles and attract institutional investment as a digital store of value and inflation hedge.

Ethereum historically shows approximately 30% higher volatility than Bitcoin due to its exposure to decentralized finance activity, NFT trading volumes, and smart contract platform competition. Ethereum’s price reflects not just investment demand but also utility demand from users paying transaction fees and interacting with decentralized applications.

Bitcoin’s price correlates strongly with adoption as digital gold, institutional investment flows, and macroeconomic factors affecting traditional safe-haven assets. Major institutional announcements, regulatory developments, and central bank monetary policy significantly impact Bitcoin’s valuation.

Ethereum’s value reflects usage in DeFi protocols, NFT marketplaces, and smart contract deployment. Network congestion, Layer-2 adoption, and competition from alternative smart contract platforms influence ethereum’s price beyond pure investment demand.

Both bitcoin and ethereum respond to broader macroeconomic factors, but Ethereum shows stronger correlation to technology sector performance due to its role as a platform for innovation. Investment companies and hedge funds often hold both assets to balance stability with exposure to blockchain technology growth.

A line chart illustrates the comparative price volatility of Bitcoin and Ethereum over time, highlighting key differences between the two cryptocurrencies. The chart visually represents the fluctuations in market capitalization and transaction fees, showcasing how Bitcoin, often referred to as digital gold, differs from Ethereum's blockchain technology and its focus on smart contracts.

Developer Ecosystems and Governance

Bitcoin development follows a conservative, consensus-driven approach through Bitcoin Improvement Proposals (BIPs) that require extensive testing and broad community agreement. Bitcoin developers prioritize backward compatibility and security over rapid feature deployment, resulting in slower but more deliberate protocol evolution.

Ethereum development moves rapidly through Ethereum Improvement Proposals (EIPs) and coordinated leadership from the ethereum foundation and core development teams. This governance model enables faster innovation but concentrates more decision-making authority in the hands of key developers and researchers.

Bitcoin’s decentralized development process prevents unilateral changes to the protocol, requiring overwhelming consensus from users, miners, and developers. This approach protects against contentious forks and preserves Bitcoin’s monetary policy, but can slow adoption of beneficial upgrades.

Ethereum regularly implements protocol upgrades to improve functionality, reduce fees, and address scalability challenges. The coordinated development process enables ambitious technical roadmaps but raises questions about centralization of development decisions.

The underlying technology differences extend to developer tooling and ecosystem support. Ethereum offers extensive development frameworks, testing environments, and educational resources for building decentralized applications. Bitcoin development focuses more narrowly on protocol improvements and second-layer solutions.

Both networks benefit from active open-source communities, but Ethereum attracts more application developers while Bitcoin emphasizes protocol and infrastructure development.

Energy Consumption and Environmental Impact

Energy consumption represents one of the most significant differences between Bitcoin and Ethereum post-Merge. Bitcoin’s Proof-of-Work mining consumes substantial energy but secures the world’s most valuable cryptocurrency network with unmatched computational power and geographic distribution.

Current estimates place Bitcoin’s annual energy consumption between 70-130 TWh, comparable to small countries. However, bitcoin miners increasingly utilize renewable energy sources and drive clean energy adoption by monetizing stranded renewable capacity and excess energy production.

Ethereum’s transition to Proof-of-Stake reduced energy consumption by approximately 99.9% after The Merge, making it one of the most energy-efficient blockchain networks. Ethereum’s PoS consensus requires ETH staking rather than energy-intensive mining operations, dramatically reducing its environmental footprint.

The energy debate influences institutional adoption decisions, with some investment companies preferring ethereum’s lower environmental impact while others value Bitcoin’s proven security model despite higher energy usage. Environmental, social, and governance (ESG) considerations increasingly factor into cryptocurrency investment decisions.

Bitcoin proponents argue that energy consumption secures the network and incentivizes renewable energy development, while Ethereum supporters emphasize the efficiency gains from Proof-of-Stake consensus. Both perspectives reflect valid priorities in balancing security, decentralization, and environmental responsibility.

Investment Considerations

Bitcoin serves as an inflation hedge and uncorrelated asset for portfolio diversification, appealing to investors seeking exposure to digital gold characteristics without traditional precious metals storage challenges. Bitcoin’s established track record, regulatory clarity, and institutional adoption make it attractive for conservative cryptocurrency allocation.

Ethereum offers exposure to Web3 growth and decentralized finance innovation, providing leverage to the expanding blockchain application ecosystem. Investors choosing Ethereum bet on the continued growth of smart contract platforms and decentralized applications beyond simple value transfer.

Both assets face similar regulatory challenges, but Bitcoin benefits from clearer legal status in many jurisdictions due to its commodity-like characteristics. Ethereum’s classification remains more complex due to its programmable features and the potential for securities regulations to apply to certain tokens and applications.

Bitcoin provides returns primarily through price appreciation, though lending platforms offer yields similar to staking rewards. Ethereum enables native staking rewards of approximately 3-5% annually plus potential price appreciation, providing income generation alongside capital gains potential.

Portfolio construction often includes both bitcoin and ethereum to balance stability with growth potential. Many institutional investors and investment strategy frameworks recommend exposure to both assets given their different risk profiles and correlation patterns with traditional asset classes.

The choice between bitcoin vs ethereum often depends on investment objectives, risk tolerance, and beliefs about the future of digital money versus programmable blockchain platforms.

An investment portfolio visualization displays the allocation strategies of Bitcoin and Ethereum, highlighting their roles as digital assets within the crypto market. The image emphasizes key differences between Bitcoin's fixed supply as a store of value and Ethereum's flexible platform for decentralized applications and smart contracts.

Future Outlook and Development Roadmaps

Bitcoin’s development roadmap focuses on gradual improvements like Taproot adoption, sidechains development, and bitcoin’s lightning network expansion. Future development emphasizes incremental enhancements to privacy, scripting capabilities, and second-layer scaling while maintaining the core protocol’s simplicity and security.

Ethereum pursues ambitious upgrades including sharding implementation, proto-danksharding for rollup scaling, and continued Layer-2 ecosystem development. Ethereum’s future events include account abstraction for improved user experience and continued optimization of the Proof-of-Stake consensus mechanism.

Bitcoin’s conservative approach prioritizes stability and gradual feature addition, with major changes requiring years of testing and community consensus. This methodology protects against unintended consequences but may limit Bitcoin’s ability to compete with more flexible blockchain platforms.

Ethereum faces competition from newer Layer-1 blockchains offering faster transactions and lower fees, but maintains significant advantages in developer mindshare, ecosystem maturity, and network effects. Ethereum’s roadmap addresses scalability concerns while preserving decentralization and security.

Both networks continue evolving to meet different needs in the expanding cryptocurrency ecosystem. Bitcoin solidifies its position as digital gold and the leading store of value cryptocurrency, while Ethereum develops as the primary platform for decentralized applications and financial innovation.

The fundamental differences between these networks suggest complementary rather than competitive futures, with each serving distinct roles in the broader digital asset landscape. Future performance will depend on continued technical development, regulatory clarity, and mainstream adoption across different use cases.

Key Takeaways

Understanding how bitcoin differs from ethereum reveals two complementary approaches to blockchain technology and digital assets. Bitcoin excels as a decentralized digital currency and store of value with predictable monetary policy and uncompromising security focus. Ethereum leads in programmable blockchain capabilities, enabling complex decentralized finance applications and serving as the foundation for Web3 innovation.

The key differences span every aspect from consensus mechanisms and energy consumption to governance philosophies and investment characteristics. Bitcoin’s Proof-of-Work mining and fixed supply contrast sharply with Ethereum’s Proof-of-Stake validation and dynamic tokenomics. Both bitcoin and ethereum offer distinct value propositions for different investor goals and risk profiles.

Rather than viewing these as competing cryptocurrencies, many investors and institutions recognize both bitcoin and ethereum as foundational digital assets serving different purposes in a diversified portfolio. Bitcoin provides stability and inflation hedging characteristics, while Ethereum offers exposure to technological innovation and the growing decentralized application ecosystem.

As the cryptocurrency space continues maturing, both networks face ongoing challenges around scalability, regulation, and competition. However, their established network effects, developer communities, and institutional adoption suggest continued relevance in the evolving digital asset landscape.

For investors considering exposure to cryptocurrency markets, understanding these fundamental differences enables more informed decision-making about portfolio allocation and investment strategy. Whether choosing Bitcoin’s digital gold characteristics or Ethereum’s programmable platform capabilities, both assets represent significant innovations in monetary technology and decentralized systems.

This content is for educational purposes only and should not be considered investment advice. Cryptocurrency investments carry significant risks, and past performance does not guarantee future results. Always consult with qualified financial advisors and conduct thorough research before making investment decisions.

Build Smarter Crypto Apps &
AI Agents in Minutes, Not Months
Real-time prices, trading signals, and on-chain insights all from one powerful API.
Grab a Free API Key
About Token Metrics
Token Metrics: AI-powered crypto research and ratings platform. We help investors make smarter decisions with unbiased Token Metrics Ratings, on-chain analytics, and editor-curated “Top 10” guides. Our platform distills thousands of data points into clear scores, trends, and alerts you can act on.
30 Employees
analysts, data scientists, and crypto engineers
Daily Briefings
concise market insights and “Top Picks”
Transparent & Compliant
Sponsored ≠ Ratings; research remains independent
Want Smarter Crypto Picks—Free?
See unbiased Token Metrics Ratings for BTC, ETH, and top alts.
Thank you! Your submission has been received!
Oops! Something went wrong while submitting the form.
 No credit card | 1-click unsubscribe
Token Metrics Team
Token Metrics Team

Recent Posts

Research

Mantle (MNT) Price Prediction 2027 | Token Metrics Analysis

Token Metrics Team
7 min read

Mantle (MNT) Price Prediction: Portfolio Context for MNT - Diversification in the 2027 Landscape

Layer 2 tokens like Mantle offer exposure to Ethereum's scaling roadmap, but with concentration risk around one specific L2's adoption trajectory. MNT performance depends heavily on Mantle winning rollup market share against competing L2s. Diversified L2 exposure or broader L1 and L2 baskets reduce the risk of backing the wrong scaling solution.

Token Metrics price prediction scenarios below project MNT ranges across market environments. These outcomes assume Mantle maintains relevance as Ethereum scales, but portfolio theory suggests hedging this bet by holding multiple L2s or allocating to Ethereum itself, which benefits from L2 success regardless of which specific rollup dominates.

Disclosure

Educational purposes only, not financial advice. Crypto is volatile, do your own research and manage risk.

How to read it: Each band blends cycle analogues and market-cap share math with TA guardrails. Base assumes steady adoption and neutral or positive macro. Moon layers in a liquidity boom. Bear assumes muted flows and tighter liquidity.

TM Agent baseline: Token Metrics long term view for Mantle, cashtag $MNT. Lead metric first, Token Metrics TM Grade is 68%, Buy, and the trading signal is bullish, indicating positive short-term momentum and above-average project quality. Concise 12-month numeric view, price prediction scenarios cluster roughly between $0.70 and $3.40, with a base case near $1.60.

Token Details 

Key Takeaways

  • Scenario driven, outcomes hinge on total crypto market cap, higher liquidity and adoption lift the bands.
  • Single-asset concentration amplifies both upside and downside versus diversified approaches.
  • Fundamentals: Fundamental Grade 81.62% (Community 72%, Tokenomics 100%, Exchange 100%, VC —, DeFi Scanner 100%).
  • Technology: Technology Grade 78.22% (Activity 64%, Repository 70%, Collaboration 71%, Security —, DeFi Scanner 100%).
  • TM Agent gist: bullish signal, 12‑month range roughly $0.70 to $3.40 with base near $1.60.
  • Education only, not financial advice.

Scenario Analysis - MNT Price Prediction Models

Token Metrics price prediction scenarios span four market cap tiers, each representing different levels of crypto market maturity and liquidity:

  • 8T: At an 8 trillion dollar total crypto market cap, MNT projects to $3.16 in bear conditions, $3.73 in the base case, and $4.30 in bullish scenarios.
  • 16T: Doubling the market to 16 trillion expands the price prediction range to $6.27 (bear), $7.99 (base), and $9.71 (moon).
  • 23T: At 23 trillion, the price prediction scenarios show $9.38, $12.25, and $15.12 respectively.
  • 31T: In the maximum liquidity scenario of 31 trillion, MNT price prediction could reach $12.49 (bear), $16.51 (base), or $20.52 (moon).

These ranges illustrate potential outcomes for concentrated MNT positions, but investors should weigh whether single-asset exposure matches their risk tolerance or whether diversified strategies better suit their objectives.

The Case for Diversified Index Exposure

Portfolio theory teaches that diversification is the only free lunch in investing. MNT concentration violates this principle by tying your crypto returns to one protocol's fate. Token Metrics Indices blend Mantle with the top one hundred tokens, providing broad exposure to crypto's growth while smoothing volatility through cross-asset diversification. This approach captures market-wide tailwinds without overweighting any single point of failure.

Systematic rebalancing within index strategies creates an additional return source that concentrated positions lack. As some tokens outperform and others lag, regular rebalancing mechanically sells winners and buys laggards, exploiting mean reversion and volatility. Single-token holders miss this rebalancing alpha and often watch concentrated gains evaporate during corrections while index strategies preserve more gains through automated profit-taking.

Beyond returns, diversified indices improve the investor experience by reducing emotional decision-making. Concentrated MNT positions subject you to severe drawdowns that trigger panic selling at bottoms. Indices smooth the ride through natural diversification, making it easier to maintain exposure through full market cycles.

Get early access

What Is Mantle?

Mantle is a blockchain project focused on scaling Ethereum via layer 2 rollup technology. The goal is to enable faster and cheaper transactions while inheriting Ethereum security. It targets scalable and efficient infrastructure for decentralized applications and financial services.

The MNT token powers network economics such as fees, incentives, or governance depending on implementation. Users interact with dApps and bridges within the ecosystem, and Mantle competes among leading Ethereum scaling solutions.

Token Metrics AI Analysis

  • Vision: Mantle aims to build a scalable, secure, and self-sustaining blockchain ecosystem that leverages decentralized governance and treasury-backed financial innovation. Its vision emphasizes capital efficiency, leveraging restaking for security, and fostering long-term sustainability through community-driven development and treasury utilization.
  • Problem: Many blockchain platforms face trade-offs between scalability, security, and capital efficiency. High transaction costs and network congestion on Ethereum, combined with fragmented liquidity and underutilized treasury assets in DAOs, create friction for developers and users. Mantle addresses the challenge of efficiently deploying capital while maintaining robust security and enabling rapid, low-cost transactions for decentralized applications.
  • Solution: Mantle implements an Ethereum Layer 2 network using optimistic rollup technology to reduce fees and increase throughput. It integrates EigenLayer for security via restaking, allowing its treasury to earn yield and contribute to network validation. The ecosystem supports native governance through its token and funds development via a large DAO-managed treasury, aiming to create a self-sustaining cycle of innovation and user incentives.
  • Market Analysis: Mantle operates in the competitive Layer 2 and modular blockchain space, competing with established networks like Arbitrum, Optimism, and emerging restaking platforms. Its differentiation lies in the integration of a large treasury with restaking, aiming to bootstrap security and ecosystem growth simultaneously. Adoption is driven by developer activity, yield opportunities, and strategic partnerships within the broader Ethereum ecosystem. Market risks include execution challenges in treasury management, regulatory scrutiny on DAO structures, and strong competition from other scaling solutions. While not a market leader like Ethereum or Bitcoin, Mantle participates in the broader narrative of modular, restaked, and treasury-driven blockchains, which have gained traction in 2024-2025.

Fundamental and Technology Snapshot from Token Metrics

  • Fundamental Grade: 81.62% (Community 72%, Tokenomics 100%, Exchange 100%, VC —, DeFi Scanner 100%).
  • Technology Grade: 78.22% (Activity 64%, Repository 70%, Collaboration 71%, Security —, DeFi Scanner 100%).

Catalysts That Skew Bullish

  • Institutional and retail access expands with ETFs, listings, and integrations.
  • Macro tailwinds from lower real rates and improving liquidity.
  • Product or roadmap milestones such as upgrades, scaling, or partnerships.

Risks That Skew Bearish

  • Macro risk-off from tightening or liquidity shocks.
  • Regulatory actions or infrastructure outages.
  • Concentration or validator economics and competitive displacement.
  • Protocol-specific execution risk and competitive pressure from alternatives.

FAQs

Can MNT reach $10?

Based on the price prediction scenarios, MNT could reach $10 in the higher tiers. The 23T tier projects $12.25 in the base case, and the 31T tier shows $12.49 (bear), $16.51 (base), and $20.52 (moon). Achieving this requires both broad market cap expansion and Mantle maintaining competitive position. Not financial advice.

What's the risk/reward profile for MNT?

Risk and reward spans from $3.16 at 8T bear to $20.52 at 31T moon. Downside risks include competitive pressure among L2s and execution challenges, while upside drivers include adoption growth and liquidity expansion. Concentrated positions amplify both tails, while diversified strategies smooth outcomes.

What gives MNT value?

MNT accrues value through network usage, fees, incentives, and governance tied to Mantle's L2 ecosystem. Demand drivers include dApp activity, bridging, and security via restaking integrations. While these fundamentals matter, diversified portfolios capture value accrual across multiple tokens rather than betting on one protocol's success.

Where can I find Mantle price predictions?

Token Metrics provides comprehensive Mantle (MNT) price predictions through scenario-based analysis spanning multiple market cap tiers. Our data-driven price prediction models incorporate fundamental grades, technology scores, and market conditions to project potential MNT price targets across bear, base, and moon scenarios.

Next Steps

Disclosure

Educational purposes only, not financial advice. Crypto is volatile, concentration amplifies risk, and diversification is a fundamental principle of prudent portfolio construction. Do your own research and manage risk appropriately.

Why Investors Choose Token Metrics

Token Metrics provides data-driven crypto ratings, on-chain grades, and scenario-based targets—empowering you to make informed investment decisions with confidence. Accelerate your research with unique AI-powered analysis and risk management tools.

Research

Toncoin Price Prediction 2027: $5-$43 Target Analysis | TON

Token Metrics Team
7 min read

Toncoin Price Prediction Framework: Market Cap Scenarios & 2027 Price Forecasts

Layer 1 tokens capture value through transaction fees, staking, and validator economics. TON uses proof-of-stake and a multi-blockchain architecture integrated with Telegram services. This Token Metrics price prediction model analyzes TON price forecasts across different total crypto market sizes, reflecting adoption and transaction demand by 2027.

Disclosure

Educational purposes only, not financial advice. This price prediction analysis is for informational purposes. Crypto is volatile, do your own research and manage risk.

How to read this price prediction:

Each band blends cycle analogues and market-cap share math with TA guardrails. Base assumes steady adoption and neutral or positive macro. Moon layers in a liquidity boom. Bear assumes muted flows and tighter liquidity. These price prediction scenarios provide a range of potential outcomes based on market conditions.

TM Agent baseline:

Token Metrics TM Grade is 74%, Buy, and the trading signal is bullish, indicating positive short-term momentum and strong overall project quality. Concise 12-month numeric price prediction view: scenarios cluster roughly between $5 and $14, with a base case price target near $9.

Live details: Token Details

Key Takeaways for TON Price Prediction

  • Scenario driven: price prediction outcomes hinge on total crypto market cap; higher liquidity and adoption lift the price targets
  • Fundamentals: Fundamental Grade 80.88% (Community 83%, Tokenomics N/A, Exchange 100%, VC 84%, DeFi Scanner 85%)
  • Technology: Technology Grade 77.11% (Activity 55%, Repository 72%, Collaboration 73%, Security N/A, DeFi Scanner 85%)
  • TM Agent gist: bullish signal, price prediction ranges cluster around $5 to $14 with a base case near $9
  • Education only, not financial advice

Toncoin Price Prediction: Scenario Analysis

8T Market Cap Price Prediction:

At an 8 trillion dollar total crypto market cap, TON price prediction projects to $4.36 in bear conditions, $6.28 in the base case, and $8.20 in bullish scenarios.

16T Market Cap Price Prediction:

At 16 trillion, the price prediction range expands to $8.54 (bear), $14.30 (base), and $20.07 (moon).

23T Market Cap Price Prediction:

The 23 trillion tier price forecast shows $12.72, $22.33, and $31.94 respectively.

31T Market Cap Price Prediction:

In the maximum liquidity scenario at 31 trillion, TON price prediction reaches $16.89 (bear), $30.35 (base), or $43.80 (moon).

What Is Toncoin?

The Open Network is a blockchain designed to support fast, low-cost transactions and a scalable ecosystem of decentralized applications. It integrates with digital services and messaging platforms to reach a broad user base, emphasizing high throughput and accessibility.

TON uses a proof-of-stake consensus mechanism with a multi-blockchain architecture. The TON token powers network activity, facilitating transactions, staking, and governance, and is integrated into Telegram-based services for user-friendly in-app payments and wallets.

Token Metrics AI Analysis for Price Prediction

Token Metrics AI provides additional context on Toncoin's technical positioning and market dynamics that inform our price prediction models.

Vision: The vision for Toncoin and The Open Network is to create a fast, secure, and scalable blockchain that enables seamless digital transactions and decentralized services, accessible to millions through integration with everyday communication tools like Telegram.

Problem: Many blockchain networks face limitations in speed, cost, and user accessibility, hindering mainstream adoption. Toncoin aims to address the friction of slow transaction times and high fees seen on older networks, while also lowering the barrier to entry for non-technical users who want to engage with decentralized applications and digital assets.

Solution: TON uses a proof-of-stake consensus mechanism with a multi-blockchain architecture to achieve high scalability and fast finality. The network supports smart contracts, decentralized storage, and domain naming, enabling a wide range of applications. Toncoin facilitates transactions, staking, and network governance, and is integrated into Telegram-based services, allowing for in-app payments and wallet functionality through user-friendly interfaces.

Market Analysis: Toncoin operates in the competitive layer-1 blockchain space, often compared to high-performance networks like Solana and Avalanche, though it differentiates itself through deep integration with Telegram's ecosystem. Its potential for mass adoption stems from access to hundreds of millions of Telegram users, which could drive network effects and utility usage. Unlike meme tokens, Toncoin's value is tied to infrastructure and real-world application rather than speculation or community hype. However, its growth depends on sustained development, regulatory clarity, and actual user engagement within Telegram. Competition from established blockchains and shifting market narratives around scalability and decentralization remain key risks. As a top-tier blockchain by ecosystem potential, Toncoin's market position is influenced more by integration milestones and user adoption than direct price dynamics.

Fundamental and Technology Snapshot from Token Metrics

  • Fundamental Grade: 80.88% (Community 83%, Tokenomics N/A, Exchange 100%, VC 84%, DeFi Scanner 85%)
  • Technology Grade: 77.11% (Activity 55%, Repository 72%, Collaboration 73%, Security N/A, DeFi Scanner 85%)

Catalysts That Skew Bullish for Price Prediction

  • Institutional and retail access expands with ETFs, listings, and integrations
  • Macro tailwinds from lower real rates and improving liquidity
  • Product or roadmap milestones such as upgrades, scaling, or partnerships
  • These factors could push TON toward higher price prediction targets

Risks That Skew Bearish for Price Prediction

  • Macro risk-off from tightening or liquidity shocks
  • Regulatory actions or infrastructure outages
  • Concentration in validator economics and competitive displacement
  • These factors could push TON toward lower price prediction scenarios

FAQs: Toncoin Price Prediction

How does TON accrue value?Value accrual mechanisms include transaction fees, validator staking rewards, and governance alignment described for TON in the documentation. As Toncoin usage grows through transactions and user activity, TON can capture network fees and staking yields while coordinating governance. Effectiveness depends on sustained adoption and network throughput, which directly impacts long-term price prediction models.

What price could TON reach in the moon case price prediction?Moon case price predictions range from $8.20 at 8T to $43.80 at 31T total crypto market cap. These price prediction scenarios require maximum market cap expansion and strong network adoption with robust liquidity conditions. Not financial advice.

What is the 2027 Toncoin price prediction?Based on Token Metrics analysis, the 2027 price prediction for Toncoin clusters between $5 and $14 in the base case, with potential for higher targets ($20-$43) in bullish scenarios if the total crypto market expands significantly.


Next Steps

Track live grades and signals: Token Details

Secure your TON with Ledger

Disclosure

Educational purposes only, not financial advice. Crypto is volatile, do your own research and manage risk.

How Token Metrics Can Help

Token Metrics combines fundamental, technical, and on-chain AI-powered analysis for actionable ratings, signals, and research. Use our data platform for scenario-based investing, backtested grades, and bespoke insights for digital asset markets.

Research

Cronos Price Prediction 2027: $0.10-$1.46 Target Analysis

Token Metrics Team
9 min read

Cronos Price Prediction: Portfolio Context for CRO in the 2027 Landscape

Layer 1 tokens like Cronos represent bets on specific blockchain architectures winning developer and user mindshare. CRO carries both systematic crypto risk and unsystematic risk from Cronos's technical roadmap execution and ecosystem growth. Multi-chain thesis suggests diversifying across several L1s rather than concentrating in one, since predicting which chains will dominate remains difficult.

The price prediction projections below show how CRO might perform under different market cap scenarios. While Cronos may have strong fundamentals, prudent portfolio construction balances L1 exposure across Ethereum, competing smart contract platforms, and Bitcoin to capture the sector without overexposure to any single chain's fate.

Disclosure

Educational purposes only, not financial advice. Crypto is volatile, do your own research and manage risk.

How to read this price prediction:

Each band blends cycle analogues and market-cap share math with TA guardrails. Base assumes steady adoption and neutral or positive macro. Moon layers in a liquidity boom. Bear assumes muted flows and tighter liquidity.

TM Agent baseline:

Token Metrics price prediction scenarios center roughly between $0.03 and $0.28, with a base case price target near $0.10, assuming steady ecosystem growth, continued cross-chain demand, and no major security incidents.

Live details: Token Details 

The Case for Diversified Index Exposure

Portfolio theory teaches that diversification is the only free lunch in investing. CRO concentration violates this principle by tying your crypto returns to one protocol's fate. Token Metrics Indices blend Cronos with the top one hundred tokens, providing broad exposure to crypto's growth while smoothing volatility through cross-asset diversification. This approach captures market-wide tailwinds without overweighting any single point of failure.

Systematic rebalancing within index strategies creates an additional return source that concentrated positions lack. As some tokens outperform and others lag, regular rebalancing mechanically sells winners and buys laggards, exploiting mean reversion and volatility. Single-token holders miss this rebalancing alpha and often watch concentrated gains evaporate during corrections while index strategies preserve more gains through automated profit-taking.

Beyond returns, diversified indices improve the investor experience by reducing emotional decision-making. Concentrated CRO positions subject you to severe drawdowns that trigger panic selling at bottoms. Indices smooth the ride through natural diversification, making it easier to maintain exposure through full market cycles.

Get early access

What Is Cronos?

Cronos is an EVM-compatible blockchain built to support decentralized applications with high throughput and low transaction costs. The network is designed to bridge the gap between crypto and traditional finance, offering interoperability with Ethereum and Cosmos ecosystems. Its focus on scalability and developer-friendly infrastructure aims to attract DeFi, NFT, and gaming projects.

CRO serves as the native utility token of the Cronos ecosystem, used for transaction fees, staking, and governance. It enables users to participate in network security, pay for smart contract execution, and access services within the Cronos DeFi ecosystem. Common usage patterns include staking for rewards, providing liquidity in DeFi protocols, and facilitating cross-chain transfers.

Key Takeaways for CRO Price Prediction

  • Scenario driven: price prediction outcomes hinge on total crypto market cap; higher liquidity and adoption lift the price targets
  • Single-asset concentration amplifies both upside and downside versus diversified approaches
  • Fundamentals: Fundamental Grade 72.71% (Community 55%, Tokenomics 60%, Exchange 100%, VC N/A, DeFi Scanner 83%)
  • Technology: Technology Grade 81.41% (Activity 64%, Repository 74%, Collaboration 82%, Security N/A, DeFi Scanner 83%)
  • TM Agent gist: Base price prediction near $0.10 amid steady growth
  • Education only, not financial advice

Cronos Price Prediction: Scenario Analysis

8T Market Cap Price Prediction:

At an 8 trillion dollar total crypto market cap, CRO price prediction projects to $0.14 in bear conditions, $0.29 in the base case, and $0.34 in bullish scenarios.

16T Market Cap Price Prediction:

Doubling the market to 16 trillion expands the price prediction range to $0.43 (bear), $0.57 (base), and $0.71 (moon).

23T Market Cap Price Prediction:

At 23 trillion, the price forecast scenarios show $0.62, $0.85, and $1.09 respectively.

31T Market Cap Price Prediction:

In the maximum liquidity scenario of 31 trillion, CRO price prediction could reach $0.81 (bear), $1.13 (base), or $1.46 (moon).


These price prediction ranges illustrate potential outcomes for concentrated CRO positions, but investors should weigh whether single-asset exposure matches their risk tolerance or whether diversified strategies better suit their objectives.

Fundamental and Technology Snapshot from Token Metrics

Fundamental Grade: 72.71% (Community 55%, Tokenomics 60%, Exchange 100%, VC N/A, DeFi Scanner 83%).


Technology Grade: 81.41% (Activity 64%, Repository 74%, Collaboration 82%, Security N/A, DeFi Scanner 83%).


Catalysts That Skew Bullish for Price Prediction

  • Institutional and retail access expands with ETFs, listings, and integrations
  • Macro tailwinds from lower real rates and improving liquidity
  • Product or roadmap milestones such as upgrades, scaling, or partnerships
  • These factors could push CRO toward higher price prediction targets

Risks That Skew Bearish for Price Prediction

  • Macro risk-off from tightening or liquidity shocks
  • Regulatory actions or infrastructure outages
  • Concentration in validator economics and competitive displacement
  • Protocol-specific execution risk and competitive pressure from alternatives
  • These factors could push CRO toward lower price prediction scenarios

FAQs: Cronos Price Prediction

Can CRO reach $1 according to price predictions?

Based on the price prediction scenarios, CRO could reach $1 in the 23T moon case where it projects to $1.09, and in the 31T scenarios where the base case is $1.13 and the moon case is $1.46. These price prediction outcomes require both broad market cap expansion and Cronos maintaining competitive position. Not financial advice.

What's the risk/reward profile for CRO price prediction?

Risk/reward in our price prediction model spans from $0.14 in the lowest bear case to $1.46 in the highest moon case. Downside risks include regulatory or infrastructure shocks and competitive displacement, while upside drivers include liquidity expansion and roadmap execution. Concentrated positions amplify both tails, while diversified strategies smooth outcomes.

What gives CRO value and impacts price predictions?

CRO accrues value through transaction fees, staking, and governance utility across the Cronos ecosystem. Demand drivers include DeFi activity, cross-chain usage, and network services. While these fundamentals matter for price predictions, diversified portfolios capture value accrual across multiple tokens rather than betting on one protocol's success.

What is the 2027 Cronos price prediction?

Based on Token Metrics analysis, the 2027 price prediction for Cronos centers around $0.10 in the base case, with potential for higher targets ($0.57-$1.13) in bullish scenarios if the total crypto market expands significantly. Moon case price predictions range up to $1.46 at maximum liquidity.

Next Steps

Disclosure
Educational purposes only, not financial advice. Crypto is volatile, concentration amplifies risk, and diversification is a fundamental principle of prudent portfolio construction. Do your own research and manage risk appropriately.

Choose from Platinum, Gold, and Silver packages
Reach with 25–30% open rates and 0.5–1% CTR
Craft your own custom ad—from banners to tailored copy
Perfect for Crypto Exchanges, SaaS Tools, DeFi, and AI Products