Back to blog
Research

How Does Cryptocurrency Work? Guide to the Future of Money - Why Token Metrics Is the Best AI Crypto Trading and Research Platform to Master It

Learn how cryptocurrency works, from blockchain to wallets to mining. Discover how Token Metrics helps you trade smarter with AI crypto price predictions and moonshot alerts.
Token Metrics Team
8 min
Want Smarter Crypto Picks—Free?
See unbiased Token Metrics Ratings for BTC, ETH, and top alts.
Thank you! Your submission has been received!
Oops! Something went wrong while submitting the form.
 No credit card | 1-click unsubscribe

What Is Cryptocurrency?

Cryptocurrency is a digital form of money that exists on a decentralized network. Unlike traditional currencies like the dollar or euro, it isn’t controlled by a central bank or government. Instead, it uses cryptography to secure transactions, validate ownership, and prevent double-spending.

The most popular cryptocurrencies today include:

  • Bitcoin (BTC) – The original and most valuable cryptocurrency
  • Ethereum (ETH) – A programmable blockchain for apps and smart contracts
  • TMAI – The native token of Token Metrics used for AI-powered crypto research and trading

🧠 How Cryptocurrency Works: A Step-by-Step Breakdown

At the heart of all cryptocurrencies is blockchain technology — a distributed ledger that records transactions in a transparent, immutable, and secure manner.

Step 1: Blockchain Basics

A blockchain is a chain of blocks — each block containing a list of transactions. Every time a transaction occurs (like sending Bitcoin from Alice to Bob), it’s broadcast to a decentralized network of nodes. These nodes validate the transaction and add it to the blockchain.

Once added, it’s permanent and tamper-proof.

Step 2: Decentralized Consensus

To ensure security, cryptocurrencies use consensus mechanisms like:

  • Proof of Work (PoW) – Used by Bitcoin. Miners solve cryptographic puzzles to validate transactions and earn new coins.
  • Proof of Stake (PoS) – Used by Ethereum 2.0. Validators are chosen based on how much crypto they stake in the network.

These systems remove the need for centralized authorities like banks.

Step 3: Wallets and Addresses

To send and receive crypto, users need a wallet — a digital app or hardware device that stores private and public keys.

  • Public Key = Like your bank account number (shareable)
  • Private Key = Like your password (keep it secret)

Step 4: Making Transactions

  1. You enter the recipient’s address and amount.
  2. The transaction is signed with your private key.
  3. It’s broadcast to the blockchain.
  4. Miners or validators confirm it.
  5. It’s added to the blockchain and becomes irreversible.

Step 5: Supply and Demand

Most cryptocurrencies have limited supply. For example, Bitcoin has a max cap of 21 million coins. As supply decreases and demand increases, the price tends to go up — making crypto attractive to investors.

📊 Why Cryptocurrency Matters

  • Decentralization: Removes intermediaries like banks
  • Security: Powered by cryptographic encryption and public verification
  • Transparency: All transactions are publicly recorded
  • Borderless: Send and receive globally in minutes
  • Ownership: No one can seize your funds without your private key

🤖 How Token Metrics Helps You Understand and Trade Crypto Better

Now that you know how cryptocurrency works, the next question is: How do you invest smartly?

That’s where Token Metrics comes in — the best AI-powered crypto research platform for beginners, traders, and institutions.

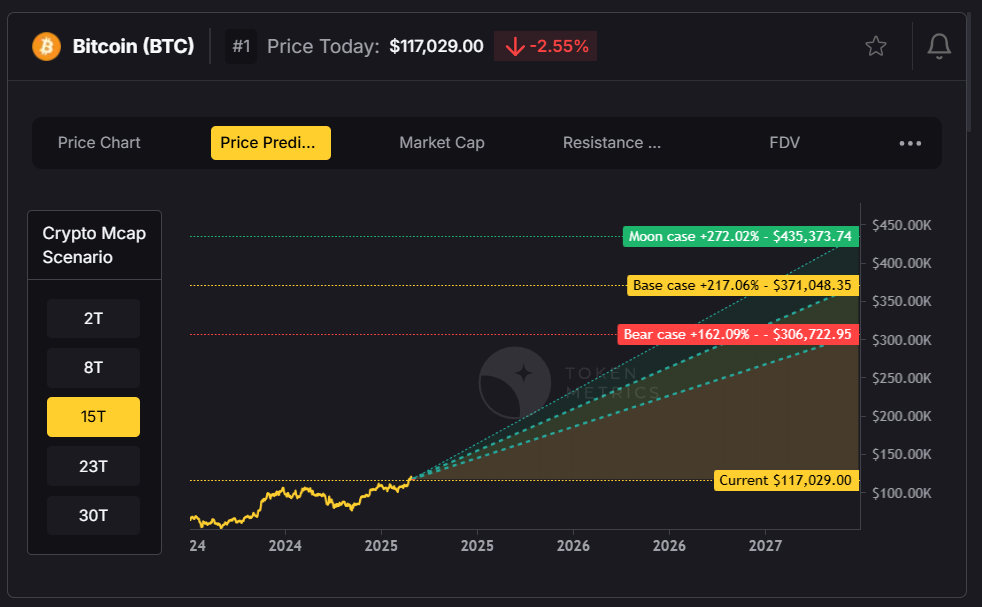
🔹 1. AI-Powered Price Predictions

Token Metrics uses machine learning models trained on 80+ metrics (technical, on-chain, fundamental, sentiment) to forecast prices for thousands of coins — helping you make data-driven decisions instead of guessing.

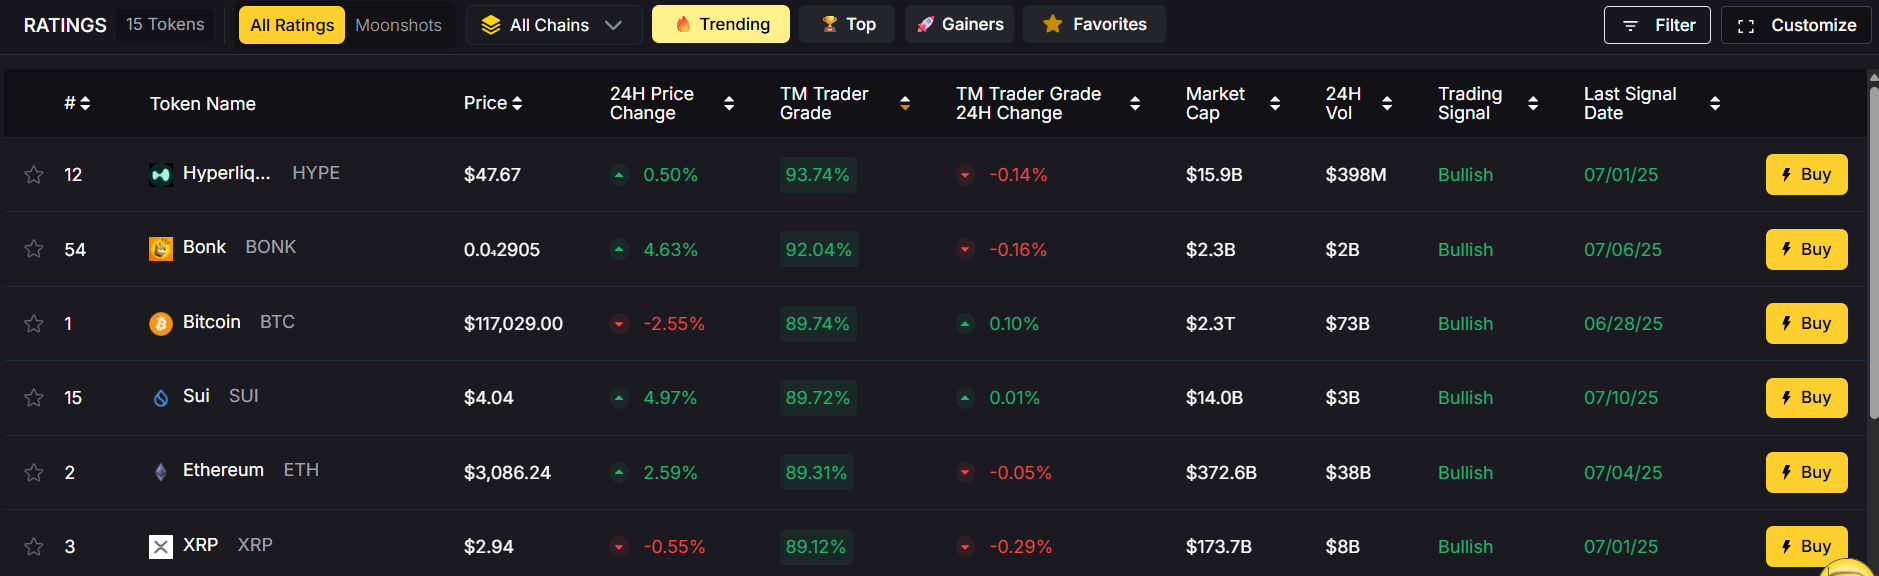
🔹 2. Trader and Investor Grades

Each token is assigned two AI-generated grades:

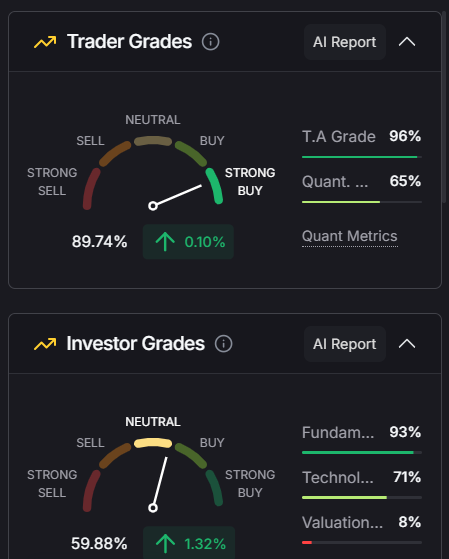
  • Trader Grade – For short-term price action
  • Investor Grade – For long-term potential

These grades update daily and help filter thousands of tokens instantly.

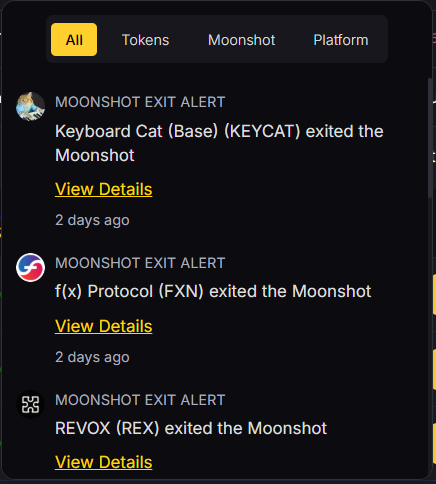
🔹 3. Moonshot Finder

Want to find the next 100x altcoin? Token Metrics features a Moonshots tab, showcasing small-cap tokens with breakout potential based on AI momentum detection.

You can review:

  • Entry date
  • Live ROI
  • Market cap
  • Grade changes
  • Volume trends

🔹 4. Buy/Sell Alerts in Real-Time

Never miss a trade. Token Metrics sends instant alerts when tokens:

  • Hit your target price
  • Trigger bullish/bearish signals
  • Experience grade increases

Alerts are available via:

  • Telegram
  • Slack
  • Discord
  • Email
  • SMS

🔹 5. One-Click Trading

Once you find a great coin, you can trade directly on Token Metrics using the built-in Swap Widget — no need to switch to another platform.

🔹 6. Developer Access via MCP Server

Want to integrate Token Metrics into AI agents or dev tools?

Use the MCP Server to connect real-time data with tools like:

  • Claude / ChatGPT agents
  • Cursor IDE
  • Windsurf GraphQL
  • Slide builders like Tome
  • CLI tools and more

With one Crypto API key, developers and data teams can query identical results across multiple tools — unlocking fast, consistent, and autonomous crypto infrastructure.

🧠 How to Get Started with Token Metrics

  1. Sign up for free at tokenmetrics.com
  2. Access daily updated grades, moonshots, and charts
  3. Set custom alerts and start building your portfolio
  4. Upgrade to Premium or use $TMAI for trading discounts and enhanced limits

🚨 Risks of Cryptocurrency

While crypto offers exciting opportunities, it’s important to be aware of potential risks:

  • Price Volatility – Prices can spike or crash quickly
  • Regulatory Risks – Laws vary across countries and change frequently
  • Security Threats – Always use trusted wallets and enable 2FA
  • Hype & FOMO – Don’t trade based on social media trends without research

Token Metrics helps you mitigate these risks by using AI to cut through the noise and focus on data that matters.

🔮 The Future of Cryptocurrency

Cryptocurrency is evolving rapidly. Trends to watch include:

  • Bitcoin and Ethereum ETFs
  • Layer-2 scaling (Arbitrum, Optimism)
  • AI agents for autonomous trading
  • Real-world asset tokenization
  • Decentralized Finance (DeFi) growth

As crypto matures, platforms like Token Metrics will play a key role in helping users capitalize on opportunities intelligently.

✅ Final Thoughts

Understanding how cryptocurrency works is essential for anyone looking to join the digital economy. From how blockchains secure transactions to how tokens gain value, crypto offers a radically transparent, decentralized financial system.

But success in crypto isn’t just about buying a coin and hoping it rises.

It’s about research. Timing. Strategy. And tools.

That’s why thousands of users trust Token Metrics — the all-in-one AI crypto platform that helps you:

  • Identify high-potential tokens
  • Get real-time price predictions
  • Trade with confidence

Build a smart, diversified portfolio.

Build Smarter Crypto Apps &
AI Agents in Minutes, Not Months
Real-time prices, trading signals, and on-chain insights all from one powerful API.
Grab a Free API Key
About Token Metrics
Token Metrics: AI-powered crypto research and ratings platform. We help investors make smarter decisions with unbiased Token Metrics Ratings, on-chain analytics, and editor-curated “Top 10” guides. Our platform distills thousands of data points into clear scores, trends, and alerts you can act on.
30 Employees
analysts, data scientists, and crypto engineers
Daily Briefings
concise market insights and “Top Picks”
Transparent & Compliant
Sponsored ≠ Ratings; research remains independent
Want Smarter Crypto Picks—Free?
See unbiased Token Metrics Ratings for BTC, ETH, and top alts.
Thank you! Your submission has been received!
Oops! Something went wrong while submitting the form.
 No credit card | 1-click unsubscribe
Token Metrics Team
Token Metrics Team

Recent Posts

Research

Support and Resistance API: Auto-Calculate Smart Levels for Better Trades

Token Metrics Team
4

Most traders still draw lines by hand in TradingView. The support and resistance API from Token Metrics auto-calculates clean support and resistance levels from one request, so your dashboard, bot, or alerts can react instantly. In minutes, you’ll call /v2/resistance-support, render actionable levels for any token, and wire them into stops, targets, or notifications. Start by grabbing your key on Get API Key, then Run Hello-TM and Clone a Template to ship a production-ready feature fast.

What You’ll Build in 2 Minutes

A minimal script that fetches Support/Resistance via /v2/resistance-support for a symbol (e.g., BTC, SOL).

  • A one-liner curl to smoke-test your key.
  • A UI pattern to display nearest support, nearest resistance, level strength, and last updated time.

Next Endpoints to add

  • /v2/trading-signals (entries/exits)
  • /v2/hourly-trading-signals (intraday updates)
  • /v2/tm-grade (single-score context)
  • /v2/quantmetrics (risk/return framing)

Why This Matters

Precision beats guesswork. Hand-drawn lines are subjective and slow. The support and resistance API standardizes levels across assets and timeframes, enabling deterministic stops and take-profits your users (and bots) can trust.

Production-ready by design. A simple REST shape, predictable latency, and clear semantics let you add levels to token pages, automate SL/TP alerts, and build rule-based execution with minimal glue code.

Where to Find

Need the Support and Resistance data? The cURL request for it is in the top right of the API Reference for quick access.

👉 Keep momentum: Get API KeyRun Hello-TMClone a Template

How It Works (Under the Hood)

The Support/Resistance endpoint analyzes recent price structure to produce discrete levels above and below current price, along with strength indicators you can use for priority and styling. Query /v2/resistance-support?symbol=<ASSET>&timeframe=<HORIZON> to receive arrays of level objects and timestamps.

Polling vs webhooks. For dashboards, short-TTL caching and batched fetches keep pages snappy. For bots and alerts, use queued jobs or webhooks (where applicable) to avoid noisy, bursty polling—especially around market opens and major events.

Production Checklist

  • Rate limits: Respect plan caps; add client-side throttling.
  • Retries/backoff: Exponential backoff with jitter for 429/5xx; log failures.
  • Idempotency: Make alerting and order logic idempotent to prevent duplicates.
  • Caching: Memory/Redis/KV with short TTLs; pre-warm top symbols.
  • Batching: Fetch multiple assets per cycle; parallelize within rate limits.
  • Threshold logic: Add %-of-price buffers (e.g., alert at 0.3–0.5% from level).
  • Error catalog: Map common 4xx/5xx to actionable user guidance; keep request IDs.
  • Observability: Track p95/p99; measure alert precision (touch vs approach).
  • Security: Store API keys in a secrets manager; rotate regularly.

Use Cases & Patterns

  • Bot Builder (Headless): Use nearest support for stop placement and nearest resistance for profit targets. Combine with /v2/trading-signals for entries/exits and size via Quantmetrics (volatility, drawdown).
  • Dashboard Builder (Product): Add a Levels widget to token pages; badge strength (e.g., High/Med/Low) and show last touch time. Color the price region (below support, between levels, above resistance) for instant context.
  • Screener Maker (Lightweight Tools): “Close to level” sort: highlight tokens within X% of a strong level. Toggle alerts for approach vs breakout events.
  • Risk Management: Create policy rules like “no new long if price is within 0.2% of strong resistance.” Export daily level snapshots for audit/compliance.

Next Steps

  • Get API Key — generate a key and start free.
  • Run Hello-TM — verify your first successful call.
  • Clone a Template — deploy a levels panel or alerts bot today.
  • Watch the demo: Compare plans: Scale confidently with API plans.

FAQs

1) What does the Support & Resistance API return?

A JSON payload with arrays of support and resistance levels for a symbol (and optional timeframe), each with a price and strength indicator, plus an update timestamp.

2) How timely are the levels? What are the latency/SLOs?

The endpoint targets predictable latency suitable for dashboards and alerts. Use short-TTL caching for UIs, and queued jobs or webhooks for alerting to smooth traffic.

3) How do I trigger alerts or trades from levels?

Common patterns: alert when price is within X% of a level, touches a level, or breaks beyond with confirmation. Always make downstream actions idempotent and respect rate limits.

4) Can I combine levels with other endpoints?

Yes—pair with /v2/trading-signals for timing, /v2/tm-grade for quality context, and /v2/quantmetrics for risk sizing. This yields a complete decide-plan-execute loop.

5) Which timeframe should I use?

Intraday bots prefer shorter horizons; swing/position dashboards use daily or higher-timeframe levels. Offer a timeframe toggle and cache results per setting.

6) Do you provide SDKs or examples?

Use the REST snippets above (JS/Python). The docs include quickstarts, Postman collections, and templates—start with Run Hello-TM.

7) Pricing, limits, and enterprise SLAs?

Begin free and scale as you grow. See API plans for rate limits and enterprise SLA options.

Disclaimer

This content is for educational purposes only and does not constitute financial advice. Always conduct your own research before making any trading decisions.

Research

Quantmetrics API: Measure Risk & Reward in One Call

Token Metrics Team
5

Most traders see price—quants see probabilities. The Quantmetrics API turns raw performance into risk-adjusted stats like Sharpe, Sortino, volatility, drawdown, and CAGR so you can compare tokens objectively and build smarter bots and dashboards. In minutes, you’ll query /v2/quantmetrics, render a clear performance snapshot, and ship a feature that customers trust. Start by grabbing your key at Get API Key, Run Hello-TM to verify your first call, then Clone a Template to go live fast.

What You’ll Build in 2 Minutes

  • A minimal script that fetches Quantmetrics for a token via /v2/quantmetrics (e.g., BTC, ETH, SOL).
  • A smoke-test curl you can paste into your terminal.
  • A UI pattern that displays Sharpe, Sortino, volatility, max drawdown, CAGR, and lookback window.

Next Endpoints to Add

  • /v2/tm-grade (one-score signal)
  • /v2/trading-signals
  • /v2/hourly-trading-signals (timing)
  • /v2/resistance-support (risk placement)
  • /v2/price-prediction (scenario planning)

Why This Matters

Risk-adjusted truth beats hype. Price alone hides tail risk and whipsaws. Quantmetrics compresses edge, risk, and consistency into metrics that travel across assets and timeframes—so you can rank universes, size positions, and communicate performance like a professional.

Built for dev speed

A clean REST schema, predictable latency, and easy auth mean you can plug Sharpe/Sortino into bots, dashboards, and screeners without maintaining your own analytics pipeline. Pair with caching and batching to serve fast pages at scale.

Where to Find

The Quant Metrics cURL request is located in the top right of the API Reference, allowing you to easily integrate it with your application.

Build Smarter Crypto Apps & AI Agents with Token Metrics

Token Metrics provides real-time prices, trading signals, and on-chain insights all from one powerful API. Grab a Free API Key

How It Works (Under the Hood)

Quantmetrics computes risk-adjusted performance over a chosen lookback (e.g., 30d, 90d, 1y). You’ll receive a JSON snapshot with core statistics:

  • Sharpe ratio: excess return per unit of total volatility.
  • Sortino ratio: penalizes downside volatility more than upside.
  • Volatility: standard deviation of returns over the window.
  • Max drawdown: worst peak-to-trough decline.
  • CAGR / performance snapshot: geometric growth rate and best/worst periods.

Call /v2/quantmetrics?symbol=<ASSET>&window=<LOOKBACK> to fetch the current snapshot. For dashboards spanning many tokens, batch symbols and apply short-TTL caching. If you generate alerts (e.g., “Sharpe crossed 1.5”), run a scheduled job and queue notifications to avoid bursty polling.

Production Checklist

  • Rate limits: Understand your tier caps; add client-side throttling and queues.
  • Retries & backoff: Exponential backoff with jitter; treat 429/5xx as transient.
  • Idempotency: Prevent duplicate downstream actions on retried jobs.
  • Caching: Memory/Redis/KV with short TTLs; pre-warm popular symbols and windows.
  • Batching: Fetch multiple symbols per cycle; parallelize carefully within limits.
  • Error catalog: Map 4xx/5xx to clear remediation; log request IDs for tracing.
  • Observability: Track p95/p99 latency and error rates; alert on drift.
  • Security: Store API keys in secrets managers; rotate regularly.

Use Cases & Patterns

  • Bot Builder (Headless): Gate entries by Sharpe ≥ threshold and drawdown ≤ limit, then trigger with /v2/trading-signals; size by inverse volatility.
  • Dashboard Builder (Product): Add a Quantmetrics panel to token pages; allow switching lookbacks (30d/90d/1y) and export CSV.
  • Screener Maker (Lightweight Tools): Top-N by Sortino with filters for volatility and sector; add alert toggles when thresholds cross.
  • Allocator/PM Tools: Blend CAGR, Sharpe, drawdown into a composite score to rank reallocations; show methodology for trust.
  • Research/Reporting: Weekly digest of tokens with Sharpe ↑, drawdown ↓, and volatility ↓.

Next Steps

  • Get API Key — start free and generate a key in seconds.
  • Run Hello-TM — verify your first successful call.
  • Clone a Template — deploy a screener or dashboard today.
  • Watch the demo: VIDEO_URL_HERE
  • Compare plans: Scale with API plans.

FAQs

1) What does the Quantmetrics API return?

A JSON snapshot of risk-adjusted metrics (e.g., Sharpe, Sortino, volatility, max drawdown, CAGR) for a symbol and lookback window—ideal for ranking, sizing, and dashboards.

2) How fresh are the stats? What about latency/SLOs?

Responses are engineered for predictable latency. For heavy UI usage, add short-TTL caching and batch requests; for alerts, use scheduled jobs or webhooks where available.

3) Can I use Quantmetrics to size positions in a live bot?

Yes—many quants size inversely to volatility or require Sharpe ≥ X to trade. Always backtest and paper-trade before going live; past results are illustrative, not guarantees.

4) Which lookback window should I choose?

Short windows (30–90d) adapt faster but are noisier; longer windows (6–12m) are steadier but slower to react. Offer users a toggle and cache each window.

5) Do you provide SDKs or examples?

REST is straightforward (JS/Python above). Docs include quickstarts, Postman collections, and templates—start with Run Hello-TM.

6) Polling vs webhooks for quant alerts?

Dashboards usually use cached polling. For threshold alerts (e.g., Sharpe crosses 1.0), run scheduled jobs and queue notifications to keep usage smooth and idempotent.

7) Pricing, limits, and enterprise SLAs?

Begin free and scale up. See API plans for rate limits and enterprise SLA options.

Disclaimer

All information provided in this blog is for educational purposes only. It is not intended as financial advice. Users should perform their own research and consult with licensed professionals before making any investment or trading decisions.

Research

Crypto Trading Signals API: Put Bullish/Bearish Calls Right in Your App

Token Metrics Team
4

Timing makes or breaks every trade. The crypto trading signals API from Token Metrics lets you surface bullish and bearish calls directly in your product—no spreadsheet wrangling, no chart gymnastics. In this guide, you’ll hit the /v2/trading-signals endpoint, display actionable signals on a token (e.g., SOL, BTC, ETH), and ship a conversion-ready feature for bots, dashboards, or Discord. Start by creating a key on Get API Key, then Run Hello-TM and Clone a Template to go live fast.

What You’ll Build in 2 Minutes

  • A minimal script that fetches Trading Signals via /v2/trading-signals for one symbol (e.g., SOL).
  • A copy-paste curl to smoke-test your key.
  • A UI pattern to render signal, confidence/score, and timestamp in your dashboard or bot.

Endpoints to add next

  • /v2/hourly-trading-signals (intraday updates)
  • /v2/resistance-support (risk placement)
  • /v2/tm-grade (one-score view)
  • /v2/quantmetrics (risk/return context)

Why This Matters

Action over analysis paralysis. Traders don’t need more lines on a chart—they need an opinionated call they can automate. The trading signals API compresses technical momentum and regime reads into Bullish/Bearish events you can rank, alert on, and route into strategies.

Built for dev speed and reliability. A clean schema, predictable performance, and straightforward auth make it easy to wire signals into bots, dashboards, and community tools. Pair with short-TTL caching or webhooks to minimize polling and keep latency low.

Where to Find

You can find the cURL request for Crypto Trading Signals in the top right corner of the API Reference. Use it to access the latest signals!

Live Demo & Templates

  • Trading Bot Starter: Use Bullish/Bearish calls to trigger paper trades; add take-profit/stop rules with Support/Resistance.
  • Dashboard Signal Panel: Show the latest call, confidence, and last-updated time; add a history table for context.
  • Discord/Telegram Alerts: Post signal changes to a channel with a link back to your app.

How It Works (Under the Hood)

Trading Signals distill model evidence (e.g., momentum regimes and pattern detections) into Bullish or Bearish calls with metadata such as confidence/score and timestamp. You request /v2/trading-signals?symbol=<ASSET> and render the most recent event, or a small history, in your UI.

For intraday workflows, use /v2/hourly-trading-signals to update positions or alerts more frequently. Dashboards typically use short-TTL caching or batched fetches; headless bots lean on webhooks, queues, or short polling with backoff to avoid spiky API usage.

Production Checklist

  • Rate limits: Know your tier caps; add client-side throttling and queues.
  • Retries/backoff: Exponential backoff with jitter; treat 429/5xx as transient.
  • Idempotency: Guard downstream actions (don’t double-trade on retries).
  • Caching: Memory/Redis/KV with short TTLs for reads; pre-warm popular symbols.
  • Webhooks & jobs: Prefer webhooks or scheduled workers for signal change alerts.
  • Pagination/Bulk: Batch symbols; parallelize with care; respect limits.
  • Error catalog: Map common 4xx/5xx to clear fixes; log request IDs.
  • Observability: Track p95/p99 latency, error rate, and alert delivery success.
  • Security: Keep keys in a secrets manager; rotate regularly.

Use Cases & Patterns

  • Bot Builder (Headless): Route Bullish into candidate entries; confirm with /v2/resistance-support for risk and TM Grade for quality.
  • Dashboard Builder (Product): Add a “Signals” module per token; color-code state and show history for credibility.
  • Screener Maker (Lightweight Tools): Filter lists by Bullish state; sort by confidence/score; add alert toggles.
  • Community/Discord: Post signal changes with links to token pages; throttle to avoid noise.
  • Allocator/PM Tools: Track signal hit rates by sector/timeframe to inform position sizing (paper-trade first).

Next Steps

  1. Get API Key — create a key and start free.
  2. Run Hello-TM — confirm your first successful call.
  3. Clone a Template — deploy a bot, dashboard, or alerting tool today.

FAQs

1) What does the Trading Signals API return?

A JSON payload with the latest Bullish/Bearish call for a symbol, typically including a confidence/score and generated_at timestamp. You can render the latest call or a recent history for context.

2) Is it real-time? What about latency/SLOs?

Signals are designed for timely, programmatic use with predictable latency. For faster cycles, use /v2/hourly-trading-signals. Add caching and queues/webhooks to reduce round-trips.

3) Can I use the signals in a live trading bot?

Yes—many developers do. A common pattern is: Signals → candidate entry, Support/Resistance → stop/targets, Quantmetrics → risk sizing. Always backtest and paper-trade before going live.

4) How accurate are the signals?

Backtests are illustrative, not guarantees. Treat signals as one input in a broader framework with risk controls. Evaluate hit rates and drawdowns on your universe/timeframe.

5) Do you provide SDKs and examples?

You can integrate via REST using JavaScript and Python snippets above. The docs include quickstarts, Postman collections, and templates—start with Run Hello-TM.

6) Polling vs webhooks for alerts?

Dashboards often use cached polling. For bots/alerts, prefer webhooks or scheduled jobs and keep retries idempotent to avoid duplicate trades or messages.

7) Pricing, limits, and enterprise SLAs?

Begin free and scale as you grow. See API plans for allowances; enterprise SLAs and support are available.

Choose from Platinum, Gold, and Silver packages
Reach with 25–30% open rates and 0.5–1% CTR
Craft your own custom ad—from banners to tailored copy
Perfect for Crypto Exchanges, SaaS Tools, DeFi, and AI Products