How to Store Cryptocurrency Safely in 2025 | Hot vs Cold Wallets
Learn how to store cryptocurrency securely using hot and cold wallets. Discover best practices and how Token Metrics helps you manage and protect your crypto investments.
Token Metrics Team
6 min
Want Smarter Crypto Picks—Free?
See unbiased Token Metrics Ratings for BTC, ETH, and top alts.
Thank you! Your submission has been received!
Oops! Something went wrong while submitting the form.
No credit card | 1-click unsubscribe
Cryptocurrency offers unmatched freedom, but with that freedom comes responsibility—especially when it comes to how to store cryptocurrency securely. Unlike traditional banking, crypto is self-custodied. If you lose access to your wallet, your funds are gone forever.
This guide explains everything you need to know about storing crypto in 2025, including:
Why crypto storage matters
Types of crypto wallets
Hot wallets vs. cold wallets
Tips for securing your assets
How platforms like Token Metrics can help protect your investment
🪙 Why Is Storing Cryptocurrency Important?
When you buy crypto—whether it’s Bitcoin, Ethereum, or a promising moonshot altcoin—you receive private keys that give you access to your funds. Anyone with that key can spend your coins.
That’s why safe storage is critical. Without it, your assets are vulnerable to:
Hacks and phishing scams
Lost devices or forgotten passwords
Exchange collapses or rug pulls
You are your own bank, and your security strategy is your vault.
🔐 What Is a Crypto Wallet?
A crypto wallet is a digital tool that stores your private and public keys. It lets you send, receive, and manage your crypto.
There are two main types:
Hot wallets – connected to the internet
Cold wallets – offline and physically secured
Let’s explore both.
🌐 Hot Wallets: Convenience Meets Risk
Hot wallets are always online, making them easy to use for trading, DeFi, or daily transactions.
Types of Hot Wallets:
Web wallets (e.g., MetaMask, Trust Wallet)
Mobile apps (e.g., Coinbase Wallet, Phantom)
Desktop wallets (e.g., Exodus, Electrum)
Pros:
Quick access to funds
Easy integration with DApps and exchanges
Great for beginners and active traders
Cons:
Higher risk of hacks, malware, and phishing
Device or browser compromise can expose keys
Best Practices for Hot Wallets:
Use 2FA (Two-Factor Authentication)
Never store large amounts
Double-check URLs to avoid fake websites
Avoid public Wi-Fi while transacting
🧊 Cold Wallets: Ultimate Security
Cold wallets are offline storage solutions, ideal for long-term investors or large holdings.
Types of Cold Wallets:
Hardware wallets (e.g., Ledger Nano X, Trezor)
Paper wallets (QR code + private key printed on paper)
Air-gapped devices (old smartphones with no internet access)
Pros:
Immune to online hacks
Best for HODLing and large sums
You own full control
Cons:
Less convenient for daily use
Loss or damage without backups = permanent loss
Best Practices for Cold Wallets:
Buy hardware wallets directly from the manufacturer
Backup your seed phrase on metal plates or offline storage
Keep backups in secure, separate locations
🔄 Custodial vs. Non-Custodial Wallets
🏦 Custodial Wallets
Managed by exchanges (e.g., Binance, Coinbase). You don’t own the private keys.
Pros:
Easy to use
Ideal for beginners
Cons:
Not your keys, not your crypto
Vulnerable to hacks or platform failures
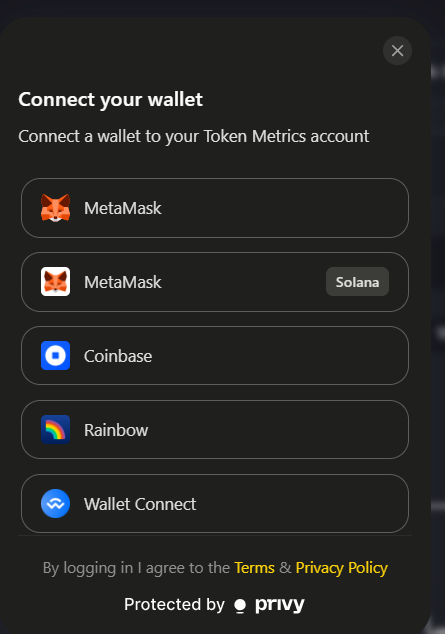
🔓 Non-Custodial Wallets
You own the keys. Wallets like MetaMask, Trust Wallet, or hardware devices.
Pros:
Full control and ownership
Safer long-term storage
Cons:
Losing your seed phrase = permanent loss
Requires more responsibility
Tip: Token Metrics recommends non-custodial wallets for storing long-term holdings and moonshot tokens.
🔐 How Token Metrics Enhances Crypto Security
Token Metrics is an AI-powered crypto research and trading platform trusted by thousands of investors. While it doesn’t store your crypto directly, it helps you manage risk and store assets wisely by:
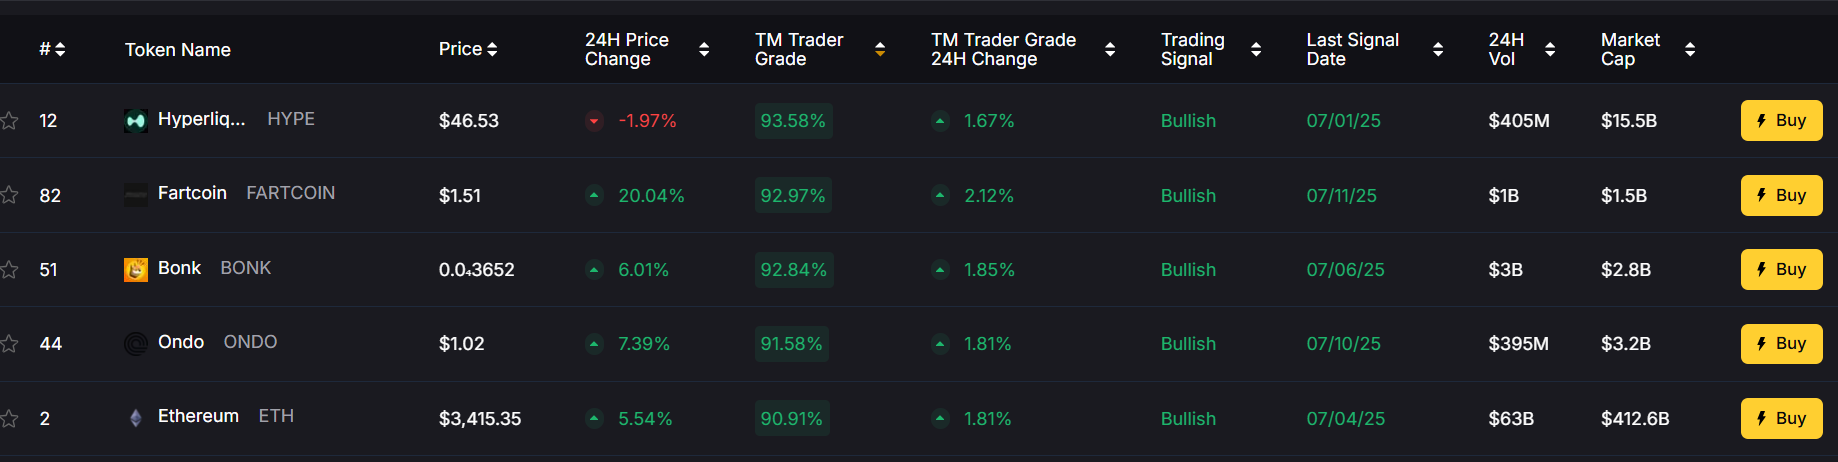
1. Identifying Safe Assets
Token Metrics gives you AI-generated grades for tokens—helping you avoid scams and invest in credible projects worth storing long-term.
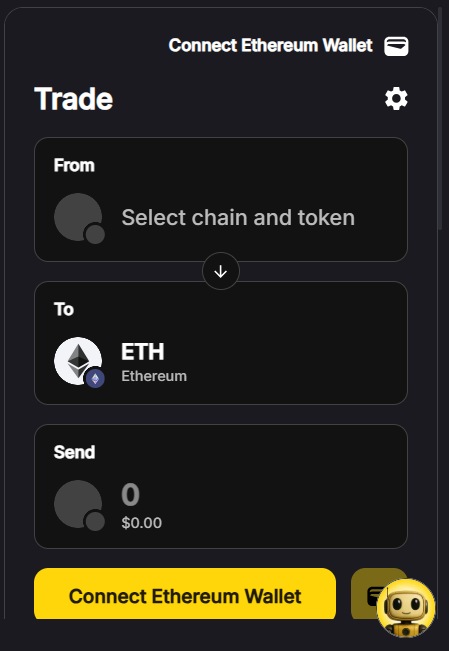
2. Trading Tools with Wallet Integration
You can explore tokens, assess moonshots, and initiate trades directly from your connected Web3 wallet without leaving the platform.
3. Portfolio Tracking with Security
Token Metrics allows you to track wallets and portfolio performance without requiring access to your private keys.
4. Educational Guidance
Through webinars, blog content, and investor resources, Token Metrics educates users on how to safely store their crypto in hot and cold wallets.
🧠 Tips to Keep Your Crypto Safe in 2025
✅ Use Hardware Wallets for Large Amounts
Your long-term Bitcoin, Ethereum, and moonshot tokens should live on a hardware wallet, not on an exchange.
✅ Store Your Seed Phrase Offline
Do NOT keep your recovery phrase in Google Docs or your phone. Use metal seed phrase storage or write it down and lock it in a safe.
✅ Use Multiple Wallets
Diversify storage:
Hot wallet for daily use
Cold wallet for savings
Separate wallet for DeFi
✅ Avoid Suspicious Links and Apps
Phishing is the #1 crypto threat. Double-check URLs, don’t sign unknown transactions, and avoid shady browser extensions.
✅ Monitor Wallet Activity
Use platforms like Token Metrics Alerts or Etherscan to track your wallet and get notified of suspicious activity.
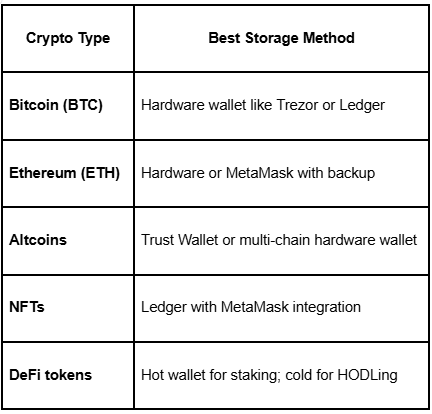
🪙 How to Store Different Types of Crypto
🧭 Final Thoughts
Storing cryptocurrency securely is just as important as choosing the right tokens to invest in. Whether you’re a day trader, long-term investor, or moonshot hunter, knowing when and where to store your crypto is key to protecting your wealth.
In 2025, the best strategy combines:
Cold wallets for large, long-term holdings
Hot wallets for convenience and trading
Non-custodial options to retain full control
AI tools like Token Metrics to identify trustworthy assets and avoid scams
When you store your crypto properly, you don’t just protect your assets—you gain peace of mind.
Build Smarter Crypto Apps & AI Agents in Minutes, Not Months
Real-time prices, trading signals, and on-chain insights all from one powerful API.
Token Metrics: AI-powered crypto research and ratings platform. We help investors make smarter decisions with unbiased Token Metrics Ratings, on-chain analytics, and editor-curated “Top 10” guides. Our platform distills thousands of data points into clear scores, trends, and alerts you can act on.
See unbiased Token Metrics Ratings for BTC, ETH, and top alts.
Thank you! Your submission has been received!
Oops! Something went wrong while submitting the form.
No credit card | 1-click unsubscribe
Token Metrics Team
The Token Metrics Team comprises blockchain and cryptocurrency experts dedicated to providing accurate information and empowering investors. Through our blog, we aim to educate and inspire readers to navigate the world of cryptocurrencies confidently.
Token Metrics Team
The Token Metrics Team comprises blockchain and cryptocurrency experts dedicated to providing accurate information and empowering investors. Through our blog, we aim to educate and inspire readers to navigate the world of cryptocurrencies confidently.
Create Your Free Token Metrics Account
Access our Ratings Page for valuable token insights
Explore our Market Page for a comprehensive market overview
Stay in the loop with exclusive weekly Newsletters filled with insider tips and updates
Join our private Telegram group for exclusive community access
Hedera Price Prediction: Portfolio Context for HBAR in the 2027 Landscape
Layer 1 tokens like Hedera represent bets on specific blockchain architectures winning developer and user mindshare. HBAR carries both systematic crypto risk and unsystematic risk from Hedera's technical roadmap execution and ecosystem growth. Multi-chain thesis suggests diversifying across several L1s rather than concentrating in one, since predicting which chains will dominate remains difficult.
The price prediction projections below show how HBAR might perform under different market cap scenarios. While Hedera may have strong fundamentals, prudent portfolio construction balances L1 exposure across Ethereum, competing smart contract platforms, and Bitcoin to capture the sector without overexposure to any single chain's fate.
Disclosure
Educational purposes only, not financial advice. Crypto is volatile, do your own research and manage risk.
How to read this price prediction:
Each band blends cycle analogues and market-cap share math with TA guardrails. Base assumes steady adoption and neutral or positive macro. Moon layers in a liquidity boom. Bear assumes muted flows and tighter liquidity.
TM Agent baseline:
Token Metrics lead metric for Hedera price prediction, cashtag $HBAR, is a TM Grade of 61.8%, which maps to Hold, and the trading signal is bearish, indicating short-term downward momentum. This means Token Metrics views $HBAR as having reasonably solid fundamentals but limited conviction for strong outperformance in the near term.
A concise long-term numeric price prediction view for a 12-month horizon: Token Metrics scenarios center around a range of about $0.06 to $0.18, with a base case price target near $0.10, reflecting steady ecosystem growth, moderate adoption of Hedera services, and continued enterprise partnerships. Implication: if Bitcoin and broader crypto risk appetite improve, $HBAR could revisit the higher end of the price prediction range, while a risk-off market or slower-than-expected developer traction would keep it toward the lower bound.
TM Agent gist: bearish short term, range view with upside if crypto risk appetite improves.
Education only, not financial advice.
Hedera Price Prediction: Scenario Analysis
Token Metrics price prediction scenarios span four market cap tiers, each representing different levels of crypto market maturity and liquidity:
8T Market Cap Price Prediction:
At an 8 trillion dollar total crypto market cap, HBAR price prediction projects to $0.27 in bear conditions, $0.32 in the base case, and $0.37 in bullish scenarios.
16T Market Cap Price Prediction:
Doubling the market to 16 trillion expands the price prediction range to $0.42 (bear), $0.57 (base), and $0.72 (moon).
23T Market Cap Price Prediction:
At 23 trillion, the price forecast scenarios show $0.56, $0.82, and $1.07 respectively.
31T Market Cap Price Prediction:
In the maximum liquidity scenario of 31 trillion, HBAR price prediction could reach $0.71 (bear), $1.07 (base), or $1.42 (moon).
These price prediction ranges illustrate potential outcomes for concentrated HBAR positions, but investors should weigh whether single-asset exposure matches their risk tolerance or whether diversified strategies better suit their objectives.
The Case for Diversified Index Exposure
Professional investors across asset classes prefer diversified exposure over concentrated bets for good reason. Hedera faces numerous risks - technical vulnerabilities, competitive pressure, regulatory targeting, team execution failure - any of which could derail HBAR performance independent of broader market conditions. Token Metrics Indices spread this risk across one hundred tokens, ensuring no single failure destroys your crypto portfolio.
Diversification becomes especially critical in crypto given the sector's nascency and rapid evolution. Technologies and narratives that dominate today may be obsolete within years as the space matures. By holding HBAR exclusively, you're betting not only on crypto succeeding but on Hedera specifically remaining relevant. Index approaches hedge against picking the wrong horse while maintaining full crypto exposure.
Tax efficiency and rebalancing challenges also favor indices over managing concentrated positions. Token Metrics Indices handle portfolio construction, rebalancing, and position sizing systematically, eliminating the emotional and logistical burden of doing this manually with multiple tokens.
Hedera is a high-performance public ledger that emphasizes speed, low fees, and energy efficiency, positioning itself for enterprise and decentralized applications. It uses a unique Hashgraph consensus that enables fast finality and high throughput, paired with a council-governed model that targets real-world use cases like payments, tokenization, and decentralized identity.
HBAR is the native token used for fees, staking, and network security, and it supports smart contracts and decentralized file storage. Adoption draws from partnerships and integrations, though decentralization levels and reliance on institutional demand are often discussed in the community.
Token Metrics AI Analysis for Price Prediction
Token Metrics AI provides comprehensive context on Hedera's positioning and challenges that inform our price prediction models.
Vision: Hedera's vision is to provide a secure, fair, and scalable distributed ledger technology platform that supports decentralized applications and enterprise use cases globally. It emphasizes governed decentralization, aiming to combine the benefits of distributed systems with responsible oversight through its council-based governance model.
Problem: Many blockchain networks face trade-offs between scalability, security, and decentralization, often resulting in high transaction fees, slow processing times, or environmental concerns. Hedera aims to address these limitations by offering a system that supports high throughput and fast finality without sacrificing security or incurring significant energy costs, making it suitable for both enterprise and decentralized applications.
Solution: Hedera uses the Hashgraph consensus algorithm, a directed acyclic graph (DAG)-based approach that achieves asynchronous Byzantine fault tolerance, enabling fast, secure, and fair transaction processing. The network supports smart contracts, tokenization, and decentralized file storage, with HBAR serving as the native token for fees, staking, and network security. Its council-governed model aims to ensure stability and trust, particularly for institutional and enterprise users.
Market Analysis: Hedera operates in the Layer 1 blockchain space, competing with high-throughput platforms like Solana, Avalanche, and Algorand, while differentiating through its Hashgraph consensus and governed governance model. It targets enterprise adoption, focusing on use cases in supply chain, payments, and asset tokenization, which sets it apart from more community-driven or DeFi-centric networks. Adoption is influenced by strategic partnerships, developer engagement, and real-world integrations rather than speculative activity. Key risks include competition from established and emerging blockchains, regulatory scrutiny around governance tokens, and challenges in achieving broad decentralization.
Fundamental and Technology Snapshot from Token Metrics
Institutional and retail access expands with ETFs, listings, and integrations
Macro tailwinds from lower real rates and improving liquidity
Product or roadmap milestones such as upgrades, scaling, or partnerships
These factors could push HBAR toward higher price prediction targets
Risks That Skew Bearish for Price Prediction
Macro risk-off from tightening or liquidity shocks
Regulatory actions or infrastructure outages
Concentration in validator economics and competitive displacement
Protocol-specific execution risk and competitive pressure from alternatives
These factors could push HBAR toward lower price prediction scenarios
FAQs: Hedera Price Prediction
Can HBAR reach $1.00 according to price predictions?
Yes. Based on the price prediction scenarios, HBAR could reach $1.00 or above in the higher tiers. The 23T tier projects $1.07 in the moon case price forecast and the 31T tier projects $1.42 in the moon case. Achieving this price prediction requires broad market cap expansion and Hedera maintaining competitive position. Not financial advice.
What price could HBAR reach in the moon case price prediction?
Moon case price predictions range from $0.37 at 8T to $1.42 at 31T total crypto market cap. These price prediction scenarios assume maximum liquidity expansion and strong Hedera adoption. Diversified strategies aim to capture upside across multiple tokens rather than betting exclusively on any single moon scenario. Not financial advice.
What's the risk/reward profile for HBAR price prediction?
Risk and reward in our price prediction model span from $0.27 in the lowest bear case to $1.42 in the highest moon case. Downside risks include regulatory or infrastructure setbacks and competitive pressure, while upside drivers include improved liquidity and enterprise adoption. Concentrated positions amplify both tails, while diversified strategies smooth outcomes.
What is the 2027 Hedera price prediction?
Based on Token Metrics analysis, the 2027 price prediction for Hedera centers around $0.10 in the base case under current market conditions, with a range between $0.06 and $0.18 depending on market scenarios. Bullish price predictions range from $0.32 to $1.42 across different total crypto market cap environments.
What drives HBAR price predictions?
HBAR price predictions are driven by enterprise adoption of Hashgraph technology, institutional partnerships (Google Cloud, IBM, Boeing), council governance decisions, and competition from other Layer 1 platforms. The strong fundamentals (81.08% grade) support long-term price potential, though short-term bearish signals suggest caution. Enterprise use case development remains the primary driver for reaching upper price prediction targets.
Can HBAR reach $0.50 by 2027?
According to our price prediction models, HBAR could reach $0.50+ in multiple scenarios: the 16T base case ($0.57), 16T moon case ($0.72), and all higher market cap tiers. This price prediction outcome requires steady crypto market growth (16T+ total market cap) and Hedera maintaining strong enterprise partnerships. Not financial advice.
Educational purposes only, not financial advice. Crypto is volatile, concentration amplifies risk, and diversification is a fundamental principle of prudent portfolio construction. Do your own research and manage risk appropriately.
LEO Token Price Prediction Framework: Market Cap Scenarios
Exchange tokens derive value from trading volume and platform revenue, creating linkage between crypto market activity and LEO price action. LEO Token delivers utility through reduced trading fees and enhanced platform services on Bitfinex and iFinex across Ethereum and EOS. Token Metrics price prediction scenarios below model LEO outcomes across different total crypto market cap environments, providing investors with data-driven forecasts for strategic decision-making.
Disclosure
Educational purposes only, not financial advice. Crypto is volatile, do your own research and manage risk.
How to Read This LEO Price Prediction
Each band blends cycle analogues and market-cap share math with TA guardrails. Base assumes steady adoption and neutral or positive macro. Moon layers in a liquidity boom. Bear assumes muted flows and tighter liquidity.
TM Agent baseline: Token Metrics price prediction probabilities favor a modest range between about $5 and $15, with a base case around current levels near $9, conditional on exchange token utility remaining steady, and downside risk if centralized exchange macro pressure increases.
Scenario driven, outcomes hinge on total crypto market cap, higher liquidity and adoption lift the bands.
TM Agent gist: 12-month horizon favors $5 to $15 range with base case near $9, contingent on stable exchange utility.
Education only, not financial advice.
LEO Token Price Prediction Scenario Analysis
Token Metrics price prediction scenarios span four market cap tiers reflecting different crypto market maturity levels:
8T Market Cap - LEO Price Prediction:
At 8 trillion total crypto market cap, LEO price prediction projects to $11.35 in bear conditions, $12.92 in the base case, and $14.48 in bullish scenarios.
16T Market Cap - LEO Price Prediction:
At 16 trillion total crypto market cap, LEO price prediction projects to $14.82 in bear conditions, $19.51 in the base case, and $24.20 in bullish scenarios.
23T Market Cap - LEO Price Prediction:
At 23 trillion total crypto market cap, LEO price prediction projects to $18.28 in bear conditions, $26.10 in the base case, and $33.92 in bullish scenarios.
31T Market Cap - LEO Price Prediction:
At 31 trillion total crypto market cap, LEO price prediction projects to $21.74 in bear conditions, $32.69 in the base case, and $43.63 in bullish scenarios.
Each tier in our price prediction framework assumes progressively stronger market conditions, with base scenarios reflecting steady exchange growth and moon cases requiring sustained bull market dynamics.
What Is LEO Token?
LEO Token is the native utility token of the Bitfinex and iFinex ecosystem, designed to provide benefits like reduced trading fees, enhanced lending and borrowing terms, and access to exclusive features on the platform. It operates on both Ethereum (ERC-20) and EOS blockchains, offering flexibility for users.
The primary role of LEO is to serve as a utility token within the exchange ecosystem, enabling fee discounts, participation in token sales, and other platform-specific advantages. Common usage patterns include holding LEO to reduce trading costs and utilizing it for enhanced platform services, positioning it primarily within the exchange token sector.
Catalysts That Skew LEO Price Predictions Bullish
Institutional and retail access expands with ETFs, listings, and integrations
Macro tailwinds from lower real rates and improving liquidity
Product or roadmap milestones such as upgrades, scaling, or partnerships
Increased Bitfinex trading volume and platform adoption
Strategic token burns and buyback programs
Risks That Skew LEO Price Predictions Bearish
Macro risk-off from tightening or liquidity shocks
Regulatory actions targeting centralized exchanges or infrastructure outages
Concentration risk or competitive displacement from rival exchange tokens
Declining exchange market share or trading volume
Negative sentiment around centralized exchange tokens
LEO Token Price Prediction FAQs
What gives LEO value?
LEO accrues value through reduced trading fees and enhanced platform services within the Bitfinex and iFinex ecosystem. Demand drivers include exchange usage and access to platform features, while supply dynamics follow the token's exchange utility design. Value realization depends on platform activity and user adoption—key factors in our price prediction methodology.
What price could LEO reach in the moon case?
Our moon case price predictions range from $14.48 at 8T to $43.63 at 31T total crypto market cap. These scenarios require maximum market cap expansion and strong exchange activity. Not financial advice.
What is the LEO Token price prediction for 2025-2027?
Our comprehensive price prediction framework suggests LEO could trade between $5 and $43.63 depending on market conditions and total crypto market capitalization. The base case price prediction scenario clusters around $9 to $32.69 across different market cap environments over the next 12-24 months. Not financial advice.
Can LEO Token reach $20?
Yes. Based on our price prediction scenarios, LEO could reach $19.51 in the 16T base case and surpass $20 in higher market cap scenarios (23T and 31T tiers). The 23T base case projects $26.10, making $20 an achievable target under favorable market conditions. Not financial advice.
Can LEO Token reach $50?
LEO reaching $50 would exceed our current price prediction models' highest scenario of $43.63 (31T moon case). This would require extraordinary market conditions beyond the 31T total crypto market cap tier and exceptional Bitfinex platform growth. Not financial advice.
Is LEO Token a good investment based on price predictions?
LEO's price prediction is tied to Bitfinex exchange performance and utility value. The token offers fee discounts and platform benefits, with moderate growth potential in our base scenarios. However, exchange token valuations carry platform-specific risks. Always conduct your own research and consult financial advisors. Not financial advice.
How accurate are LEO Token price predictions?
Our LEO price predictions use scenario-based modeling across multiple market cap tiers, combining cycle analogues, market-cap share math, and technical analysis guardrails. While this methodology provides structured forecasts, cryptocurrency markets remain highly volatile and unpredictable. Use these price predictions as educational frameworks, not guarantees. Not financial advice.
Curious how these forecasts are made? Token Metrics delivers LEO on-chain grades, forecasts, and deep research on 6,000+ tokens. Instantly compare fundamentals, on-chain scores, and AI-powered predictions.
Disclosure
Educational purposes only, not financial advice. Crypto is volatile, do your own research and manage risk.
Why Use Token Metrics for LEO Price Predictions?
Data-driven forecasts: Scenario-based price prediction models across multiple market cap tiers
Comprehensive analysis: On-chain metrics, fundamental grades, and technical guardrails
AI-powered insights: Advanced algorithms analyze 6,000+ tokens for comparative analysis
Regular updates: Real-time price predictions and signals based on market conditions
Risk management: Multiple scenarios (bear, base, moon) for informed decision-making
Portfolio Context for Sui Price Prediction: Diversification in the 2027 Landscape
Layer 1 tokens like Sui represent bets on specific blockchain architectures winning developer and user mindshare. SUI carries both systematic crypto risk and unsystematic risk from Sui's technical roadmap execution and ecosystem growth. Multi-chain thesis suggests diversifying across several L1s rather than concentrating in one, since predicting which chains will dominate remains difficult.
The SUI price prediction projections below show how SUI might perform under different market cap scenarios. While Sui may have strong fundamentals, prudent portfolio construction balances L1 exposure across Ethereum, competing smart contract platforms, and Bitcoin to capture the sector without overexposure to any single chain's fate.
Disclosure
Educational purposes only, not financial advice. Crypto is volatile, do your own research and manage risk.
How to Read This SUI Price Prediction Framework
Each band blends cycle analogues and market-cap share math with TA guardrails. Base assumes steady adoption and neutral or positive macro. Moon layers in a liquidity boom. Bear assumes muted flows and tighter liquidity.
TM Agent baseline: Token Metrics lead metric for Sui, cashtag $SUI, is a TM Grade of 67.4%, which maps to a Hold, and the trading signal is bearish, indicating short-term downward momentum. This suggests Token Metrics sees $SUI as having reasonable fundamentals but not yet strong conviction for substantial outperformance in our price prediction models, while near-term momentum is negative and could limit rallies. Market context, brief: Bitcoin's price direction is currently the primary market driver, and a risk-off Bitcoin environment increases downside pressure on layer-1 tokens like $SUI.
Professional investors across asset classes prefer diversified exposure over concentrated bets for good reason. Sui faces numerous risks—technical vulnerabilities, competitive pressure, regulatory targeting, team execution failure—any of which could derail SUI price prediction performance independent of broader market conditions. Token Metrics Indices spread this risk across one hundred tokens, ensuring no single failure destroys your crypto portfolio.
Diversification becomes especially critical in crypto given the sector's nascency and rapid evolution. Technologies and narratives that dominate today may be obsolete within years as the space matures. By holding SUI exclusively, you're betting not only on crypto succeeding but on Sui specifically remaining relevant. Index approaches hedge against picking the wrong horse while maintaining full crypto exposure.
TM Agent gist: Hold grade, bearish trading signal, near-term negative momentum in price prediction models
Education only, not financial advice
SUI Price Prediction Scenario Analysis
Token Metrics price prediction scenarios span four market cap tiers, each representing different levels of crypto market maturity and liquidity:
8T Market Cap - SUI Price Prediction:
At an 8 trillion total crypto market cap, SUI price prediction projects to $4.64 in bear conditions, $6.29 in the base case, and $7.94 in bullish scenarios.
16T Market Cap - SUI Price Prediction:
At a 16 trillion total crypto market cap, SUI price prediction projects to $8.93 in bear conditions, $13.88 in the base case, and $18.83 in bullish scenarios.
23T Market Cap - SUI Price Prediction:
At a 23 trillion total crypto market cap, SUI price prediction projects to $13.22 in bear conditions, $21.47 in the base case, and $29.72 in bullish scenarios.
31T Market Cap - SUI Price Prediction:
At a 31 trillion total crypto market cap, SUI price prediction projects to $17.50 in bear conditions, $29.05 in the base case, and $40.61 in bullish scenarios.
These price prediction ranges illustrate potential outcomes for concentrated SUI positions, but investors should weigh whether single-asset exposure matches their risk tolerance or whether diversified strategies better suit their objectives.
What Is Sui?
Sui is a layer-1 blockchain network designed for general-purpose smart contracts and scalable user experiences. It targets high throughput and fast settlement, aiming to support applications that need low-latency interactions and horizontal scaling.
SUI is the native token used for transaction fees and staking, aligning validator incentives and securing the network. It underpins activity across common crypto sectors such as NFTs and DeFi while the ecosystem builds developer tooling and integrations.
Token Metrics AI Analysis
Token Metrics AI provides comprehensive context informing our SUI price prediction models:
Vision: Sui aims to create a highly scalable and low-latency blockchain platform that enables seamless user experiences for decentralized applications. Its vision centers on making blockchain technology accessible and efficient for mainstream applications by removing traditional bottlenecks in transaction speed and cost.
Problem: Many existing blockchains face trade-offs between scalability, security, and decentralization, often resulting in high fees and slow transaction finality during peak usage. This limits their effectiveness for applications requiring instant settlement, frequent interactions, or large user bases, such as games or social platforms. Sui addresses the need for a network that can scale horizontally without sacrificing speed or cost-efficiency.
Solution: Sui uses a unique object-centric blockchain model and the Move programming language to enable parallel transaction processing, allowing high throughput and instant finality for many operations. Its consensus mechanism, Narwhal and Tusk, is optimized for speed and scalability by decoupling transaction dissemination from ordering. The network supports smart contracts, NFTs, and decentralized applications, with an emphasis on developer ease and user experience. Staking is available for network security, aligning with common proof-of-stake utility patterns.
Market Analysis: Sui competes in the layer-1 blockchain space with platforms like Solana, Avalanche, and Aptos, all targeting high-performance decentralized applications. It differentiates itself through its object-based data model and parallel execution, aiming for superior scalability in specific workloads. Adoption drivers include developer tooling, ecosystem incentives, and integration with wallets and decentralized exchanges. The broader market for high-throughput blockchains is driven by demand for scalable Web3 applications, though it faces risks from technical complexity, regulatory uncertainty, and intense competition—all critical factors in our price prediction analysis.
Fundamental and Technology Snapshot from Token Metrics
Institutional and retail access expands with ETFs, listings, and integrations
Macro tailwinds from lower real rates and improving liquidity
Product or roadmap milestones such as upgrades, scaling, or partnerships
Growing developer ecosystem and dApp adoption
Strategic partnerships with major Web3 platforms
Risks That Skew SUI Price Predictions Bearish
Macro risk-off from tightening or liquidity shocks
Regulatory actions or infrastructure outages
Concentration or validator economics and competitive displacement
Protocol-specific execution risk and competitive pressure from alternatives
Technical vulnerabilities or smart contract exploits
How Token Metrics Can Help
Token Metrics empowers you to analyze Sui and hundreds of digital assets with AI-driven ratings, on-chain and fundamental data, and index solutions to manage portfolio risk smartly in a rapidly evolving crypto market. Our price prediction frameworks provide scenario-based analysis to inform your investment decisions.
SUI Price Prediction FAQs
What price could SUI reach in the moon case?
Our moon case price predictions range from $7.94 at 8T to $40.61 at 31T total crypto market cap. These scenarios assume maximum liquidity expansion and strong Sui adoption. Diversified strategies aim to capture upside across multiple tokens rather than betting exclusively on any single moon scenario. Not financial advice.
What is the SUI price prediction for 2025-2027?
Our comprehensive SUI price prediction framework suggests SUI could trade between $4.64 and $40.61 depending on market conditions and total crypto market capitalization. The base case price prediction scenario clusters around $6.29 to $29.05 across different market cap environments. Current TM Grade of 67.4% indicates a Hold rating with bearish near-term momentum. Not financial advice.
Can SUI reach $20?
Yes. Based on our price prediction scenarios, SUI could reach $21.47 in the 23T base case and $18.83 in the 16T moon case. The price target of $20 becomes achievable in moderate to high market cap environments with steady ecosystem growth. Not financial advice.
Can SUI reach $50?
SUI reaching $50 would exceed our current price prediction models' highest scenario of $40.61 (31T moon case). This would require extraordinary market conditions beyond the 31T total crypto market cap tier, exceptional ecosystem adoption, and SUI capturing significant market share from competing L1s. Not financial advice.
What's the risk/reward profile for SUI?
Our SUI price prediction risk/reward spans from $4.64 to $40.61 across all scenarios. Downside risks include regulatory pressure and competitive displacement, while upside drivers include ecosystem growth and favorable liquidity. Concentrated positions amplify both tails, while diversified strategies smooth outcomes and reduce single-asset risk.
What are the biggest risks to SUI price predictions?
Key risks that could impact SUI price predictions include regulatory actions, technical issues, competitive pressure from other L1s (Solana, Avalanche, Aptos), adverse market liquidity, validator centralization concerns, and execution challenges. Concentrated SUI positions magnify exposure to these risks. Diversified strategies spread risk across tokens with different profiles, reducing portfolio vulnerability to any single failure point.
Is SUI a good investment based on price predictions?
SUI shows solid fundamentals (77.60% grade) and technology scores (79.06% grade), but currently has a Hold rating (67.4% TM Grade) with bearish near-term trading signals. While our price prediction models show potential upside in favorable market conditions, the bearish momentum and L1 competition suggest a cautious approach. Consider diversified exposure rather than concentrated positions. Not financial advice.
How does SUI compare to other L1 price predictions?
SUI competes with Solana, Avalanche, and Aptos in the high-performance L1 space. Our price prediction framework suggests SUI's performance will correlate with broader L1 adoption trends while facing differentiation challenges. Diversified L1 exposure through indices may offer better risk-adjusted returns than concentrated SUI positions, as predicting which specific L1 will dominate remains uncertain.
Disclosure Educational purposes only, not financial advice. Crypto is volatile, concentration amplifies risk, and diversification is a fundamental principle of prudent portfolio construction. Do your own research and manage risk appropriately.
Why Use Token Metrics for SUI Price Predictions?
Scenario-based modeling: Multiple market cap tiers for comprehensive price prediction analysis
AI-driven analysis: Fundamental (77.60%) and technology (79.06%) grades for informed decisions
Risk management tools: Index solutions to diversify L1 exposure beyond single-asset concentration
Real-time signals: Trading signals and TM Grades updated regularly
Comparative analysis: Analyze SUI against 6,000+ tokens for portfolio optimization