Back to blog
Research

Leading Oracles for Price & Real-World Data (2025)

Compare the top blockchain oracles for price & RWA data in 2025. See strengths, costs, and best fits—then build with confidence.
Sam Monac
5 min
Want Smarter Crypto Picks—Free?
See unbiased Token Metrics Ratings for BTC, ETH, and top alts.
Thank you! Your submission has been received!
Oops! Something went wrong while submitting the form.
 No credit card | 1-click unsubscribe

Why Oracles for Price & Real-World Data Matter in September 2025

DeFi, onchain derivatives, RWAs, and payments don’t work without reliable oracles for price & real-world data. In 2025, latency, coverage, and security disclosures vary widely across providers, and the right fit depends on your chain, assets, and risk tolerance. This guide helps teams compare the leading networks (and their trade-offs) to pick the best match, fast.
Definition (snippet-ready): A blockchain oracle is infrastructure that sources, verifies, and delivers off-chain data (e.g., prices, FX, commodities, proofs) to smart contracts on-chain.

We prioritized depth over hype: first-party data, aggregation design, verification models (push/pull/optimistic), and RWA readiness. Secondary focus: developer UX, fees, supported chains, and transparency. If you’re building lending, perps, stablecoins, options, prediction markets, or RWA protocols, this is for you.

How We Picked (Methodology & Scoring)

  • Weights (100 pts): Liquidity/usage (30), Security design & disclosures (25), Coverage across assets/chains (15), Costs & pricing model (15), Developer UX/tooling (10), Support/SLAs (5).

  • Data sources: Official product/docs, security/transparency pages, and audited reports. We cross-checked claims against widely cited market datasets where helpful. No third-party links appear in the body.
    Last updated September 2025.

Top 10 Oracles for Price & Real-World Data in September 2025

1. Chainlink — Best for broad coverage & enterprise-grade security

Why Use It: The most battle-tested network with mature Price/Data Feeds, Proof of Reserve, and CCIP for cross-chain messaging. Strong disclosures and large validator/operator sets make it a default for blue-chip DeFi and stablecoins. docs.switchboard.xyz
Best For: Lending/stablecoins, large TVL protocols, institutions.
Notable Features:

  • Price/Data Feeds and reference contracts

  • Proof of Reserve for collateral verification

  • CCIP for cross-chain token/data movement

  • Functions/Automation for custom logic
    Fees/Notes: Network/usage-based (LINK or billing models; varies by chain).
    Regions: Global.
    Alternatives: Pyth, RedStone.
    Consider If: You need the most integrations and disclosures, even if costs may be higher. GitHub

2. Pyth Network — Best for real-time, low-latency prices

Why Use It: First-party publishers stream real-time prices across crypto, equities, FX, and more to 100+ chains. Pyth’s on-demand “pull” update model lets dApps request fresh prices only when needed—great for latency-sensitive perps/AMMs. Pyth Network
Best For: Perps/options DEXs, HFT-style strategies, multi-chain apps.
Notable Features:

  • Broad market coverage (crypto, equities, FX, commodities)

  • On-demand price updates to minimize stale reads

  • Extensive multi-chain delivery and SDKs Pyth Network
    Fees/Notes: Pay per update/read model varies by chain.
    Regions: Global.
    Alternatives: Chainlink, Switchboard.
    Consider If: You want frequent, precise updates where timing matters most. Pyth Network

3. API3 — Best for first-party (direct-from-API) data

Why Use It: Airnode lets API providers run their own first-party oracles; dAPIs aggregate first-party data on-chain. OEV (Oracle Extractable Value) routes update rights to searchers and shares proceeds with the dApp—aligning incentives around updates. docs.api3.org+1
Best For: Teams that prefer direct data provenance and revenue-sharing from oracle updates.
Notable Features:

  • Airnode (serverless) first-party oracles

  • dAPIs (crypto, stocks, commodities)

  • OEV Network to auction update rights; API3 Market for subscriptions docs.kava.io
    Fees/Notes: Subscription via API3 Market; chain-specific gas.
    Regions: Global.
    Alternatives: Chainlink, DIA.
    Consider If: You need verifiable source relationships and simple subscription UX. docs.kava.io

4. RedStone Oracles — Best for modular feeds & custom integrations

Why Use It: Developer-friendly, modular oracles with Pull, Push, and Hybrid (ERC-7412) modes. RedStone attaches signed data to transactions for gas-efficient delivery and supports custom connectors for long-tail assets and DeFi-specific needs.
Best For: Builders needing custom data models, niche assets, or gas-optimized delivery.
Notable Features:

  • Three delivery modes (Pull/Push/Hybrid)

  • Data attached to calldata; verifiable signatures

  • EVM tooling, connectors, and RWA-ready feeds
    Fees/Notes: Pay-as-you-use patterns; gas + operator economics vary.
    Regions: Global.
    Alternatives: API3, Tellor.
    Consider If: You want flexibility beyond fixed reference feeds.

5. Band Protocol — Best for Cosmos & EVM cross-ecosystem delivery

Why Use It: Built on BandChain (Cosmos SDK), Band routes oracle requests to validators running Oracle Scripts (OWASM), then relays results to EVM/Cosmos chains. Good match if you straddle IBC and EVM worlds. docs.bandchain.org+2docs.bandchain.org+2
Best For: Cross-ecosystem apps (Cosmos↔EVM), devs who like programmable oracle scripts.
Notable Features:

  • Oracle Scripts (OWASM) for composable requests

  • Request-based feeds; IBC compatibility

  • Libraries and examples across chains docs.bandchain.org
    Fees/Notes: Gas/fees on BandChain + destination chain.
    Regions: Global.
    Alternatives: Chainlink, Switchboard.
    Consider If: You want programmable queries and Cosmos-native alignment. docs.bandchain.org

6. DIA — Best for bespoke feeds & transparent sourcing

Why Use It: Trustless architecture that sources trade-level data directly from origin markets (CEXs/DEXs) with transparent methodologies. Strong for custom asset sets, NFTs, LSTs, and RWA feeds across 60+ chains. DIA+1
Best For: Teams needing bespoke baskets, niche tokens/NFTs, or RWA price inputs.
Notable Features:

  • Two stacks (Lumina & Nexus), push/pull options

  • Verifiable randomness and fair-value feeds

  • Open-source components; broad chain coverage DIA
    Fees/Notes: Custom deployments; some public feeds/APIs free tiers.
    Regions: Global.
    Alternatives: API3, RedStone.
    Consider If: You want full transparency into sources and methods. DIA

7. Flare NetworksBest for real-world asset tokenization and decentralized data

Why Use It: Flare uses the Avalanche consensus to provide decentralized oracles for real-world assets (RWAs), enabling the tokenization of non-crypto assets like commodities and stocks. It combines high throughput with flexible, trustless data feeds, making it ideal for bridging real-world data into DeFi applications.

Best For: Asset-backed tokens, DeFi protocols integrating RWAs, cross-chain compatibility.

Notable Features:

  • Advanced decentralized oracle network for real-world data

  • Tokenization of commodities, stocks, and other RWAs

  • Multi-chain support with integration into the Flare network

  • High throughput with minimal latency

Fees/Notes: Variable costs based on usage and asset complexity.

Regions: Global.

Alternatives: Chainlink, DIA, RedStone.

Consider If: You want to integrate real-world assets into your DeFi protocols and need a robust, decentralized solution.

8. UMA — Best for optimistic verification & oracle-as-a-service

Why Use It: The Optimistic Oracle (OO) secures data by proposing values that can be disputed within a window—powerful for binary outcomes, KPIs, synthetic assets, and bespoke data where off-chain truth exists but doesn’t stream constantly. Bybit Learn
Best For: Prediction/insurance markets, bespoke RWAs, KPI options, governance triggers.
Notable Features:

  • OO v3 with flexible assertions

  • Any verifiable fact; not just prices

  • Dispute-based cryptoeconomic security Bybit Learn
    Fees/Notes: Proposer/disputer incentives; bond economics vary by use.
    Regions: Global.
    Alternatives: Tellor, Chainlink Functions.
    Consider If: Your use case needs human-verifiable truths more than tick-by-tick quotes. Bybit Learn

9. Chronicle Protocol — Best for MakerDAO alignment & cost-efficient updates

Why Use It: Originated in the Maker ecosystem and now a standalone oracle network with Scribe for gas-efficient updates and transparent validator set (Infura, Etherscan, Gnosis, etc.). Strong choice if you touch DAI, Spark, or Maker-aligned RWAs. Chronicle Protocol
Best For: Stablecoins, RWA lenders, Maker-aligned protocols needing verifiable feeds.
Notable Features:

  • Scribe reduces L1/L2 oracle gas costs

  • Community-powered validator network

  • Dashboard for data lineage & proofs Chronicle Protocol
    Fees/Notes: Network usage; gas savings via Scribe.
    Regions: Global.
    Alternatives: Chainlink, DIA.
    Consider If: You want Maker-grade security and cost efficiency. Chronicle Protocol

10. Switchboard — Best for Solana & multi-chain custom feeds

Why Use It: A multi-chain, permissionless oracle popular on Solana with Drag-and-Drop Feed Builder, TEEs, VRF, and new Oracle Quotes/Surge for sub-100ms streaming plus low-overhead on-chain reads—ideal for high-speed DeFi. docs.switchboard.xyz+1
Best For: Solana/SVM dApps, custom feeds, real-time dashboards, gaming.
Notable Features:

  • Low-code feed builder & TypeScript tooling

  • Oracle Quotes (no feed accounts/no write locks)

  • Surge streaming (<100ms) and cross-ecosystem docs docs.switchboard.xyz
    Fees/Notes: Some features free at launch; usage limits apply.
    Regions: Global.
    Alternatives: Pyth, Band Protocol.
    Consider If: You want speed and customization on SVM/EVM alike. docs.switchboard.xyz+1

Decision Guide: Best By Use Case

  • Regulated/Institutional & broad integrations: Chainlink.

  • Ultra-low-latency trading: Pyth or Switchboard (Surge/Quotes). Pyth Network+1

  • Custom, gas-efficient EVM delivery: RedStone.

  • First-party sources & subscription UX: API3 (Airnode + dAPIs + OEV). docs.kava.io

  • Cosmos + EVM bridge use: Band Protocol. docs.bandchain.org

  • Bespoke feeds/NFTs/RWAs with transparent sources: DIA. DIA

  • Permissionless, long-tail assets: Tellor. docs.kava.io

  • Optimistic, assertion-based facts: UMA. Bybit Learn

  • Maker/DAI alignment & gas savings: Chronicle Protocol. Chronicle Protocol

How to Choose the Right Oracle (Checklist)

  • Region & chain support: Verify your target chains and L2s are supported.

  • Coverage: Are your assets (incl. long-tail/RWAs) covered, or can you request custom feeds?

  • Security model: Push vs. pull vs. optimistic; validator set transparency; dispute process.

  • Costs: Update fees, subscriptions, gas impact; consider pull models for usage spikes.

  • Latency & freshness: Can you control update cadence? Any SLAs/heartbeats?

  • UX & tooling: SDKs, dashboards, error handling, testing sandboxes.

  • Support & disclosures: Incident reports, status pages, proofs.

  • Red flags: Opaque sourcing, no dispute/alerting, stale feeds, unclear operators.

Use Token Metrics With Any Oracle

  • AI Ratings to triage providers and prioritize integrations.
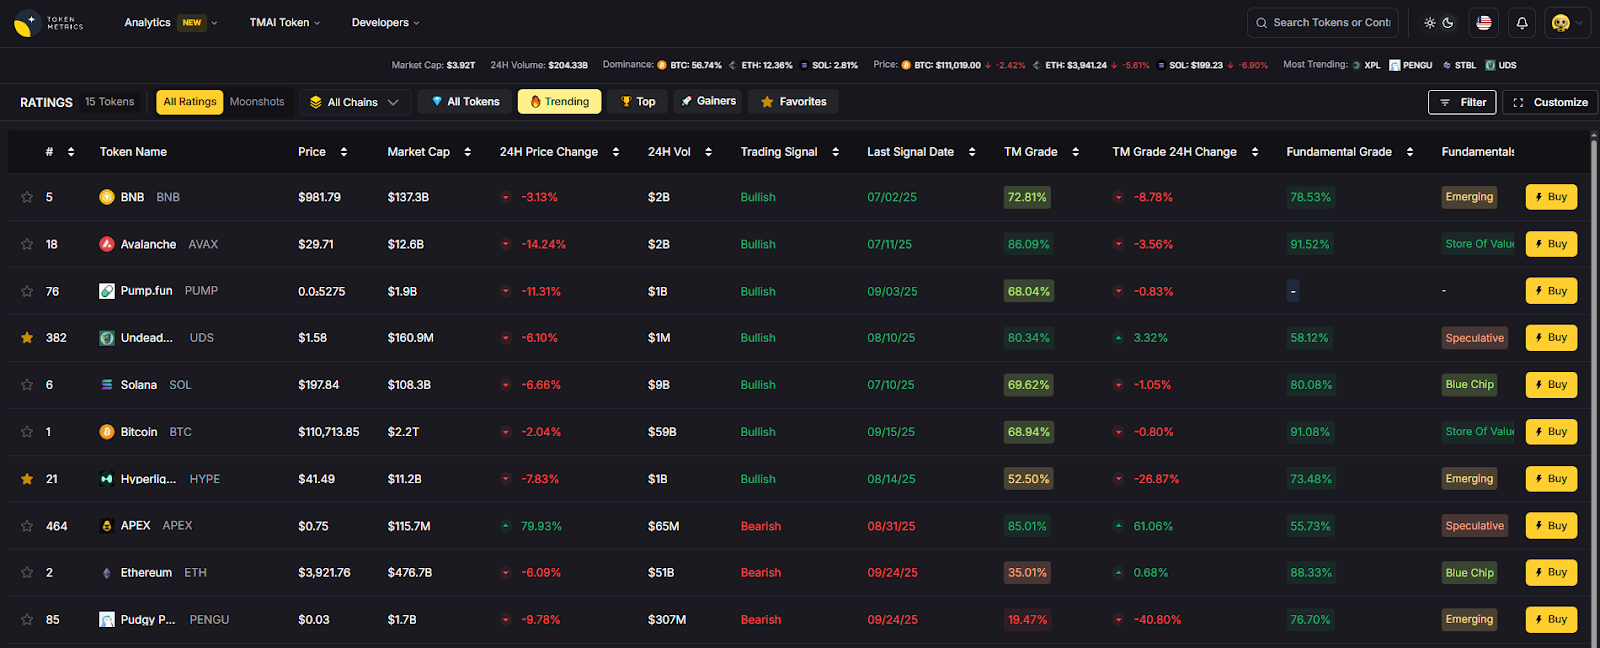
  • Narrative Detection to spot momentum in perps/lending sectors powered by oracles.

  • Portfolio Optimization to size positions by oracle risk and market beta.

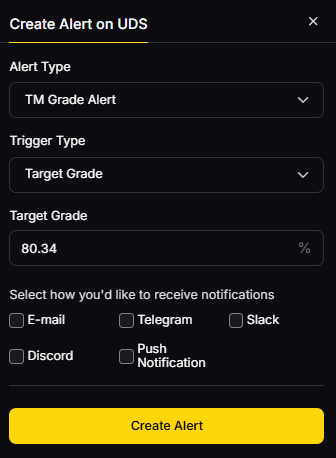
  • Alerts/Signals to monitor price triggers and on-chain flows.
    Workflow: Research → Select → Execute on your chosen oracle/provider → Monitor with TM alerts.


Primary CTA: Start free trial

Security & Compliance Tips

  • Enforce 2FA and least-privilege on deployer keys; rotate API/market credentials.

  • Validate feed params (deviation/heartbeat) and fallback logic; add circuit breakers.

  • Document chain-specific KYC/AML implications if your app touches fiat/RWAs.

  • For RFQs and custom feeds, formalize SLOs and alerting.

  • Practice wallet hygiene: separate ops keys, testnets, and monitors.

This article is for research/education, not financial advice.

Beginner Mistakes to Avoid

  • Relying on a single feed without fallback or stale-price guards.

  • Assuming all “price oracles” have identical latency/fees.

  • Ignoring dispute windows (optimistic designs) before acting on values.

  • Not budgeting for update costs when volatility spikes.

  • Skipping post-deploy monitoring and anomaly alerts.

FAQs

What is a blockchain oracle in simple terms?
It’s middleware that fetches, verifies, and publishes off-chain data (e.g., prices, FX, commodities, proofs) to blockchains so smart contracts can react to real-world events.

Do I need push, pull, or optimistic feeds?
Push suits stable, shared reference prices; pull minimizes cost by updating only when needed; optimistic is great for facts that benefit from challenge periods (e.g., settlement outcomes). Pyth Network+1

Which oracle is best for low-latency perps?
Pyth and Switchboard (Surge/Quotes) emphasize real-time delivery; evaluate your chain and acceptable freshness. Pyth Network+1

How do fees work?
Models vary: subscriptions/markets (API3), per-update pull fees (Pyth), or gas + operator incentives (RedStone/Tellor). Always test under stress. docs.kava.io+2Pyth Network+2

Can I get RWA data?
Yes—Chainlink PoR, DIA RWA feeds, Chronicle for Maker-aligned assets, and others offer tailored integrations. Validate licensing and data provenance. docs.switchboard.xyz+2DIA+2

Conclusion + Related Reads

The “best” oracle depends on your chain, assets, latency needs, and budget. If you need broad coverage and disclosures, start with Chainlink. If you’re building latency-sensitive perps, test Pyth/Switchboard. For first-party provenance or custom baskets, look to API3, DIA, or RedStone. For long-tail, permissionless or bespoke truths, explore Tellor or UMA.
Related Reads:

  • Best Cryptocurrency Exchanges 2025

  • Top Derivatives Platforms 2025

  • Top Institutional Custody Providers 2025

Build Smarter Crypto Apps &
AI Agents in Minutes, Not Months
Real-time prices, trading signals, and on-chain insights all from one powerful API.
Grab a Free API Key
About Token Metrics
Token Metrics: AI-powered crypto research and ratings platform. We help investors make smarter decisions with unbiased Token Metrics Ratings, on-chain analytics, and editor-curated “Top 10” guides. Our platform distills thousands of data points into clear scores, trends, and alerts you can act on.
30 Employees
analysts, data scientists, and crypto engineers
Daily Briefings
concise market insights and “Top Picks”
Transparent & Compliant
Sponsored ≠ Ratings; research remains independent
Want Smarter Crypto Picks—Free?
See unbiased Token Metrics Ratings for BTC, ETH, and top alts.
Thank you! Your submission has been received!
Oops! Something went wrong while submitting the form.
 No credit card | 1-click unsubscribe
Token Metrics Team
Token Metrics Team

Recent Posts

Research

Avalanche Price Prediction 2027: $25-$320 Target Analysis

Token Metrics Team
6 min read

Avalanche Price Prediction: AVAX in the 2027 Landscape

The Layer 1 competitive landscape is consolidating as markets recognize that specialization matters more than being a generic alternative to Ethereum. Avalanche positions itself in this multi-chain world with specific technical and ecosystem advantages. Infrastructure maturity around custody, bridges, and developer tooling makes alternative L1s more accessible heading into 2026.

The price prediction scenario projections below map different market share outcomes for AVAX across varying total crypto market sizes. Base case price predictions assume Avalanche maintains current ecosystem momentum, while moon scenarios factor in accelerated adoption, and bear cases reflect increased competitive pressure.


Disclosure

Educational purposes only, not financial advice. Crypto is volatile, do your own research and manage risk.

How to read it: Each band blends cycle analogues and market-cap share math with TA guardrails. Base assumes steady adoption and neutral or positive macro. Moon layers in a liquidity boom. Bear assumes muted flows and tighter liquidity.

TM Agent baseline:

Token Metrics lead metric for Avalanche price prediction, cashtag $AVAX, is a TM Grade of 66.2%, which maps to Hold, and the trading signal is bearish, indicating short-term downward momentum. Concise long-term numeric price prediction view, 12-month horizon: Token Metrics' scenarios center around a price band roughly between $15 and $40, with a base case price target near $25. Market context: Bitcoin's direction remains the primary market driver, so broader crypto risk-on conditions are required for $AVAX to reach the higher price prediction scenario.

Live details: Avalanche Token Details

Affiliate Disclosure: We may earn a commission from qualifying purchases made via this link, at no extra cost to you.

Key Takeaways for AVAX Price Prediction

  • Scenario driven: price prediction outcomes hinge on total crypto market cap; higher liquidity and adoption lift the price bands
  • Fundamentals: Fundamental Grade 91.63% (Community 82%, Tokenomics 100%, Exchange 100%, VC 97%, DeFi Scanner 83%)
  • Technology: Technology Grade 80.52% (Activity 80%, Repository 72%, Collaboration 93%, Security 59%, DeFi Scanner 83%)
  • TM Agent gist: AVAX shows decent fundamentals with a Hold grade, short-term momentum is bearish, and a 12-month price prediction range clusters around $15 to $40 with a base near $25
  • Education only, not financial advice

Avalanche Price Prediction: Scenario Analysis

Token Metrics price prediction scenarios span four market cap tiers, each representing different levels of crypto market maturity and liquidity:

8T Market Cap Price Prediction:

At an eight trillion dollar total crypto market cap, AVAX price prediction projects to $45.63 in bear conditions, $54.07 in the base case, and $62.50 in bullish scenarios.

16T Market Cap Price Prediction:

Doubling the market to sixteen trillion expands the price prediction range to $97.92 (bear), $123.23 (base), and $148.53 (moon).

23T Market Cap Price Prediction:

At twenty-three trillion, the price forecast scenarios show $150.20, $192.38, and $234.56 respectively.

31T Market Cap Price Prediction:

In the maximum liquidity scenario of thirty-one trillion, AVAX price prediction could reach $202.49 (bear), $261.54 (base), or $320.59 (moon).

Each tier assumes progressively stronger market conditions, with the base case reflecting steady growth and the moon case requiring sustained bull market dynamics.

Why Consider the Indices with Top-100 Exposure

Avalanche represents one opportunity among hundreds in crypto markets. Token Metrics Indices bundle AVAX with top one hundred assets for systematic exposure to the strongest projects. Single tokens face idiosyncratic risks that diversified baskets mitigate.

Historical index performance demonstrates the value of systematic diversification versus concentrated positions.

Join the early access list

What Is Avalanche?

Avalanche is a smart-contract platform known for high throughput, low latency, and a modular subnet architecture. It aims to support decentralized finance, gaming, and enterprise applications with fast finality and cost-efficient transactions.

AVAX is the native token used for fees, staking, and network security, and it powers activity across application subnets. The ecosystem positions Avalanche among leading Layer 1s competing for developer mindshare and user adoption.

Token Metrics AI Analysis for Price Prediction

Token Metrics AI provides comprehensive context on Avalanche's positioning and challenges that inform our price prediction models.

Vision: Avalanche aims to provide a highly scalable, secure, and decentralized platform for launching custom blockchains and decentralized applications. Its vision centers on enabling a global, open financial system and supporting a diverse ecosystem of interoperable blockchains.

Problem: Many blockchain networks face trade-offs between speed, security, and decentralization, often resulting in high fees and slow transaction times during peak demand. Avalanche addresses the need for a scalable and efficient infrastructure that can support widespread adoption of dApps and enterprise use cases without compromising on performance or security.

Solution: Avalanche uses a novel consensus mechanism that achieves rapid finality with low energy consumption, differentiating it from traditional Proof-of-Work systems. It employs a three-chain architecture—Exchange Chain (X-Chain), Platform Chain (P-Chain), and Contract Chain (C-Chain)—to separate functions like asset creation, staking, and smart contract execution, enhancing efficiency and scalability.

Market Analysis: Avalanche operates in the competitive Layer 1 blockchain space. It differentiates itself through its consensus protocol and support for subnet-based custom blockchains. Adoption is influenced by developer activity, partnerships, and integration with major DeFi protocols, with risks from technological shifts and regulatory developments.

Fundamental and Technology Snapshot from Token Metrics

Fundamental Grade: 91.63% (Community 82%, Tokenomics 100%, Exchange 100%, VC 97%, DeFi Scanner 83%).


Technology Grade: 80.52% (Activity 80%, Repository 72%, Collaboration 93%, Security 59%, DeFi Scanner 83%).


Catalysts That Skew Bullish for Price Prediction

  • Institutional and retail access expands with ETFs, listings, and integrations
  • Macro tailwinds from lower real rates and improving liquidity
  • Product or roadmap milestones such as upgrades, scaling, or partnerships
  • These factors could push AVAX toward higher price prediction targets

Risks That Skew Bearish for Price Prediction

  • Macro risk-off from tightening or liquidity shocks
  • Regulatory actions or infrastructure outages
  • Concentration in validator economics and competitive displacement
  • These factors could push AVAX toward lower price prediction scenarios

FAQs: Avalanche Price Prediction

Can AVAX reach $200 according to price predictions?

Based on the price prediction scenarios, AVAX could reach $200 in the 31T bear case at $202.49. The 31T tier also shows $261.54 in the base case price forecast and $320.59 in the moon case. Not financial advice.

Can AVAX 10x from current levels based on price predictions?

At a current price of $19.62, a 10x would reach $196.20. This falls within the 31T bear, base, and moon case price predictions, and the 23T moon case at $234.56. Bear in mind that 10x returns require substantial market cap expansion. Not financial advice.

Should I buy AVAX now or wait based on price predictions?

Timing depends on your risk tolerance and macro outlook. Current price of $19.62 sits below the 8T bear case price prediction at $45.63. Dollar-cost averaging may reduce timing risk. Not financial advice.

What is the 2027 Avalanche price prediction?

Based on Token Metrics analysis, the 2027 price prediction for Avalanche centers around $25 in the base case under current market conditions, with a range between $15 and $40 depending on market scenarios. Bullish price predictions range from $54.07 to $320.59 across different total crypto market cap environments.

What drives AVAX price predictions?

AVAX price predictions are driven by subnet adoption, DeFi ecosystem growth, developer activity, institutional partnerships, and overall Layer 1 competition. The strong fundamentals (91.63% grade) support long-term price potential, though short-term bearish signals suggest caution. Market-wide crypto conditions remain the primary driver for reaching upper price prediction targets.

Can AVAX reach $300 by 2027?

According to our price prediction models, AVAX could reach $300+ in the 31T moon case where it projects to $320.59. This price prediction outcome requires the total crypto market to reach 31 trillion and Avalanche to maintain strong competitive positioning with accelerated subnet adoption. Not financial advice.


Next Steps

Disclosure

Educational purposes only, not financial advice. Crypto is volatile, do your own research and manage risk.

Powered by Token Metrics

Our team delivers scenario-driven price projections, in-depth grades, and actionable indices to empower smarter crypto investing—with both human and AI insights.

Research

Hedera Price Prediction 2027: $0.10-$1.42 Target Analysis

Token Metrics Team
8 min read

Hedera Price Prediction: Portfolio Context for HBAR in the 2027 Landscape

Layer 1 tokens like Hedera represent bets on specific blockchain architectures winning developer and user mindshare. HBAR carries both systematic crypto risk and unsystematic risk from Hedera's technical roadmap execution and ecosystem growth. Multi-chain thesis suggests diversifying across several L1s rather than concentrating in one, since predicting which chains will dominate remains difficult.

The price prediction projections below show how HBAR might perform under different market cap scenarios. While Hedera may have strong fundamentals, prudent portfolio construction balances L1 exposure across Ethereum, competing smart contract platforms, and Bitcoin to capture the sector without overexposure to any single chain's fate.


Disclosure

Educational purposes only, not financial advice. Crypto is volatile, do your own research and manage risk.

How to read this price prediction:

Each band blends cycle analogues and market-cap share math with TA guardrails. Base assumes steady adoption and neutral or positive macro. Moon layers in a liquidity boom. Bear assumes muted flows and tighter liquidity.

TM Agent baseline:

Token Metrics lead metric for Hedera price prediction, cashtag $HBAR, is a TM Grade of 61.8%, which maps to Hold, and the trading signal is bearish, indicating short-term downward momentum. This means Token Metrics views $HBAR as having reasonably solid fundamentals but limited conviction for strong outperformance in the near term.

A concise long-term numeric price prediction view for a 12-month horizon: Token Metrics scenarios center around a range of about $0.06 to $0.18, with a base case price target near $0.10, reflecting steady ecosystem growth, moderate adoption of Hedera services, and continued enterprise partnerships. Implication: if Bitcoin and broader crypto risk appetite improve, $HBAR could revisit the higher end of the price prediction range, while a risk-off market or slower-than-expected developer traction would keep it toward the lower bound.

Token Details

Key Takeaways

  • Scenario driven, outcomes hinge on total crypto market cap, higher liquidity and adoption lift the bands.
  • Single-asset concentration amplifies both upside and downside versus diversified approaches.
  • Fundamentals: Fundamental Grade 81.08% (Community 74%, Tokenomics 100%, Exchange 100%, VC 59%, DeFi Scanner 85%).
  • Technology: Technology Grade 62.39% (Activity 58%, Repository 68%, Collaboration 74%, Security 56%, DeFi Scanner 85%).
  • TM Agent gist: bearish short term, range view with upside if crypto risk appetite improves.
  • Education only, not financial advice.

Hedera Price Prediction: Scenario Analysis

Token Metrics price prediction scenarios span four market cap tiers, each representing different levels of crypto market maturity and liquidity:

8T Market Cap Price Prediction:

At an 8 trillion dollar total crypto market cap, HBAR price prediction projects to $0.27 in bear conditions, $0.32 in the base case, and $0.37 in bullish scenarios.

16T Market Cap Price Prediction:

Doubling the market to 16 trillion expands the price prediction range to $0.42 (bear), $0.57 (base), and $0.72 (moon).

23T Market Cap Price Prediction:

At 23 trillion, the price forecast scenarios show $0.56, $0.82, and $1.07 respectively.

31T Market Cap Price Prediction:

In the maximum liquidity scenario of 31 trillion, HBAR price prediction could reach $0.71 (bear), $1.07 (base), or $1.42 (moon).

These price prediction ranges illustrate potential outcomes for concentrated HBAR positions, but investors should weigh whether single-asset exposure matches their risk tolerance or whether diversified strategies better suit their objectives.

The Case for Diversified Index Exposure

Professional investors across asset classes prefer diversified exposure over concentrated bets for good reason. Hedera faces numerous risks - technical vulnerabilities, competitive pressure, regulatory targeting, team execution failure - any of which could derail HBAR performance independent of broader market conditions. Token Metrics Indices spread this risk across one hundred tokens, ensuring no single failure destroys your crypto portfolio.

Diversification becomes especially critical in crypto given the sector's nascency and rapid evolution. Technologies and narratives that dominate today may be obsolete within years as the space matures. By holding HBAR exclusively, you're betting not only on crypto succeeding but on Hedera specifically remaining relevant. Index approaches hedge against picking the wrong horse while maintaining full crypto exposure.

Tax efficiency and rebalancing challenges also favor indices over managing concentrated positions. Token Metrics Indices handle portfolio construction, rebalancing, and position sizing systematically, eliminating the emotional and logistical burden of doing this manually with multiple tokens.

Early access to Token Metrics Indices 

What Is Hedera?

Hedera is a high-performance public ledger that emphasizes speed, low fees, and energy efficiency, positioning itself for enterprise and decentralized applications. It uses a unique Hashgraph consensus that enables fast finality and high throughput, paired with a council-governed model that targets real-world use cases like payments, tokenization, and decentralized identity.

HBAR is the native token used for fees, staking, and network security, and it supports smart contracts and decentralized file storage. Adoption draws from partnerships and integrations, though decentralization levels and reliance on institutional demand are often discussed in the community.

Token Metrics AI Analysis for Price Prediction

Token Metrics AI provides comprehensive context on Hedera's positioning and challenges that inform our price prediction models.

  • Vision: Hedera's vision is to provide a secure, fair, and scalable distributed ledger technology platform that supports decentralized applications and enterprise use cases globally. It emphasizes governed decentralization, aiming to combine the benefits of distributed systems with responsible oversight through its council-based governance model.
  • Problem: Many blockchain networks face trade-offs between scalability, security, and decentralization, often resulting in high transaction fees, slow processing times, or environmental concerns. Hedera aims to address these limitations by offering a system that supports high throughput and fast finality without sacrificing security or incurring significant energy costs, making it suitable for both enterprise and decentralized applications.
  • Solution: Hedera uses the Hashgraph consensus algorithm, a directed acyclic graph (DAG)-based approach that achieves asynchronous Byzantine fault tolerance, enabling fast, secure, and fair transaction processing. The network supports smart contracts, tokenization, and decentralized file storage, with HBAR serving as the native token for fees, staking, and network security. Its council-governed model aims to ensure stability and trust, particularly for institutional and enterprise users.
  • Market Analysis: Hedera operates in the Layer 1 blockchain space, competing with high-throughput platforms like Solana, Avalanche, and Algorand, while differentiating through its Hashgraph consensus and governed governance model. It targets enterprise adoption, focusing on use cases in supply chain, payments, and asset tokenization, which sets it apart from more community-driven or DeFi-centric networks. Adoption is influenced by strategic partnerships, developer engagement, and real-world integrations rather than speculative activity. Key risks include competition from established and emerging blockchains, regulatory scrutiny around governance tokens, and challenges in achieving broad decentralization.

Fundamental and Technology Snapshot from Token Metrics

Fundamental Grade: 81.08% (Community 74%, Tokenomics 100%, Exchange 100%, VC 59%, DeFi Scanner 85%).


Technology Grade: 62.39% (Activity 58%, Repository 68%, Collaboration 74%, Security 56%, DeFi Scanner 85%).


Catalysts That Skew Bullish for Price Prediction

  • Institutional and retail access expands with ETFs, listings, and integrations
  • Macro tailwinds from lower real rates and improving liquidity
  • Product or roadmap milestones such as upgrades, scaling, or partnerships
  • These factors could push HBAR toward higher price prediction targets

Risks That Skew Bearish for Price Prediction

  • Macro risk-off from tightening or liquidity shocks
  • Regulatory actions or infrastructure outages
  • Concentration in validator economics and competitive displacement
  • Protocol-specific execution risk and competitive pressure from alternatives
  • These factors could push HBAR toward lower price prediction scenarios

FAQs: Hedera Price Prediction

Can HBAR reach $1.00 according to price predictions?

Yes. Based on the price prediction scenarios, HBAR could reach $1.00 or above in the higher tiers. The 23T tier projects $1.07 in the moon case price forecast and the 31T tier projects $1.42 in the moon case. Achieving this price prediction requires broad market cap expansion and Hedera maintaining competitive position. Not financial advice.

What price could HBAR reach in the moon case price prediction?

Moon case price predictions range from $0.37 at 8T to $1.42 at 31T total crypto market cap. These price prediction scenarios assume maximum liquidity expansion and strong Hedera adoption. Diversified strategies aim to capture upside across multiple tokens rather than betting exclusively on any single moon scenario. Not financial advice.

What's the risk/reward profile for HBAR price prediction?

Risk and reward in our price prediction model span from $0.27 in the lowest bear case to $1.42 in the highest moon case. Downside risks include regulatory or infrastructure setbacks and competitive pressure, while upside drivers include improved liquidity and enterprise adoption. Concentrated positions amplify both tails, while diversified strategies smooth outcomes.

What is the 2027 Hedera price prediction?

Based on Token Metrics analysis, the 2027 price prediction for Hedera centers around $0.10 in the base case under current market conditions, with a range between $0.06 and $0.18 depending on market scenarios. Bullish price predictions range from $0.32 to $1.42 across different total crypto market cap environments.

What drives HBAR price predictions?

HBAR price predictions are driven by enterprise adoption of Hashgraph technology, institutional partnerships (Google Cloud, IBM, Boeing), council governance decisions, and competition from other Layer 1 platforms. The strong fundamentals (81.08% grade) support long-term price potential, though short-term bearish signals suggest caution. Enterprise use case development remains the primary driver for reaching upper price prediction targets.

Can HBAR reach $0.50 by 2027?

According to our price prediction models, HBAR could reach $0.50+ in multiple scenarios: the 16T base case ($0.57), 16T moon case ($0.72), and all higher market cap tiers. This price prediction outcome requires steady crypto market growth (16T+ total market cap) and Hedera maintaining strong enterprise partnerships. Not financial advice.


Next Steps

Disclosure

Educational purposes only, not financial advice. Crypto is volatile, concentration amplifies risk, and diversification is a fundamental principle of prudent portfolio construction. Do your own research and manage risk appropriately.

Research

Predicting LEO Token Price in 2027: Scenario Analysis & On-Chain Scores

Token Metrics Team
5 min read

LEO Token Valuation Framework: Market Cap Scenarios

Exchange tokens desrive value from trading volume and platform revenue, creating linkage between crypto market activity and LEO price action. LEO Token delivers utility through reduced trading fees and enhanced platform services on Bitfinex and iFinex across Ethereum and EOS. Token Metrics scenarios below model LEO outcomes across different total crypto market cap environments.


Disclosure

Educational purposes only, not financial advice. Crypto is volatile, do your own research and manage risk.

How to read it: Each band blends cycle analogues and market-cap share math with TA guardrails. Base assumes steady adoption and neutral or positive macro. Moon layers in a liquidity boom. Bear assumes muted flows and tighter liquidity.

TM Agent baseline: Token Metrics probabilities favor a modest range between about $5 and $15, with a base case around current levels near $9, conditional on exchange token utility remaining steady, and downside risk if centralized exchange macro pressure increases.

Live details: Token Details 

Key Takeaways

  • Scenario driven, outcomes hinge on total crypto market cap, higher liquidity and adoption lift the bands.
  • TM Agent gist: 12-month horizon favors $5 to $15 range with base case near $9, contingent on stable exchange utility.
  • Education only, not financial advice.

Scenario Analysis

Token Metrics scenarios span four market cap tiers reflecting different crypto market maturity levels:

  • 8T: At 8 trillion total crypto market cap, LEO projects to $11.35 in bear conditions, $12.92 in the base case, and $14.48 in bullish scenarios.  
  • 16T: At 16 trillion total crypto market cap, LEO projects to $14.82 in bear conditions, $19.51 in the base case, and $24.20 in bullish scenarios.  
  • 23T: At 23 trillion total crypto market cap, LEO projects to $18.28 in bear conditions, $26.10 in the base case, and $33.92 in bullish scenarios.  
  • 31T: At 31 trillion total crypto market cap, LEO projects to $21.74 in bear conditions, $32.69 in the base case, and $43.63 in bullish scenarios.  

What Is LEO Token?

LEO Token is the native utility token of the Bitfinex and iFinex ecosystem, designed to provide benefits like reduced trading fees, enhanced lending and borrowing terms, and access to exclusive features on the platform. It operates on both Ethereum (ERC-20) and EOS blockchains, offering flexibility for users.

The primary role of LEO is to serve as a utility token within the exchange ecosystem, enabling fee discounts, participation in token sales, and other platform-specific advantages. Common usage patterns include holding LEO to reduce trading costs and utilizing it for enhanced platform services, positioning it primarily within the exchange token sector.

Catalysts That Skew Bullish

  • Institutional and retail access expands with ETFs, listings, and integrations.
  • Macro tailwinds from lower real rates and improving liquidity.
  • Product or roadmap milestones such as upgrades, scaling, or partnerships.

Risks That Skew Bearish

  • Macro risk-off from tightening or liquidity shocks.
  • Regulatory actions or infrastructure outages.
  • Concentration or validator economics and competitive displacement.

FAQs

What gives LEO value?

LEO accrues value through reduced trading fees and enhanced platform services within the Bitfinex and iFinex ecosystem. Demand drivers include exchange usage and access to platform features, while supply dynamics follow the token’s exchange utility design. Value realization depends on platform activity and user adoption.

What price could LEO reach in the moon case?

Moon case projections range from $14.48 at 8T to $43.63 at 31T. These scenarios require maximum market cap expansion and strong exchange activity. Not financial advice.  

Next Steps

Curious how these forecasts are made? Token Metrics delivers LEO on-chain grades, forecasts, and deep research on 6,000+ tokens. Instantly compare fundamentals, on-chain scores, and AI-powered predictions.

Disclosure

Educational purposes only, not financial advice. Crypto is volatile, do your own research and manage risk.

Choose from Platinum, Gold, and Silver packages
Reach with 25–30% open rates and 0.5–1% CTR
Craft your own custom ad—from banners to tailored copy
Perfect for Crypto Exchanges, SaaS Tools, DeFi, and AI Products