Back to blog
Crypto Basics

What is Litecoin Halving and its Impact?

Learn everything about Litecoin halving, its mechanism, and its history. Also, discover its impact on mining rewards and market value.
S. Vishwa
6 Minutes
Want Smarter Crypto Picks—Free?
See unbiased Token Metrics Ratings for BTC, ETH, and top alts.
Thank you! Your submission has been received!
Oops! Something went wrong while submitting the form.
 No credit card | 1-click unsubscribe

Cryptocurrency enthusiasts and investors always look for events that can potentially impact their favorite digital assets' price and market dynamics. One such event that often generates excitement and speculation is halving. 

In this comprehensive guide, we will delve into the world of Litecoin halving, exploring its meaning, the potential impact on price, and strategies for trading this critical milestone. So, fasten your seatbelts and join us on this journey to uncover the secrets of Litecoin halving.

Understanding Litecoin Halving

Litecoin, often referred to as Bitcoin's "little brother," shares many similarities with its more famous counterpart. One of these similarities is the mechanism of halving. 

Litecoin halving is a process that occurs approximately every four years, reducing the mining rewards for validating transactions on the Litecoin blockchain. 

This reduction in rewards has significant implications for miners, the Litecoin ecosystem, and the price of Litecoin itself.

Unlike traditional fiat currencies, which can be printed at will by central banks, cryptocurrencies like Litecoin have a limited supply. In the case of Litecoin, the maximum supply is set at 84 million coins. 

The purpose of halving is to control the rate at which new Litecoins are introduced into circulation, ensuring a gradual and predictable issuance of new coins. By reducing the block rewards, Litecoin aims to maintain scarcity and prevent inflationary pressures.

The Mechanics of Litecoin Halving

To understand Litecoin halving, we must first grasp the concept of block rewards. New Litecoins are created when miners add new transactions to blocks. 

The miner who successfully adds a block to the Litecoin blockchain is rewarded with a certain amount of Litecoin. This reward consists of a fixed number of new Litecoins and transaction fees included in the block.

Litecoin halving occurs after every 840,000 blocks are mined. Considering the average block mining rate of 2.5 minutes, this event takes place approximately once every four years. 

During halving, the block reward is cut in half, reducing the number of Litecoins awarded to miners for validating transactions. This process will continue until no more Litecoins are left to mine, which is estimated to occur around the year 2142.

The Impact of Litecoin Halving

Litecoin halving has a twofold impact: on miners and on the price of Litecoin itself. Let's explore these effects in more detail:

Impact on Miners: Reducing block rewards directly affects miners' income. With each halving event, miners receive fewer Litecoins for their efforts in validating transactions. 

This decrease in rewards can have profound implications for the mining community. On one hand, it may discourage less serious miners who are primarily motivated by potential financial gains. 

On the other hand, it can create an environment where only committed and dedicated miners continue to operate, ensuring the security and stability of the Litecoin network.

Also Read - How to Mine Litecoin?

Impact on Price: The halving event also has implications for the price of Litecoin. Reducing mining rewards leads to a decrease in the supply of newly minted Litecoins. 

This decrease in supply, coupled with the constant demand for Litecoin, can create a supply-demand imbalance, potentially driving up the price of the LTC

However, it is essential to note that the price action following halving events is highly unpredictable and influenced by various factors such as market sentiment, investor behavior, and overall market conditions.

Litecoin Halving History

Litecoin has already experienced halving events in its history. Let's take a closer look at some of Litecoin's halving dates:

Litecoin Halving Dates

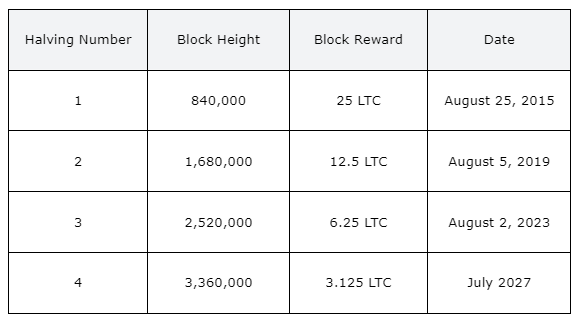
As per the existing schedule, Litecoin halving events occur approximately every four years. The next halving is expected to occur in 2027, further reducing the block reward to 1.5625 LTC. These halving events play a vital role in controlling the issuance of new Litecoins and maintaining scarcity in the long run.

Litecoin Halving and Price Predictions

One of the most common questions surrounding Litecoin's halving is how it will impact the price of the cryptocurrency. 

While it is challenging to provide an accurate prediction, historical data, and market trends can give us some insights into potential price movements.

Previous Litecoin Halving Price Trends

Looking back at the previous halvings, Litecoin's price exhibited distinct patterns following each event. Let's examine the price trends after the first and second Litecoin halvings:

First Litecoin Halving (August 25, 2015)

After the first halving, Litecoin's price initially traded sideways for over a year, entering a phase of stagnation. 

While a buy-and-hold strategy may not have been the most profitable approach during this period, traders employing ranging market strategies could have capitalized on the price fluctuations. 

This stagnation phase was followed by a bull phase, characterized by a significant increase in Litecoin's price over a period of six months to a year. 

A pullback/bear phase eventually succeeded the bull phase, marked by a correction lasting approximately a year. Finally, Litecoin entered an accumulation phase, likely driven by pre-halving accumulation, before the cycle repeated itself with the second halving.

Also Read - Next Crypto Bull Run

Second Litecoin Halving (August 5, 2019)

The second halving event saw a different price trajectory for Litecoin. Prior to the halving, Litecoin experienced an upward trend, reaching a peak in July 2019. 

However, the price started to decline immediately after the halving, leading to a period of bearish sentiment. The price continued to fall until it stabilized, and the market entered a period of consolidation and accumulation.

Price Predictions for Future Halvings

Predicting the exact impact of the upcoming Litecoin halving on its price is challenging. While historical data provides some insights, it is crucial to consider other fundamental factors that influence Litecoin's price volatility and trends. 

Factors such as Bitcoin's price movements, the level of adoption of Litecoin, and overall market sentiment can significantly influence the price of Litecoin in the long run.

While past halving events have historically positively impacted the price of Litecoin, it is important to note that past performance does not guarantee future results. 

Market conditions and cryptocurrency prices can be highly volatile, and the future performance of Litecoin is subject to various factors and uncertainties. 

Therefore, it is advisable to conduct thorough research, consider the risks associated with cryptocurrency investments, and consult a financial advisor before making any investment decisions.

Conclusion

Litecoin halving is a significant event in the world of cryptocurrencies, with potential implications for miners, the price of Litecoin, and trading strategies. 

Understanding the mechanics and history of Litecoin halving can provide valuable insights for investors and traders. 

While the exact impact of halving on Litecoin's price is uncertain, it is essential to consider various factors and conduct thorough research before making any investment decisions. 

Whether you choose to trade Litecoin halving or explore other avenues to grow your Litecoin holdings, always remember to stay informed, manage risk effectively, and consult with professionals when needed.

Disclaimer

The information provided on this website does not constitute investment advice, financial advice, trading advice, or any other advice, and you should not treat any of the website's content as such.

Token Metrics does not recommend buying, selling, or holding any cryptocurrency. Conduct your due diligence and consult your financial advisor before making investment decisions.

Build Smarter Crypto Apps &
AI Agents in Minutes, Not Months
Real-time prices, trading signals, and on-chain insights all from one powerful API.
Grab a Free API Key
About Token Metrics
Token Metrics: AI-powered crypto research and ratings platform. We help investors make smarter decisions with unbiased Token Metrics Ratings, on-chain analytics, and editor-curated “Top 10” guides. Our platform distills thousands of data points into clear scores, trends, and alerts you can act on.
30 Employees
analysts, data scientists, and crypto engineers
Daily Briefings
concise market insights and “Top Picks”
Transparent & Compliant
Sponsored ≠ Ratings; research remains independent
Want Smarter Crypto Picks—Free?
See unbiased Token Metrics Ratings for BTC, ETH, and top alts.
Thank you! Your submission has been received!
Oops! Something went wrong while submitting the form.
 No credit card | 1-click unsubscribe
Token Metrics Team
Token Metrics Team

Recent Posts

Research

Uniswap Price Prediction 2027: $13.50-$43 Target Analysis

Token Metrics Team
8 min read

Uniswap Price Prediction: Market Context for UNI in the 2027 Case

DeFi protocols are maturing beyond early ponzi dynamics toward sustainable revenue models. Uniswap operates in this evolving landscape where real yield and proven product market fit increasingly drive valuations rather than speculation alone. Growing regulatory pressure on centralized platforms creates tailwinds for decentralized alternatives.

The price prediction scenario bands below reflect how UNI might perform across different total crypto market cap environments. Each tier represents a distinct liquidity regime, from bear conditions with muted DeFi activity to moon price prediction scenarios where decentralized infrastructure captures significant value from traditional finance.


Disclosure

Educational purposes only, not financial advice. Crypto is volatile, do your own research and manage risk.

How to read this price prediction:

Each band blends cycle analogues and market cap share math with TA guardrails. Base assumes steady adoption and neutral or positive macro. Moon layers in a liquidity boom. Bear assumes muted flows and tighter liquidity.

TM Agent baseline:

Token Metrics TM Grade is 69%, Buy, and the trading signal is bullish. Price prediction scenarios cluster roughly between $6.50 and $28, with a base case price target near $13.50.

Live details: Uniswap Token Details 

Affiliate Disclosure: We may earn a commission from qualifying purchases made via this link, at no extra cost to you.

Key Takeaways

  • Scenario driven, outcomes hinge on total crypto market cap, higher liquidity and adoption lift the bands.
  • Fundamentals: Fundamental Grade 79.88% (Community 77%, Tokenomics 100%, Exchange 100%, VC 66%, DeFi Scanner 62%).
  • Technology: Technology Grade 86.88% (Activity 72%, Repository 72%, Collaboration 100%, Security N/A, DeFi Scanner 62%).
  • TM Agent gist: bullish bias with a base case near $13.50 and a broad range between $6.50 and $28.
  • Education only, not financial advice.

Uniswap Price Prediction: Scenario Analysis

Token Metrics price prediction scenarios span four market cap tiers, each representing different levels of crypto market maturity and liquidity:

8T Market Cap Price Prediction:

At an 8 trillion dollar total crypto market cap, UNI price prediction projects to $8.94 in bear conditions, $10.31 in the base case, and $11.68 in bullish scenarios.

16T Market Cap Price Prediction:

Doubling the market to 16 trillion expands the price prediction range to $14.17 (bear), $18.29 (base), and $22.41 (moon).

23T Market Cap Price Prediction:

At 23 trillion, the price forecast scenarios show $19.41, $26.27, and $33.14 respectively.

31T Market Cap Price Prediction:

In the maximum liquidity scenario of 31 trillion, UNI price prediction could reach $24.64 (bear), $34.25 (base), or $43.86 (moon).

Each tier assumes progressively stronger market conditions, with the base case price prediction reflecting steady growth and the moon case requiring sustained bull market dynamics.

Why Consider the Indices with Top-100 Exposure

Uniswap represents one opportunity among hundreds in crypto markets. Token Metrics Indices bundle UNI with top one hundred assets for systematic exposure to the strongest projects. Single tokens face idiosyncratic risks that diversified baskets mitigate.

Historical index performance demonstrates the value of systematic diversification versus concentrated positions.

Join the early access list

What Is Uniswap?

Uniswap is a decentralized exchange protocol built on Ethereum that enables token swaps using automated market makers instead of order books. It aims to provide open access to liquidity for traders, developers, and applications through transparent smart contracts.

UNI is the governance token that lets holders vote on protocol upgrades and parameters, aligning incentives across the ecosystem. The protocol is a market leader in decentralized exchange activity with broad integration across wallets and DeFi apps.

Token Metrics AI Analysis for Price Prediction

Token Metrics AI provides comprehensive context on Uniswap's positioning and challenges that inform our price prediction models.

Vision: Uniswap aims to create a fully decentralized and permissionless financial market where anyone can trade or provide liquidity without relying on centralized intermediaries. Its vision emphasizes open access, censorship resistance, and community driven governance.

Problem: Traditional exchanges require trusted intermediaries to match buyers and sellers, creating barriers to access, custody risks, and potential for censorship. In DeFi, the lack of efficient, trustless mechanisms for token swaps limits interoperability and liquidity across applications.

Solution: Uniswap solves this by using smart contracts to create liquidity pools funded by users who earn trading fees in return. The protocol automatically prices assets using a constant product formula, enabling seamless swaps. UNI token holders can participate in governance, influencing parameters like fee structures and protocol upgrades.

Market Analysis: Uniswap operates within the broader DeFi and Ethereum ecosystems, competing with other decentralized exchanges like SushiSwap, Curve, and Balancer. It is a market leader in terms of cumulative trading volume and liquidity depth. Adoption is strengthened by strong developer activity, widespread integration across wallets and dApps, and a large user base.

Fundamental and Technology Snapshot from Token Metrics

Fundamental Grade: 79.88% (Community 77%, Tokenomics 100%, Exchange 100%, VC 66%, DeFi Scanner 62%).


Technology Grade: 86.88% (Activity 72%, Repository 72%, Collaboration 100%, Security N/A, DeFi Scanner 62%).

Catalysts That Skew Bullish for Price Prediction

  • Institutional and retail access expands with ETFs, listings, and integrations
  • Macro tailwinds from lower real rates and improving liquidity
  • Product or roadmap milestones such as upgrades, scaling, or partnerships
  • These factors could push UNI toward higher price prediction targets

Risks That Skew Bearish for Price Prediction

  • Macro risk off from tightening or liquidity shocks
  • Regulatory actions or infrastructure outages
  • Competitive displacement across DEXs or changes to validator and liquidity incentives
  • These factors could push UNI toward lower price prediction scenarios

FAQs: Uniswap Price Prediction

Will UNI hit $20 by 2027 according to price predictions?

The 16T price prediction scenario shows UNI at $18.29 in the base case, which does not exceed $20. However, the 23T base case shows $26.27, surpassing the $20 target. Price prediction outcome depends on total crypto market cap growth and Uniswap maintaining market share. Not financial advice.

Can UNI 10x from current levels based on price predictions?

At current price of $6.30, a 10x would reach $63.00. This falls within none of the listed price prediction scenarios, which top out at $43.86 in the 31T moon case. Bear in mind that 10x returns require substantial market cap expansion beyond our modeled scenarios. Not financial advice.

What price could UNI reach in the moon case price prediction?

Moon case price predictions range from $11.68 at 8T to $43.86 at 31T total crypto market cap. These price prediction scenarios assume maximum liquidity expansion and strong Uniswap adoption. Not financial advice.

What is the 2027 Uniswap price prediction?

Based on Token Metrics analysis, the 2027 price prediction for Uniswap centers around $13.50 in the base case under current market conditions, with a range between $6.50 and $28 depending on market scenarios. Bullish price predictions with strong market conditions range from $10.31 to $43.86 across different total crypto market cap environments.

What drives UNI price predictions?

UNI price predictions are driven by DEX trading volume, liquidity provider activity, governance participation, protocol fee revenue, and competition from other decentralized exchanges. The strong technology grade (86.88%) and bullish signal support upward price potential. DeFi adoption rates and regulatory clarity around decentralized exchanges remain primary drivers for reaching upper price prediction targets.

Can UNI reach $30-$40 by 2027?

According to our price prediction models, UNI could reach $30-$40 in the 23T moon case ($33.14) and in the 31T scenarios where the base case is $34.25 and the moon case is $43.86. These price prediction outcomes require significant crypto market expansion and Uniswap maintaining DEX market leadership. Not financial advice.


Next Steps

Disclosure

Educational purposes only, not financial advice. Crypto is volatile, do your own research and manage risk.

Why Use Token Metrics for Uniswap Research?

  • Get on-chain ratings, AI-powered scenario projections, backtested indices, and exclusive insights for Uniswap and other top-100 crypto assets.
  • Spot emerging trends before the crowd and manage risk with our transparent AI grades.
  • Token Metrics helps you save time, avoid hidden pitfalls, and discover data-driven opportunities in DeFi.
Research

Bittensor Price Prediction 2025-2027 | TAO Forecast & Analysis

Token Metrics Team
7 min read

Understanding Bittensor's Speculative Nature

Bittensor operates as a community-driven token where price action stems primarily from social sentiment, attention cycles, and speculative trading rather than fundamental value drivers. TAO exhibits extreme volatility with no defensive characteristics or revenue-generating mechanisms typical of utility tokens. Token Metrics price prediction scenarios below provide technical forecasts across different market cap environments, though meme and speculative tokens correlate more strongly with viral trends and community engagement than systematic market cap models. Positions in TAO should be sized as high-risk speculative bets with potential for total loss.


Disclosure
Educational purposes only, not financial advice. Crypto is volatile, do your own research and manage risk.

How to read our price prediction methodology: Each band blends cycle analogues and market-cap share math with TA guardrails. Base assumes steady adoption and neutral or positive macro. Moon layers in a liquidity boom. Bear assumes muted flows and tighter liquidity. For speculative tokens, actual price prediction outcomes depend heavily on social trends and community momentum beyond what market cap models capture.

Bittensor (TAO) Price Prediction: TM Agent Baseline

Token Metrics long term price prediction view for Bittensor, cashtag $TAO. Lead metric first, Token Metrics TM Grade is 62%, Hold, and the trading signal is bullish, indicating modest project fundamentals and short-term upward momentum. Market context, Bitcoin direction and appetite for AI and research-oriented crypto projects determine capital flows into niche tokens like $TAO, so broader risk-on conditions would help sustained gains.

Concise 12-month price prediction numeric view: Token Metrics scenarios cluster roughly between $0.45 and $2.20, with a base case near $1.05, reflecting current network usage, developer activity, and token supply dynamics. Implication, if AI crypto interest and on-chain usage grow materially $TAO could approach the upper bound, while in a risk-off market or if network adoption stalls it would likely move toward the lower bound.

  • 16T: At 16 trillion, the range is $5,539.08, $6,710.41, and $7,881.74.

Token Details 

Key Takeaways

  • Highly speculative asset driven by sentiment and attention rather than fundamentals.
  • Scenario driven price predictions, outcomes hinge on total crypto market cap and viral momentum.
  • Extreme volatility characteristic - TAO can experience double-digit percentage moves daily.
  • TM Agent gist: conditions and usage growth could expand the upper range, risk-off or weak adoption could compress outcomes.
  • Entertainment risk only, not financial advice.

Bittensor Price Prediction: Scenario Analysis

Token Metrics price prediction scenarios provide technical price bands across market cap tiers:

  • 8T Price Prediction: At 8 trillion total crypto market cap, TAO projects to $2,129.86 (bear), $2,520.30 (base), and $2,910.75 (moon).
  • 16T Price Prediction: At 16 trillion, the range is $5,539.08, $6,710.41, and $7,881.74.
  • 23T Price Prediction: At 23 trillion, scenarios show $8,948.30, $10,900.52, and $12,852.74.
  • 31T Price Prediction: At 31 trillion, projections reach $12,357.53, $15,090.63, or $17,823.73.

These technical price prediction ranges assume speculative tokens maintain market cap share proportional to overall crypto growth. Actual outcomes for speculative tokens typically exhibit higher variance and stronger correlation to social trends than these models predict.

What Is Bittensor?

Bittensor is a decentralized network focused on machine learning markets, where participants contribute and consume AI services. Unlike utility tokens with broad real-world use cases, TAO operates in a niche AI context and often trades as a speculative community symbol.

TAO is the network token used for incentives and participation. Market performance depends heavily on broader interest in AI‑related crypto themes and community engagement around the project.

Risks That Skew Bearish on TAO Price Predictions

  • Extreme volatility from pure sentiment-driven price action with no fundamental support.
  • Attention cycles shift rapidly, leaving early viral tokens abandoned as new memes emerge.
  • Liquidity can evaporate quickly during downturns, creating severe slippage and exit difficulty.
  • Regulatory scrutiny may target speculative tokens as securities or gambling instruments.
  • Macro risk-off environments hit speculative assets hardest, with meme coins showing largest drawdowns.
  • Community fragmentation or developer abandonment can eliminate remaining narrative support.

FAQs About Bittensor Price Prediction

Will TAO 10x from here?

Yes, at a current price of $427.67, a 10x reaches $4,276.70. This level appears in the 16T bear and above price prediction scenarios. Meme and speculative tokens can 10x rapidly during viral moments but can also lose 90%+ just as quickly. Position sizing for potential total loss is critical. Not financial advice.

What are the biggest risks to TAO price predictions?

Primary risks include attention shifting to newer narratives, community fragmentation, developer abandonment, regulatory crackdowns, and liquidity collapse during downturns. Unlike utility tokens with defensive characteristics, TAO has no fundamental floor. Price can approach zero if community interest disappears. Total loss is a realistic outcome.


Next Steps

Disclosure

Educational purposes only, not financial advice. TAO is a highly speculative asset with extreme volatility and high risk of total loss. Speculative tokens operate as entertainment and gambling instruments rather than investments. Only allocate capital you can afford to lose entirely. Do your own research and manage risk appropriately.

About Token Metrics

Token Metrics is a cutting-edge crypto analytics and research platform that offers ratings, price predictions, and unique AI-driven insights for investors.

Research

Polkadot Price Prediction 2027 | DOT Forecast & Scenarios

Token Metrics Team
7 min read

Understanding Polkadot's 2027 Potential

The Layer 1 competitive landscape is consolidating as markets reward specialization over undifferentiated "Ethereum killers". Polkadot positions itself in a multi-chain world through shared security and parachain interoperability. Infrastructure maturity around custody and bridges makes alternate L1s more accessible into 2026.

The price prediction scenario projections below map different market share outcomes for DOT across varying total crypto market sizes. Base cases assume Polkadot maintains current ecosystem momentum, while moon scenarios factor in accelerated adoption, and bear cases reflect increased competitive pressure.


Disclosure
Educational purposes only, not financial advice. Crypto is volatile, do your own research and manage risk.

How to read our price prediction methodology:
Each band blends cycle analogues and market-cap share math with TA guardrails. Base assumes steady adoption and neutral or positive macro. Moon layers in a liquidity boom. Bear assumes muted flows and tighter liquidity.

Polkadot (DOT) Price Prediction: TM Agent Baseline

Token Metrics long term price prediction view for Polkadot, cashtag $DOT. Lead metric first, Token Metrics TM Grade is 71%, Buy, and the trading signal is bullish, which indicates above-average project quality, and positive short-term momentum. Market context, Bitcoin's trend and institutional flows into layer-1 ecosystems remain the dominant macro drivers, so $DOT's performance will track risk-on cycles and parachain adoption.

Concise 12-month price prediction numeric view: Token Metrics scenarios cluster roughly between $4.50 and $22, with a base case near $11, reflecting continued parachain activity, cross-chain integrations, and ecosystem growth. Implication, if the broader market enters a sustained bull phase and Polkadot adoption accelerates, $DOT could test the upper bound. In a prolonged risk-off environment or slower parachain uptake, it would likely drift toward the lower bound.

Polkadot Token Details 

Buy DOT on Gemini

Affiliate Disclosure: We may earn a commission from qualifying purchases made via this link, at no extra cost to you.

Key Takeaways

  • Scenario driven price predictions, outcomes hinge on total crypto market cap, higher liquidity and adoption lift the bands.
  • TM Agent gist: range $4.50 to $22 with a base near $11, upside requires adoption and liquidity, downside ties to risk-off.
  • Education only, not financial advice.

Polkadot Price Prediction: Scenario Analysis

Token Metrics price prediction scenarios span four market cap tiers, each representing different levels of crypto market maturity and liquidity:

  • 8T Price Prediction: At an eight trillion dollar total crypto market cap, DOT projects to $4.31 in bear conditions, $4.85 in the base case, and $5.39 in bullish scenarios.
  • 16T Price Prediction: Doubling the market to sixteen trillion expands the range to $6.82 (bear), $8.44 (base), and $10.07 (moon).
  • 23T Price Prediction: At twenty-three trillion, the scenarios show $9.33, $12.04, and $14.75 respectively.
  • 31T Price Prediction: In the maximum liquidity scenario of thirty-one trillion, DOT could reach $11.84 (bear), $15.63 (base), or $19.43 (moon).

Each tier assumes progressively stronger market conditions, with the base case reflecting steady growth and the moon case requiring sustained bull market dynamics.

Why Consider the Indices with Top-100 Exposure

Polkadot represents one opportunity among hundreds in crypto markets. Token Metrics Indices bundle DOT with top one hundred assets for systematic exposure to the strongest projects. Single tokens face idiosyncratic risks that diversified baskets mitigate.

Historical index performance demonstrates the value of systematic diversification versus concentrated positions. Join the early access list

Join the early access list

What Is Polkadot?

Polkadot is a network designed to connect specialized blockchains, called parachains, to a central Relay Chain for shared security and interoperability. Its architecture aims to enable cross-chain messaging and upgrades without hard forks.

DOT is the native token, used for staking to secure the network, on-chain governance, and bonding to add new parachains. Developers and users interact across parachains for use cases spanning DeFi, infrastructure, and cross-chain applications.

Token Metrics AI Analysis

Token Metrics AI provides comprehensive context on Polkadot's positioning and challenges.

Vision: Polkadot's vision is to create a decentralized web where independent blockchains can operate securely while communicating and sharing data across networks. It aims to enable a fully interoperable and scalable ecosystem that supports innovation in decentralized technologies.

Problem: The blockchain space faces fragmentation, with networks operating in isolation, limiting data and value transfer. This siloed structure hampers scalability, security, and user experience. Polkadot addresses the need for cross-chain communication and shared security, allowing blockchains to benefit from collective strength without sacrificing autonomy.

Solution: Polkadot uses a relay chain to coordinate a network of parachains, each with specialized functionality. It employs a nominated proof-of-stake (NPoS) consensus mechanism to secure the network and enable governance. Parachains lease slots via auctions, allowing projects to build custom blockchains with shared security and interoperability. The system supports cross-chain message passing, enabling data and asset transfers between different blockchains.

Market Analysis: Polkadot operates in the layer-0 and interoperability segment, competing with platforms like Cosmos and emerging multi-chain ecosystems. It differentiates itself through shared security, on-chain governance, and a robust parachain model. Adoption is driven by developer interest, parachain diversity, and integration with DeFi, NFTs, and enterprise solutions. Market conditions for Polkadot are influenced by broader crypto trends, regulatory developments, and execution of its technological roadmap. While it ranks among major smart contract platforms, it faces strong competition from Ethereum and high-throughput chains like Solana. Price and adoption depend on network usage, ecosystem growth, and macroeconomic factors in the crypto market.

Catalysts That Skew Bullish for DOT Price Predictions

  • Institutional and retail access expands with ETFs, listings, and integrations.
  • Macro tailwinds from lower real rates and improving liquidity.
  • Product or roadmap milestones such as upgrades, scaling, or partnerships.

Risks That Skew Bearish on DOT Price Predictions

  • Macro risk-off from tightening or liquidity shocks.
  • Regulatory actions or infrastructure outages.
  • Concentration or validator economics and competitive displacement.

FAQs About Polkadot Price Prediction

Will DOT hit $15 by 2027?

The 31T base case price prediction shows DOT at $15.63, which exceeds $15. The 23T moon case at $14.75 does not reach $15. Outcome depends on total crypto market cap growth and Polkadot maintaining market share. Not financial advice.

Can DOT 10x from current levels?

At current price of $3.10, a 10x would reach $31.0. None of the price prediction scenarios, with a high of $19.43 in the 31T moon case, reaches that level by 2027. 10x returns would require substantially greater market cap expansion. Not financial advice.

What price could DOT reach in the moon case?

Moon case price predictions range from $5.39 at 8T to $19.43 at 31T. These scenarios assume maximum liquidity expansion and strong Polkadot adoption. Not financial advice.

Next Steps

Disclosure

Educational purposes only, not financial advice. Crypto is volatile, do your own research and manage risk.

Why Use Token Metrics for Polkadot Price Prediction Investing?

Actionable AI-driven Ratings: Access live Token Metrics grades and signals for Polkadot and hundreds of crypto assets.

Scenario Forecasting: Visualize DOT upside and downside with rigorous price prediction scenario math, not unsubstantiated hype.

Portfolio Diversification: Token Metrics Indices let you systematically diversify among top projects, mitigating single-token risk.

Start your Polkadot price prediction research with institutional-grade tools from Token Metrics.

Choose from Platinum, Gold, and Silver packages
Reach with 25–30% open rates and 0.5–1% CTR
Craft your own custom ad—from banners to tailored copy
Perfect for Crypto Exchanges, SaaS Tools, DeFi, and AI Products