Back to blog
Research

Mastering Crypto APIs for Automated Trading Strategies

Explore how to use crypto APIs to automate trading strategies, from setup and security to leveraging AI-driven insights. Learn integration steps, risks, and best practices for building robust crypto trading bots.
Token Metrics Team
6
Want Smarter Crypto Picks—Free?
See unbiased Token Metrics Ratings for BTC, ETH, and top alts.
Thank you! Your submission has been received!
Oops! Something went wrong while submitting the form.
 No credit card | 1-click unsubscribe

As the world of cryptocurrency matures, traders, developers, and analysts are embracing automation to streamline their strategies. Central to this movement is the crypto API—a versatile, programmable gateway that unlocks automated trading, real-time data analysis, and AI-driven decision support. But how exactly do you use a crypto API to create, deploy, and optimize automated trading strategies?

What Is a Crypto API and Why Does It Matter?

A crypto API (Application Programming Interface) is a set of protocols and tools that enables applications to interact directly with cryptocurrency platforms or data providers. These APIs offer real-time access to market data, trading execution, portfolio balances, and analytics. By integrating APIs, developers and traders can:

  • Automate repetitive trading tasks
  • Aggregate live data for advanced analytics
  • Implement algorithmic or rules-based trading systems
  • Test strategies using historical market feeds
  • Harness AI for signal generation and risk management

This programmability reduces human error, accelerates reaction times, and enables the development of custom trading frameworks tailored to specific risk profiles or market outlooks.

Types of Crypto APIs and Their Key Functions

To choose or use a crypto API effectively, it’s important to understand the principal types available:

  • Exchange APIs: Provided by leading exchanges, these enable order management (buying/selling), balance queries, and retrieval of historical or live price data. Examples include Binance API, Coinbase Pro API, and Kraken API.
  • Data Aggregator APIs: These consolidate market data from multiple sources, often providing enhanced analytics, institutional-grade pricing, and on-chain statistics. Popular options are CoinGecko API and CoinMarketCap API.
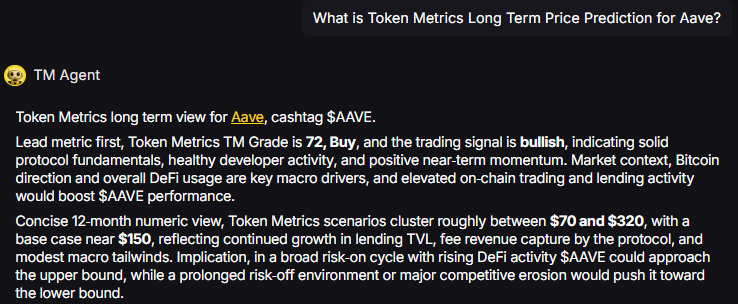
  • AI & Signal APIs: Advanced platforms offer APIs for trading signals, sentiment analysis, and predictive modeling, often using AI or machine learning. Token Metrics is one such service that delivers actionable analytics through its API.
  • Wallet & Portfolio APIs: These help with portfolio tracking, asset management, and automating reporting functions.

Selecting the right API or combination depends on your trading objectives, technical skills, and the depth of data or execution automation you require.

Step-by-Step: How to Use a Crypto API for Automated Trading

Building an automated trading strategy with a crypto API generally involves the following core steps:

  1. Define Your Trading Strategy
    • Outline clear rules for entry, exit, risk management, and asset selection.
    • Consider classical strategies (momentum, arbitrage, mean reversion) or machine-learning-driven models.
  2. Get an API Key
    • Register with your chosen exchange or data provider. Most require identity verification and IP whitelisting for security.
    • Never expose or share your API credentials. Store them securely and use environment variables when coding.
  3. Connect via Your Preferred Programming Language
    • Most crypto APIs offer RESTful or WebSocket endpoints, accessible from Python, JavaScript, or other modern languages.
    • Use libraries like ccxt (multi-exchange trading), web3.py (blockchain data), or vendor-specific SDKs for easier integration.
  4. Fetch and Process Data
    • Request market prices, order book snapshots, or on-chain analytics as needed. Parse the JSON responses and structure your strategy logic accordingly.
    • Consider rate limits—most APIs restrict the frequency of requests to prevent abuse.
  5. Backtest Your Strategy
    • Simulate trades using historical data delivered via the API. Evaluate performance using industry-accepted metrics (e.g., Sharpe Ratio, Maximum Drawdown).
    • Check for scenarios where the strategy underperforms or exposes you to excess risk.
  6. Deploy and Monitor
    • Transition to live trading by switching endpoints or credentials. Use webhooks, notification APIs, or dashboards for real-time monitoring and fail-safes.
    • Continuously audit results, as market conditions and API terms can change.

By following these steps, you build a feedback loop that can transform manual trade setups into resilient, scalable, and data-driven trading systems.

Safeguards and Considerations When Using Crypto APIs

Utilizing crypto APIs and automated strategies poses unique challenges that require careful planning:

  • API Rate Limits & Downtimes: Timeouts or outages can disrupt your strategy. Build in retries and health-check mechanisms to minimize disruptions.
  • Security Best Practices: Store API keys securely (consider encrypted vaults or secure secrets management). Use permission controls (read-only, withdrawal, trading) to limit risk if keys are compromised.
  • Slippage & Liquidity: Rapidly changing order books and volatile markets can result in orders executing at unexpected prices. Test across different market conditions to estimate real-world impacts.
  • Regulatory Compliance: Automated strategies and APIs are subject to varying jurisdictional regulations. Familiarize yourself with relevant requirements (such as user verification, reporting, and rate limits).
  • Continuous Optimization: Markets evolve—and so should your trading logic. Regularly backtest and update strategies to align with emerging trends, new assets, or technology upgrades from API providers.

Successful automation relies not only on technical prowess, but also on robust operational safeguards to support consistent performance over time.

Leveraging AI in Crypto API-Powered Strategies

Recent advances in AI and machine learning are enhancing the potential of crypto APIs. Here’s how AI is increasingly being woven into automated trading workflows:

  • Predictive Analytics: AI models can detect price anomalies, predict trends, and identify hidden correlations. When paired with real-time API data, these insights can trigger algorithmic trades with updated logic.
  • Sentiment Analysis: APIs delivering natural language data (news, social posts) can be ingested and analyzed by AI for early trend detection or risk monitoring.
  • Automated Signal Processing: AI-driven APIs can generate actionable buy/sell signals or portfolio rebalancing triggers, reducing human subjectivity.

Platforms like Token Metrics merge crypto APIs and AI, making it easier for both coders and non-coders to leverage this advanced analytical edge within automated strategies.

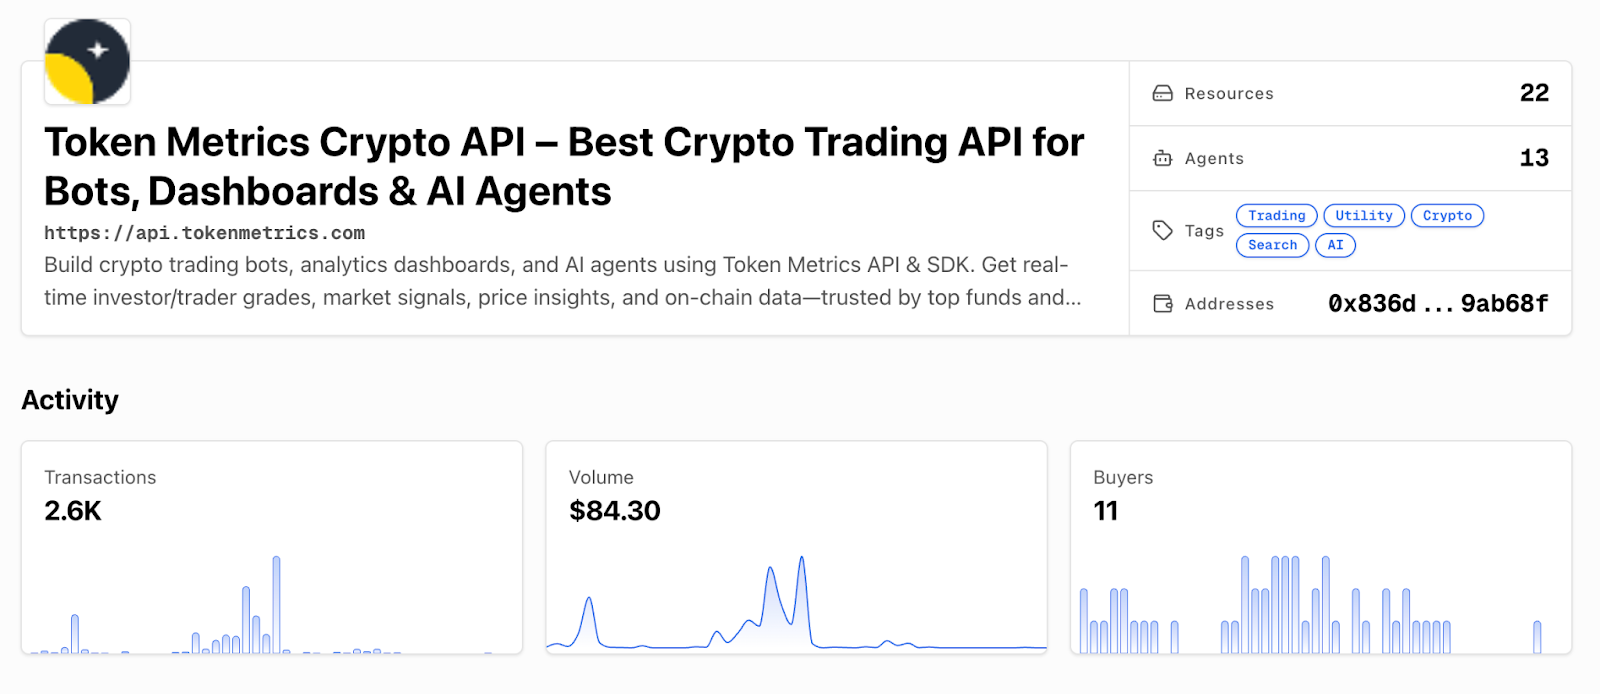
Build Smarter Crypto Apps & AI Agents with Token Metrics

Token Metrics provides real-time prices, trading signals, and on-chain insights all from one powerful API. Grab a Free API Key

Frequently Asked Questions

What programming languages are supported for crypto API integration?

Popular crypto APIs provide RESTful or WebSocket endpoints, making them accessible from Python, JavaScript, Java, and other modern languages. Official SDKs or community-developed libraries often exist for faster setup.

Is backtesting necessary before deploying a trading bot?

Yes, backtesting with historical API data allows you to simulate strategy performance, spot weaknesses, and estimate metrics like volatility or drawdown before risking capital in live markets.

How do I secure my crypto API keys?

Store keys in encrypted environments or secure vaults, use read-only permissions when possible, and rotate credentials regularly. Avoid hard-coding credentials directly into scripts or repositories.

Can AI really improve automated trading strategies?

AI, when combined with reliable API-driven data, can surface new signals, manage risk more dynamically, and adapt strategies as market conditions change. It does not guarantee profitability, but it can enhance analysis and responsiveness.

What are common mistakes when using crypto APIs for trading?

Common mistakes include exceeding API rate limits, insufficient error handling, hardcoding sensitive credentials, underestimating slippage, and failing to monitor or update strategies as conditions evolve.

Disclaimer

This article is for educational purposes only and does not constitute investment, financial, or trading advice. Crypto assets and algorithmic trading involve significant risks. Perform your own research and consult a qualified professional before using any trading tools or APIs.

Build Smarter Crypto Apps &
AI Agents in Minutes, Not Months
Real-time prices, trading signals, and on-chain insights all from one powerful API.
Grab a Free API Key
About Token Metrics
Token Metrics: AI-powered crypto research and ratings platform. We help investors make smarter decisions with unbiased Token Metrics Ratings, on-chain analytics, and editor-curated “Top 10” guides. Our platform distills thousands of data points into clear scores, trends, and alerts you can act on.
30 Employees
analysts, data scientists, and crypto engineers
Daily Briefings
concise market insights and “Top Picks”
Transparent & Compliant
Sponsored ≠ Ratings; research remains independent
Want Smarter Crypto Picks—Free?
See unbiased Token Metrics Ratings for BTC, ETH, and top alts.
Thank you! Your submission has been received!
Oops! Something went wrong while submitting the form.
 No credit card | 1-click unsubscribe
Token Metrics Team
Token Metrics Team

Recent Posts

Research

AAVE Price Prediction 2027: $70-$2,175 Forecast Analysis

Token Metrics Team
9 min read

AAVE Price Prediction 2027: Market Analysis and Scenario-Based Forecasts

Market Context for Aave Price Prediction: The Case for 2027

DeFi protocols are maturing beyond early ponzi dynamics toward sustainable revenue models. Aave operates in this evolving landscape where real yield and proven product-market fit increasingly drive valuations rather than speculation alone. Growing regulatory pressure on centralized platforms creates tailwinds for decentralized alternatives—factors that inform our comprehensive AAVE price prediction framework.

The scenario bands below reflect how AAVE price predictions might perform across different total crypto market cap environments. Each tier represents a distinct liquidity regime, from bear conditions with muted DeFi activity to moon scenarios where decentralized infrastructure captures significant value from traditional finance.


Disclosure

Educational purposes only, not financial advice. Crypto is volatile, do your own research and manage risk.

How to Read This AAVE Price Prediction

Each band blends cycle analogues and market-cap share math with TA guardrails. Base assumes steady adoption and neutral or positive macro. Moon layers in a liquidity boom. Bear assumes muted flows and tighter liquidity.

TM Agent baseline: Token Metrics TM Grade is 72, Buy, and the trading signal is bullish, indicating solid protocol fundamentals, healthy developer activity, and positive near-term momentum. Concise twelve-month numeric view, Token Metrics price prediction scenarios cluster roughly between $70 and $320, with a base case near $150, reflecting continued growth in lending TVL, fee revenue capture by the protocol, and modest macro tailwinds.

Live details: Aave Token Details

Affiliate Disclosure: We may earn a commission from qualifying purchases made via this link, at no extra cost to you.

Key Takeaways

  • Scenario driven, outcomes hinge on total crypto market cap, higher liquidity and adoption lift the bands.
  • Fundamentals: Fundamental Grade 75.51% (Community 77%, Tokenomics 100%, Exchange 100%, VC 49%, DeFi Scanner 70%).
  • Technology: Technology Grade 83.17% (Activity 75%, Repository 68%, Collaboration 92%, Security 78%, DeFi Scanner 70%).
  • TM Agent gist: scenarios cluster between $70 and $320 with base near $150, assuming steady lending TVL growth and neutral macro conditions.
  • Education only, not financial advice.

AAVE Price Prediction Scenario Analysis

Our Token Metrics price prediction framework spans four market cap tiers, each representing different levels of crypto market maturity and liquidity:

8T Market Cap - AAVE Price Prediction:

At an 8 trillion dollar total crypto market cap, AAVE projects to $293.45 in bear conditions, $396.69 in the base case, and $499.94 in bullish scenarios.

16T Market Cap - AAVE Price Prediction:

Doubling the market to 16 trillion expands the price prediction range to $427.46 (bear), $732.18 (base), and $1,041.91 (moon).

23T Market Cap - AAVE Price Prediction:

At 23 trillion, the price prediction scenarios show $551.46, $1,007.67, and $1,583.86 respectively.

31T Market Cap - AAVE Price Prediction:

In the maximum liquidity scenario of 31 trillion, AAVE price predictions could reach $680.47 (bear), $1,403.16 (base), or $2,175.85 (moon).

Each tier assumes progressively stronger market conditions, with the base case price prediction reflecting steady growth and the moon case requiring sustained bull market dynamics.

Why Consider the Indices with Top-100 Exposure

Aave represents one opportunity among hundreds in crypto markets. Token Metrics Indices bundle AAVE with top one hundred assets for systematic exposure to the strongest projects. Single tokens face idiosyncratic risks that diversified baskets mitigate.

Historical index performance demonstrates the value of systematic diversification versus concentrated positions.

Join the early access list

What Is Aave?

Aave is a decentralized lending protocol that operates across multiple EVM-compatible chains including Ethereum, Polygon, Arbitrum, and Optimism. The network enables users to supply crypto assets as collateral and borrow against them in an over-collateralized manner, with interest rates dynamically adjusted based on utilization.

The AAVE token serves as both a governance asset and a backstop for the protocol through the Safety Module, where stakers earn rewards in exchange for assuming shortfall risk. Primary utilities include voting on protocol upgrades, fee switches, collateral parameters, and new market deployments.

Token Metrics AI Analysis

Token Metrics AI provides comprehensive context on Aave's positioning and challenges.

Vision: Aave aims to create an open, accessible, and non-custodial financial system where users have full control over their assets. Its vision centers on decentralizing credit markets and enabling seamless, trustless lending and borrowing across blockchain networks.

Problem: Traditional financial systems often exclude users due to geographic, economic, or institutional barriers. Even in crypto, accessing credit or earning yield on idle assets can be complex, slow, or require centralized intermediaries. Aave addresses the need for transparent, permissionless, and efficient lending and borrowing markets in the digital asset space.

Solution: Aave uses a decentralized protocol where users supply assets to liquidity pools and earn interest, while borrowers can draw from these pools by posting collateral. It supports features like variable and stable interest rates, flash loans, and cross-chain functionality through its Layer 2 and multi-chain deployments. The AAVE token is used for governance and as a safety mechanism via its staking program (Safety Module).

Market Analysis: Aave is a leading player in the DeFi lending sector, often compared with protocols like Compound and Maker. It benefits from strong brand recognition, a mature codebase, and ongoing innovation such as Aave Arc for institutional pools and cross-chain expansion. Adoption is driven by liquidity, developer activity, and integration with other DeFi platforms. Key risks include competition from newer lending protocols, regulatory scrutiny on DeFi, and smart contract risks. As a top DeFi project, Aave's performance reflects broader trends in decentralized finance, including yield demand, network security, and user trust. Its multi-chain strategy helps maintain relevance amid shifting ecosystem dynamics.

Fundamental and Technology Snapshot from Token Metrics

Fundamental Grade: 75.51% (Community 77%, Tokenomics 100%, Exchange 100%, VC 49%, DeFi Scanner 70%).


Technology Grade: 83.17% (Activity 75%, Repository 68%, Collaboration 92%, Security 78%, DeFi Scanner 70%).

Catalysts That Skew AAVE Price Predictions Bullish

  • Institutional and retail access expands with ETFs, listings, and integrations
  • Macro tailwinds from lower real rates and improving liquidity
  • Product or roadmap milestones such as upgrades, scaling, or partnerships

Risks That Skew AAVE Price Predictions Bearish

  • Macro risk-off from tightening or liquidity shocks
  • Regulatory actions or infrastructure outages
  • Concentration or competitive displacement in lending

AAVE Price Prediction FAQs

Can AAVE reach $1,000?

Yes. Based on our price prediction scenarios, AAVE could reach $1,007.67 in the 23T base case and $1,041.91 in the 16T moon case. Not financial advice.

Can AAVE 10x from current levels?

At current price of $228.16, a 10x would reach $2,281.60. This falls within the 31T moon case price prediction at $2,175.85 (only slightly below), and would require extreme liquidity expansion. Not financial advice.

What price could AAVE reach in the moon case?

Our moon case price predictions range from $499.94 at 8T to $2,175.85 at 31T. These scenarios assume maximum liquidity expansion and strong Aave adoption. Not financial advice.

What is the AAVE price prediction for 2027?

Our comprehensive 2027 price prediction framework suggests AAVE could trade between $293.45 and $2,175.85, depending on market conditions and total crypto market capitalization. The base case scenario clusters around $396.69 to $1,403.16 across different market cap environments. Not financial advice.

Is AAVE a good investment based on price predictions?

AAVE shows strong fundamentals (75.51% grade) and technology scores (83.17% grade), with bullish trading signals. However, all price predictions involve uncertainty and risk. Always conduct your own research and consult financial advisors before investing. Not financial advice.


Next Steps

Track live grades and signals: Token Details 

Join Indices Early Access

Want exposure? Buy AAVE on MEXC 

Disclosure

Educational purposes only, not financial advice. Crypto is volatile, do your own research and manage risk.

Why Use Token Metrics?

  • AI-driven crypto and DeFi grades for risk management and alpha discovery.
  • Quantitative, on-chain signals and robust scenario modeling for tokens like AAVE.
  • Access in-depth research reports, analyst perspectives, auto-grades, and portfolio tools from Token Metrics.
Research

x402 & HTTP 402 Explained: Why Wallet-Paid API Calls Are Winning (and Where Token Metrics Fits)

Token Metrics Team
10 min read

What Is x402?

x402 is an open-source, HTTP-native payment protocol developed by Coinbase that enables pay-per-call API access using crypto wallets. It leverages the HTTP 402 Payment Required status code to create seamless, keyless API payments.

It eliminates traditional API keys and subscriptions, allowing agents and applications to pay for exactly what they use in real time. It works across Base and Solana with USDC and selected native tokens such as TMAI.

Start using Token Metrics X402 integration here. https://www.x402scan.com/server/244415a1-d172-4867-ac30-6af563fd4d25 

TLDR — The x402 Value Proposition

x402 transforms API access by making payments native to HTTP requests.

Feature

Traditional APIs

x402 APIs

Authentication

API keys, tokens

Wallet signature

Payment Model

Subscription, prepaid

Pay-per-call

Onboarding

Sign up, KYC, billing

Connect wallet

Rate Limits

Fixed tiers

Economic (pay more = more access)

Commitment

Monthly/annual

Zero, per-call only

How to use it: Add x-coinbase-402: true header to any supported endpoint. Sign payment with your wallet. The API responds immediately after confirming micro-payment.

Token Metrics integration: All public endpoints available via x402 with per-call pricing from $0.017 to $0.068 USDC (10% discount with TMAI token).

Explore live agents: https://www.x402scan.com/composer.

How HTTP 402 Payment Required Works — Technical Deep Dive

The Protocol Flow

The HTTP 402 status code was reserved in HTTP/1.1 in 1997 for future digital payment use cases and was never standardized for any specific payment scheme. x402 activates this path by using 402 responses to coordinate crypto payments during API requests.

  1. Step by step: Client makes an API request with the header x-coinbase-402: true.
  2. The server can return 402 with payment details such as amount, recipient, and chain.
  3. The client wallet signs and submits the payment transaction.
  4. The server verifies the payment on-chain, then processes the original request and returns 200 with data.

Why this matters: It eliminates intermediary payment processors, enables true machine-to-machine commerce, and reduces friction for AI agents.

Ecosystem Proof: x402 Is Winning — Three Validation Points

CoinGecko Recognition

CoinGecko launched a dedicated x402 Ecosystem category in October 2025, tracking 700+ projects with over $1 billion market cap and approximately $213 million in daily trading volume. Top performers include PING and Alnalyst, along with established projects like EigenCloud.


Base Network Adoption

Base has emerged as the primary chain for x402 adoption, with 450,000+ weekly transactions by late October 2025, up from near-zero in May. This growth demonstrates real agent and developer usage.

x402scan Composer — Where Agents Pay in Real Time

Composer is x402scan's sandbox for discovering and using AI agents that pay per tool call. Users can open any agent, chat with it, and watch tool calls and payments stream in real time.

Top agents include AInalyst, Canza, SOSA, and NewEra. The Composer feed shows live activity across all agents.


Explore Composer: https://x402scan.com/composer 

Token Metrics x402 Integration — Concrete Implementation

What We Ship

Token Metrics offers all public API endpoints via x402 with no API key required. Pay per call with USDC or TMAI for a 10 percent discount. Access includes trading signals, price predictions, fundamental grades, technology scores, indices data, and the AI chatbot.

Check out Token Metrics Integration on X402. https://www.x402scan.com/server/244415a1-d172-4867-ac30-6af563fd4d25 


Data as of October, 2025.

Pricing Tiers


Important note: TMAI Spend Limit: TMAI has 18 decimals. Set max payment to avoid overspending. Example: 200 TMAI = 200 * (10 ** 18) in base units.

Full integration guide: https://api.tokenmetrics.com 

Why x402 Changes Everything for AI Agents

  • Eliminates onboarding friction. Agents can discover and use new APIs instantly without human intervention for API key management or billing setup.
  • Enables true agentic commerce. Agents pay for exactly what they use, which makes micro-transactions economically viable. This unlocks composition of multiple specialized services.
  • Aligns incentives. API providers get paid per call, users only pay for value received, and agents can optimize costs by choosing best-fit providers. Network effects accelerate as more endpoints adopt x402.

Use Cases Already Working

  • Crypto analytics agents: Pull Token Metrics data on demand to answer market questions, generate trade signals, or build custom dashboards.
  • Research automation: Chain together x402 endpoints like Twitter search, Tavily extract, Firecrawl, and Token Metrics to gather and structure data.
  • Portfolio management: Agents monitor positions, fetch real-time prices, calculate risk metrics, and execute rebalancing decisions using paid data sources.
  • Trading strategy backtests: Access historical OHLCV, grades, and signals data via x402 without committing to monthly subscriptions.
  • Multi-chain intelligence: Combine Base and Solana x402 services for cross-chain analysis and arbitrage discovery.

Ecosystem Participants and Tools

Active x402 Endpoints

Key endpoints beyond Token Metrics include Heurist Mesh for crypto intelligence, Tavily extract for structured web content, Firecrawl search for SERP and scraping, Twitter or X search for social discovery, and various DeFi and market data providers.

Infrastructure and Tools

  • x402scan: Explorer and analytics platform tracking all x402 activity across chains.
  • Composer: Hosted sandbox for discovering and using x402-enabled agents.
  • x402-axios and x402-httpx: Client libraries for Node.js and Python.
  • Coinbase Agent Kit: SDK integration for building x402-native agents.
  • LangChain connectors: Framework integration for agent workflows.

Common Questions About x402

How is x402 different from traditional API keys?

x402 uses wallet signatures instead of API keys. Payment happens per call rather than via subscription. No sign-up, no monthly billing, no rate limit tiers. You pay for exactly what you use.

Which chains support x402?

Currently Base and Solana. Most activity is on Base with USDC as the primary payment token. Some endpoints accept native tokens like TMAI for discounts.

Do I need to trust the API provider with my funds?

No. Payments are on-chain and verifiable. You approve each transaction amount. No escrow or prepayment is required.

What happens if a payment fails?

The API returns 402 Payment Required again with updated payment details. Your client retries automatically. You do not receive data until payment confirms.

Can I use x402 with existing API clients?

Yes, with x402 client libraries such as x402-axios for Node and x402-httpx for Python. These wrap standard HTTP clients and handle the payment flow automatically.

Getting Started Checklist

  1. Set up a wallet: Create a Base wallet with USDC or TMAI balance.
  2. Install x402 client: npm install x402-axios or pip install x402-httpx.
  3. Choose an endpoint: Browse x402scan or Composer for available APIs.
  4. Write minimal code: Add x-coinbase-402: true header to requests.
  5. Watch payments flow: Monitor transactions in your wallet and on x402scan feed.
  6. Optimize costs: Compare endpoint pricing, use TMAI for 10% discount, cache results when appropriate.

Token Metrics x402 Resources

What's Next for x402

Ecosystem expansion. More API providers adopting x402, additional chains beyond Base and Solana, standardization of payment headers and response formats.

Agent sophistication. As x402 matures, expect agents that automatically discover and compose multiple paid endpoints, optimize costs across providers, and negotiate better rates for bulk usage.

Disclosure

Educational content only, not financial advice. API usage and crypto payments carry risks. Verify all transactions before signing. Do your own research.

Frequently Asked Questions

Research

Top 10 Pump.fun Livestream Tokens by Fees Earned

Token Metrics Team
7 min read


Opening Hook

Fees Earned is a clean way to see which livestream tokens convert attention into on-chain activity. This leaderboard ranks the top 10 Pump.fun livestream tokens by Fees Earned using the screenshot you provided.

Selection rule is simple, top 10 by Fees Earned from the screenshot, numbers appear exactly as shown. If a field is not in the image, it is recorded as —.

Entity coverage: project names and tickers are taken as listed on Pump.fun, chain is Solana, sector is livestream meme tokens and creator tokens.

Featured: Token Metrics Live (TMLIVE) — Why We Built on Pump.fun

Token Metrics Live (TMLIVE) brings real time, data driven crypto market analysis to Pump.fun. The team has produced live crypto content for 7 years with a 500K plus audience and a platform of more than 100,000 users. Our public track record includes early coverage of winners like MATIC and Helium in 2018.

TMLIVE Quick Stats, as captured

  • ATH market cap: $291.7K
  • 24 hour volume on day one: $1.7M
  • Holders at capture: ~876
  • Current market cap at capture: $36.1K, displayed price: $0.043, visible chart timestamp: 22:33:49 UTC
  • Ticker: TMLIVE, Chain: Solana, Contract: 8Dxpc8Q8jg7TK8TT1pVntcqunHGofqpetCaP5fEhpump
  • Use these as captured numbers when referencing day one results. If you update screenshots later, swap in the new captures.

TLDR: Fees Earned Leaders at a Glance

  • Fees Earned: StrSzn ranks first with strong peak and average viewership for its size.
  • Fees Earned: Bagwork and POLYFACTS are close behind, both with large holder bases and double digit KOL counts.
  • Fees Earned: KIND shows the biggest KOL presence in the top 10, aligned with solid viewer averages.
  • Fees Earned: Newer names like Fapcoin appear despite modest viewer counts, proof that recency and focused pushes can drive fees.
  • Fees Earned: Live status correlates with short bursts for BUN COIN and FTP, while sustained averages matter over time.

Pump.fun Fees Earned Leaderboard (Top 10)


Short distribution note: the top three sit within a narrow band of each other, while mid-table tokens show a mix of older communities and recent streams. Several names with modest average viewers still appear due to concentrated activity during peaks.

Project Snapshots: What Each Token Does

StrSzn

Positioning: Active community meme with consistent viewer base.

Research Blurb: Project details unclear at time of writing. Fees and viewership suggest consistent stream engagement over the last month.

Quick Facts: Chain = Solana, Status = —, Peak Viewers = 1,951, Avg Viewers = 548.


https://pump.fun/coin/986j8mhmidrcbx3wf1XJxsQFvWBMXg7gnDi3mejsr8H8

Bagwork

Positioning: Large holder base with sustained attention.

Research Blurb: Project details unclear at time of writing. Strong holders and KOL presence supported steady audience numbers.

Quick Facts: Chain = Solana, Status = 1mo ago, Holders = 9,192, KOLs = 19.


https://pump.fun/coin/7Pnqg1S6MYrL6AP1ZXcToTHfdBbTB77ze6Y33qBBpump

POLYFACTS

Positioning: Higher market cap with light average viewership.

Research Blurb: Project details unclear at time of writing. High market cap with comparatively low average viewers implies fees concentrated in shorter windows.

Quick Facts: Chain = Solana, Status = 1mo ago, MC = 3.15M, Avg Viewers = 13.


https://pump.fun/coin/FfixAeHevSKBZWoXPTbLk4U4X9piqvzGKvQaFo3cpump

STREAMER

Positioning: Community focused around streaming identity.

Research Blurb: Project details unclear at time of writing. Solid holders and moderate KOL count, steady averages over time.

Quick Facts: Chain = Solana, Status = 1mo ago, Holders = 8,008, KOLs = 14.


https://pump.fun/coin/3arUrpH3nzaRJbbpVgY42dcqSq9A5BFgUxKozZ4npump

KIND

Positioning: Heaviest KOL footprint in the top 10.

Research Blurb: Project details unclear at time of writing. The largest KOL count here aligns with above average view metrics and meaningful fees.

Quick Facts: Chain = Solana, Status = 29d ago, KOLs = 23, Avg Viewers = 57.


https://pump.fun/coin/V5cCiSixPLAiEDX2zZquT5VuLm4prr5t35PWmjNpump

ELIZABETH

Positioning: Mid-cap meme with consistent streams.

Research Blurb: Project details unclear at time of writing. Viewer averages and recency indicate steady presence rather than single spike behavior.

Quick Facts: Chain = Solana, Status = 1mo ago, Avg Viewers = 47, Peak Viewers = 113.


https://pump.fun/coin/DiiTPZdpd9t3XorHiuZUu4E1FoSaQ7uGN4q9YkQupump

Cope

Positioning: Older token with a legacy community.

Research Blurb: Project details unclear at time of writing. Despite low recent averages, it holds a sizable base and meaningful fees.

Quick Facts: Chain = Solana, Status = —, Age = 1y ago, Avg Viewers = 9.


https://pump.fun/coin/DMwbVy48dWVKGe9z1pcVnwF3HLMLrqWdDLfbvx8RchhK

BUN COIN

Positioning: Currently live, strong peaks relative to size.

Research Blurb: Project details unclear at time of writing. Live streaming status often coincides with bursts of activity that lift fees quickly.

Quick Facts: Chain = Solana, Status = Live, Peak Viewers = 897, Avg Viewers = 71.


https://pump.fun/coin/HQDTzNa4nQVetoG6aCbSLX9kcH7tSv2j2sTV67Etpump

Fapcoin

Positioning: Newer token with targeted pushes.

Research Blurb: Project details unclear at time of writing. Recent age and meaningful KOL support suggest orchestrated activations that can move fees.

Quick Facts: Chain = Solana, Status = 13d ago, Age = 18d ago, KOLs = 22.


https://pump.fun/coin/8vGr1eX9vfpootWiUPYa5kYoGx9bTuRy2Xc4dNMrpump

FTP

Positioning: Live status with solid mid-table view metrics.

Research Blurb: Project details unclear at time of writing. Peaks and consistent averages suggest an active audience during live windows.

Quick Facts: Chain = Solana, Status = Live, Peak Viewers = 496, Avg Viewers = 35.


https://pump.fun/coin/J2eaKn35rp82T6RFEsNK9CLRHEKV9BLXjedFM3q6pump

Signals From Fees Earned: Patterns to Watch

Fees Earned often rise with peak and average viewers, but timing matters. Several tokens here show concentrated peaks with modest averages, which implies that well timed announcements or coordinated segments can still produce high fees.

Age is not a blocker for this board. Newer tokens like Fapcoin appear due to focused activity, while older names such as Cope persist by mobilizing established holders. KOL count appears additive rather than decisive, with KIND standing out as the KOL leader.

Why Fees Earned Matters for Creators and Traders

For creators, Fees Earned reflects whether livestream moments translate into on-chain action. Design streams around clear calls to action, align announcements with segments that drive peaks, then sustain momentum with repeatable formats that stabilize averages.

For traders, Fees Earned complements market cap, viewers, and age. Look for projects that combine rising averages with consistent peaks, because those patterns suggest repeatable engagement rather than single event spikes.

Watch Real-Time Coverage on TV Live

TV Live is a fast way to follow real-time crypto market news, creator launches, and token breakdowns as they happen. You get context on stream dynamics, audience behavior, and on-chain activity while the story evolves.

CTA: Watch TV Live for real-time crypto market news →TV Live Link

CTA: Follow and enable alerts → TV Live

Why Crypto Investors Trust Token Metrics

Token Metrics is trusted for transparent data, crypto analytics, on-chain ratings, and investor education. Our platform offers cutting-edge signals and market research to empower your crypto investing decisions.

FAQs: Pump.fun Livestream and Fees Earned

What is the best way to track Pump.fun livestream leaders?

Tracking Pump.fun livestream leaders starts with the scanner views that show Fees Earned, viewers, and KOLs side by side, paired with live coverage so you see data and narrative shifts together.

Do higher fees predict higher market cap or sustained viewership?

Higher Fees Earned does not guarantee higher market cap or sustained viewership, it indicates conversion in specific windows, while longer term outcomes still depend on execution and community engagement.

How often do these rankings change?

Rankings can change quickly during active cycles, the entries shown here reflect the exact time of the screenshot.

Next Steps

  • Subscribe to TV Live updates → [NEWSLETTER_OR_ALERTS_LINK]
  • Read the next leaderboard post in this series.
  • Join the community stream on Pump.fun when a link is available.

Disclosure

This article is educational content. Cryptocurrency involves risk. Always do your own research.

Choose from Platinum, Gold, and Silver packages
Reach with 25–30% open rates and 0.5–1% CTR
Craft your own custom ad—from banners to tailored copy
Perfect for Crypto Exchanges, SaaS Tools, DeFi, and AI Products