Research

Moonshot Tokens in 2025: High-Risk, High-Reward Plays in the Crypto Market

Discover how to identify and trade moonshot tokens in 2025. Learn what makes these high-risk, high-reward crypto plays attractive and how to manage their volatility.
Token Metrics Team
6 min
MIN

Introduction

The crypto market has always been fertile ground for high-risk, high-reward opportunities. While blue-chip assets like Bitcoin and Ethereum dominate headlines, the real thrill — and sometimes the highest returns — often comes from what the industry calls moonshots.”

These are small-cap tokens, often under $50 million in market cap, with explosive potential and equally high volatility. In 2025, moonshots remain a core part of speculative trading strategies. But what exactly are they? How do you find them? And most importantly, how can you manage the outsized risks they carry?

Let’s dive into the world of moonshots, drawing insights from recent market trends and real-world data.

What Are Moonshot Tokens?

Moonshot tokens are early-stage, low-cap cryptocurrencies that carry massive upside potential. They often represent experimental ideas or emerging narratives — think AI integration, meme culture, or social tokens — that haven’t yet been fully recognized by the broader market.

Because they trade at relatively low valuations, even small inflows of capital can cause outsized price swings. It’s not uncommon for a moonshot to deliver 10x or even 50x gains within a short time. But the flip side is brutal: these same tokens can plummet to zero just as quickly.

Key characteristics of moonshots:

  • Market cap: Typically under $50 million.
  • Narrative-driven: Often tied to strong trends like AI, gaming, or DeFi experiments.
  • Volatility: Sharp, frequent price swings.
  • Liquidity: Thin order books, making large trades difficult without impacting price.

Why Are Moonshots Gaining Traction in 2025?

The current market environment — with crypto market capitalization hovering around $4 trillion — has created room for risk-taking. Investors who missed early gains on Bitcoin or Ethereum are now searching for the next big thing, leading to renewed interest in small-cap tokens.

Emerging narratives also fuel the fire:

  • AI-Crypto Fusion: Projects like Sahara AI and Mobi AI are proving that the AI narrative isn’t slowing down.
  • Social Tokens & Web3 Platforms: Zora’s creator-focused token model demonstrates how social media and crypto can intersect.
  • Community-First DeFi: Protocols like Blackhole DEX show the power of grassroots tokenomics.

These narratives often spill over into the moonshot arena, as smaller projects attempt to replicate the success of these headline-grabbing platforms.

How to Identify Promising Moonshots

Identifying moonshots is part research, part intuition, and part risk tolerance. Here’s what to look for:

1. Strong Narrative Alignment

The most successful moonshots ride on current narratives. In this cycle, AI agents, decentralized social platforms, and community-owned DeFi projects are leading themes. Projects in these categories often experience rapid hype-driven adoption.

2. On-Chain Data

Tools like Dune Analytics and on-chain scanners can reveal whale accumulation, new liquidity pools, or spikes in active addresses — all early indicators of growing interest.

3. Tokenomics

Evaluate supply schedules:

  • How many tokens are in circulation?
  • Are there large unlocks coming soon?
  • Does the project have mechanisms like buybacks or burns to support price stability?

4. Developer & Investor Backing

While many moonshots are grassroots projects, strong teams or backing from reputable funds (e.g., Polychain, Binance Labs) can boost credibility.

Case Studies: Recent Moonshots to Watch

1. Vine (Meme Token):
A meme coin leveraging the Vine brand, this token has gained traction despite limited documentation. Its appeal lies largely in nostalgia and speculative hype.

2. Moby AI: What started as an AI-driven whale-tracking agent has evolved into Mobi Screener, a Dexscreener competitor with integrated social features. The token model ties platform usage to token value — a promising experiment in utility-driven moonshots.

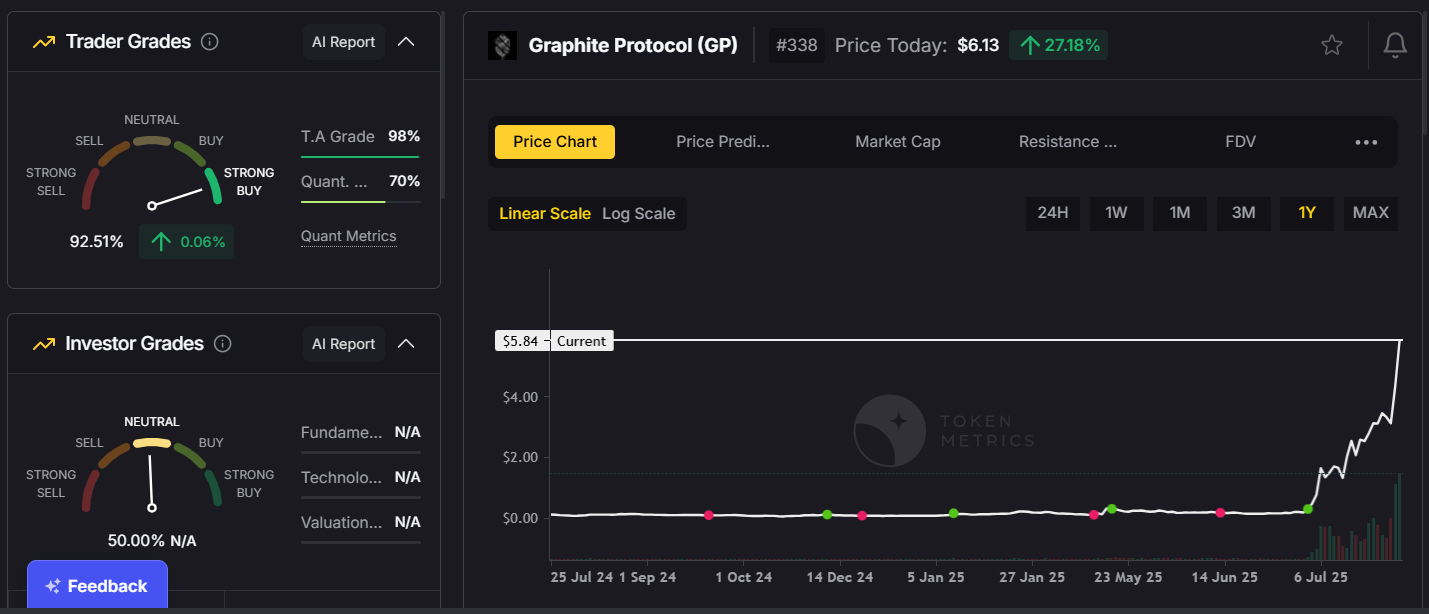
3. Graphite Protocol:
Developers behind Bonk Fun (a leading meme token platform), Graphite has created a buyback and burn model linked to Bonk’s success, aligning token value directly with ecosystem growth.
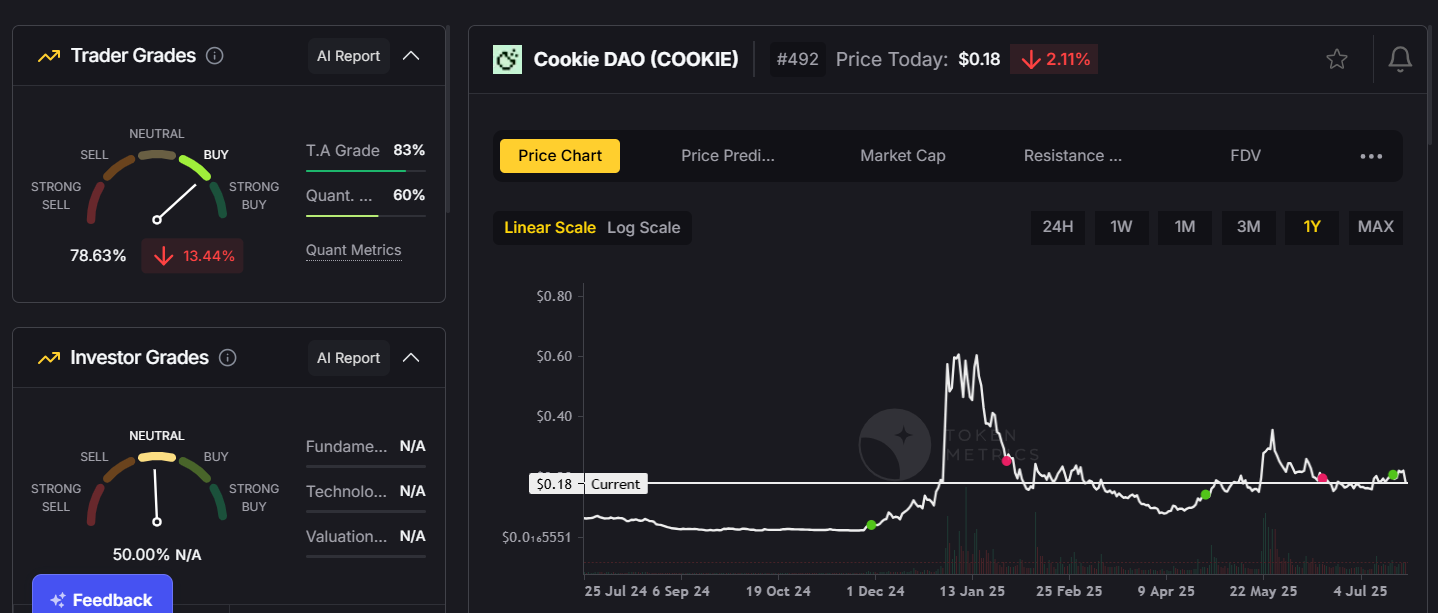
4. CookieDAO:
Initially positioned as an AI agent platform, CookieDAO is now expanding into proof-of-belief systems, adding new utilities and campaign features for Web3 projects.

The Risk Side: Why Moonshots Can Go to Zero

Moonshots are inherently speculative. Common pitfalls include:

  • Team Abandonment or Rug Pulls: Some projects vanish overnight.
  • Unsustainable Hype: Many moonshots rely on short-term narratives that fade.
  • Low Liquidity: Thin markets make it difficult to enter or exit without significant slippage.

A recent example is SpaceMesh, once hyped as a “next Bitcoin.” Despite strong tech, internal disputes and poor execution led to a near-total collapse — a stark reminder that good code doesn’t always equal good investment.

Managing Risk: A Practical Approach

If you’re trading moonshots, risk management is everything.

1. Position Sizing:
Never allocate more than 1% of your portfolio to any single moonshot. Spreading capital across multiple small positions reduces the impact of one token collapsing.

2. Diversification:
Balance moonshots with higher-cap tokens to stabilize overall portfolio performance.

3. Predefined Exits:
Set clear take-profit and stop-loss levels before entering a trade. Emotional decisions often lead to losses.

4. Time Your Entries:
Consider entering after initial hype cools but before major announcements or roadmap milestones.

The Future of Moonshots: Are They Worth It?

While moonshots can be risky, they remain an integral part of crypto’s DNA. For many traders, they serve as lottery tickets in a market where early discovery can lead to life-changing gains.

In 2025, moonshots are evolving. They’re no longer just meme-driven gambles. Increasingly, they represent experimental innovation — blending DeFi models, AI integrations, and community governance in ways that push the boundaries of blockchain technology.

Conclusion

Moonshots are not for the faint-hearted. They require research, timing, and above all, discipline. In 2025, with themes like AI-driven platforms, decentralized social networks, and community-focused DeFi reshaping the market, the next breakout token could be hiding in plain sight.

Whether you’re a seasoned trader or a curious newcomer, understanding the dynamics of moonshots — and respecting their risks — is essential for navigating this volatile but potentially rewarding segment of crypto.

Build Smarter Crypto Apps &
AI Agents in Minutes, Not Months
Real-time prices, trading signals, and on-chain insights all from one powerful API.
Grab a Free API Key
Token Metrics Team
Token Metrics Team

Recent Posts

Research

How to Find the Next 10x Crypto Token with Token Metrics

Token Metrics Team
4 min
MIN

Every crypto investor dreams of discovering that one hidden gem — the token that goes from unknown to unstoppable, delivering 10x or even 50x returns. But with over 25,000 cryptocurrencies on the market in 2025, the big question remains: how do you actually find the one that will moon before the crowd catches on?

That’s where Token Metrics steps in.

By combining AI-powered crypto signals, narrative filters, advanced grading systems, and deep-dive analytics, Token Metrics makes it easier than ever to identify high-potential projects early — and trade them with confidence.

Whether you’re a retail trader looking for your first big win, or a seasoned investor building a crypto portfolio, Token Metrics gives you the tools to make smarter, faster, and more profitable decisions.

The 10x Formula: What Really Drives Explosive Growth in Crypto?

Not every token is destined for greatness. But nearly every 10x token follows a pattern before it takes off. At Token Metrics, we’ve studied thousands of chart patterns, price trends, and fundamental indicators to isolate the key ingredients most 10x tokens share before they explode:

🔥 1. Bold Signal Trigger

These are early-stage AI signals generated when a token begins to show strong upside potential. Token Metrics’ AI tracks market data, price momentum, sentiment, and technical indicators to identify early breakout signals.

📈 2. High Trader & Investor Grades

  • Trader Grade reflects short-term price action, momentum, and volume.
  • Investor Grade scores long-term potential based on liquidity, backers, tokenomics, community traction, and fundamentals.

When both grades are high — especially above 80 or 90 — it’s often a green light.

🌐 3. Trending Narrative

Every bull run has its dominant themes: DeFi in 2020, NFTs in 2021, AI and Modular Chains in 2025. A token aligned with a current hot narrative is more likely to gain attention and capital inflow.

📊 4. Community Growth

Real traction shows up through social media engagement, Discord activity, Telegram volume, GitHub commits, and on-chain user growth. Token Metrics integrates this into its AI analysis to measure rising network effect.

Token Metrics in Action: The Launch Coin Case Study

To see this in action, let’s look at Launchcoin, one of the most explosive tokens of early 2025. Launchcoin allowed anyone to tokenize ideas through social media replies — making it the centerpiece of the creator token narrative.

It went from stealth mode to stardom in days, ultimately delivering a 35x return for users who caught it early. How?

  • ✅ It appeared on the Token Metrics Market Page with a bold signal.
  • Trader Grade > 90 indicated massive price momentum.
  • ✅ The token was embedded in the hot social token narrative.
  • ✅ Community activity on X (formerly Twitter) and Discord spiked rapidly.

Users who followed the early bold signal and confirmed it with high grades had the data needed to act decisively — and ride the wave before it crested.

Token Metrics Tools That Help You Spot the Next 10x

Token Metrics isn’t just a signal service — it’s a full-suite crypto analytics platform designed to help traders and investors discover, analyze, and act on opportunities before the crowd.

Here are the core tools that help you catch winners early:

🔍 1. Market Page

View a curated dashboard of the latest AI-generated bold signals, updated in real time. Filter by:

  • Signal strength
  • Trader or Investor Grade
  • Chain (Ethereum, Solana, Base, etc.)
  • Sector (AI, DeFi, Gaming, Modular, Memecoins)
  • ROI since signal

This is your front-line tool for finding high-upside tokens before they trend on social media or exchanges.

📄 2. Token Detail Pages

Dig deeper into any token with complete analysis, including:

  • Grade breakdowns (with reasoning)
  • Historical signal performance
  • Price charts with annotated buy/sell points
  • Narrative classification
  • Community sentiment metrics

These pages help you validate and compare tokens before jumping in.

🧠 3. Narrative Filters

Narratives drive attention and capital in crypto. Use AI-driven filters to discover tokens within hot themes like:

  • AI Agents
  • Modular Chains
  • RWA (Real World Assets)
  • DeFi Lending
  • Gaming Tokens
  • Social & Creator Tokens

Narrative filtering helps you spot which sectors are heating up and which tokens are leading the charge.

🚀 4. Top Gainers Tab

Get a real-time feed of tokens that are climbing the ranks fastest based on signal performance, volume, and momentum. Great for catching short-term breakouts.

📬 5. Alerts and Watchlists

Set custom alerts for:

  • Grade thresholds
  • New bold signals
  • Tokens entering Top Gainers
  • Narrative rotations

This ensures you never miss a move — even if you’re not logged in 24/7.

Tips for Finding the Next 10x Crypto Token

Using Token Metrics gives you an edge, but timing and execution still matter. Here are key strategies:

Act Fast on Bold Signals

Early bold signals are where most 10x gains start. Check the Market Page daily and move quickly when grades align.

Use Grade Confirmation

Don’t just chase price action. Look for both Trader and Investor Grades above 80 — ideally above 90 for the biggest potential moves.

Monitor Narrative Cycles

Tokens in trending narratives often rise faster. Track narrative heatmaps on Token Metrics to stay aligned with the market zeitgeist.

Revisit Signals Daily

Momentum can shift fast. A token might go from a bold signal to a breakout in 24–48 hours. Stay on top of daily updates.

Diversify Across Narratives

Don’t go all-in on one theme. Spread bets across AI, DeFi, Memes, and Infrastructure to capture multiple emerging waves.

Token Metrics: Making Crypto Trading Easier, Smarter, and More Profitable

The crypto markets can be overwhelming — with noise, scams, and hype around every corner. Token Metrics simplifies the process by turning complex data into actionable insights.

Whether you're looking to catch your first 10x, avoid false pumps, or build a smart long-term crypto portfolio, Token Metrics gives you:

  • 🧠 Clarity in a noisy market
  • 📊 Data-backed conviction instead of guessing
  • Speed in identifying trends before they peak
  • Confidence to buy, hold, or exit with precision

With tools designed for traders, investors, and builders alike, Token Metrics turns analytics into alpha.

Final Thoughts: Don’t Chase Pumps — Predict Them

The next 10x token is already out there. It might be trading under the radar today, quietly showing early signs — a bold signal, strong grade, growing community.

Token Metrics is your map.

You don’t need to follow the crowd. With the right tools and discipline, you can trade ahead of the market, find the next Launchcoin, and position yourself for outsized gains.

Start your journey now at tokenmetrics.com — because in crypto, alpha favors the informed.

Research

How Token Metrics Spotted HYPE Before the Breakout — And Why It Matters for Every Crypto Trader

Token Metrics Team
4 min
MIN

The crypto market has been a rollercoaster lately.

Bitcoin is dipping. Altcoins are bleeding. Sentiment across the board is skittish. Fear is gripping retail traders — and in times like these, many are unsure where to turn, what to buy, or when to hold back.

But not everyone’s losing.

Some traders are still finding wins. One example? Hyperliquid (HYPE) — a standout performer in April 2025. And here’s the kicker: Token Metrics called the move before it happened.

While most traders were distracted by meme coins or frozen in fear, Token Metrics users were riding a +51.8% breakout, armed with AI-driven insights and data-backed confidence. This blog breaks down what happened, how Token Metrics spotted the trade before the crowd, and what tools you can use today to find the next HYPE-level breakout before it happens.

The Hyperliquid Surge: What Happened?

On April 14, while much of Crypto Twitter was silent on HYPE, Token Metrics issued a bullish signal on the token. The platform’s AI-powered Trader Grade identified a strong setup forming — based on technical indicators, rising volume, and early momentum shifts.

That signal marked the beginning of a +51.8% price surge, which saw HYPE peak at $38.50 before a broad market correction pulled it back to ~$32.40.

Even with the correction, traders who acted on the early signal locked in solid profits, exited smart, or are now watching for the next move with eyes wide open — guided by grades, not guesswork.

Why Token Metrics Got It Right — When Others Missed It

While most platforms react to price action after it happens, Token Metrics is built to anticipate movement before it’s obvious. Here’s how:

Technical Momentum Detection

The Trader Grade analyzes short-term price action, RSI trends, MACD crossovers, breakout patterns, and dozens of other technical indicators. HYPE’s chart showed tightening consolidation and rising buy volume — and TM’s systems flagged it in real time.

Volume Spike Recognition

One of the earliest clues in any breakout is an uptick in volume. Token Metrics identifies surging liquidity that precedes breakouts — something that traditional screeners miss or catch late.

Narrative Tracking

Hyperliquid was part of a subtle but growing "on-chain perpetuals" narrative — a theme most traders weren’t tracking yet. TM’s AI-powered narrative filters helped surface HYPE as an early player in a trending category.

Signal Strength Confidence

Token Metrics doesn’t just throw out signals randomly. The platform assigns confidence scores based on data quality, historical performance, and AI pattern recognition. HYPE didn’t just look good — it looked statistically strong.

Current Situation: Pullback or Setup?

After topping at $38.50, HYPE retraced — now sitting about 15.8% below its high. Some might see weakness. But Token Metrics helps traders read beyond the price:

  • 📈 Trader Grade still says “Buy” — meaning short-to-mid-term bullish momentum is intact.
  • 🟡 Investor Grade is Neutral — a smart, cautious stance until more long-term data emerges.
  • 🔍 Key Level: $32 — this is the zone bulls need to defend to keep the trend alive.

This context is what makes Token Metrics invaluable. While the crowd panics, TM users stay informed, balanced, and ready.

Token Metrics in Action: Trading with Data, Not Emotion

Let’s zoom out. Why does this matter for your trading journey?

Most traders operate on emotion, social media chatter, or FOMO. Token Metrics flips that model on its head — giving you a complete data-driven crypto trading toolkit:

🧠 AI-Powered Trader Grades

These grades score tokens on a 0–100 scale based on short-term technical momentum. A Trader Grade above 80 often precedes a strong move — as seen with HYPE.

📊 Investor Grades for Long-Term Confidence

Built from 80+ on-chain and off-chain data points — including liquidity, tokenomics, VC backers, exchange listings, community engagement, and developer activity.

📈 Real-Time Market Signals

Get alerted when a new bullish or bearish signal is triggered. These alerts are based on pattern recognition, performance history, and current price action.

🌐 Narrative Filters

Narratives drive price — from DeFi Summer to AI Agent tokens. TM helps you stay on top of evolving themes and find the tokens leading those trends early.

🔔 Alerts & Watchlists

Set custom alerts for grade movements, bold signals, or top gainer movements — so you never miss a trade even when you’re not glued to the screen.

Key Trading Benefits of Using Token Metrics

Let’s break it down: Why use Token Metrics instead of trading blindly?

1. Spot Breakouts Early

Tools like the Market Page and Top Gainers tab help you spot tokens heating up — before they explode. You won’t be the one buying at the top anymore.

2. Avoid FOMO and Bad Buys

TM’s objective grades help filter out low-quality tokens. You can avoid chasing scams or hype-based pumps with no foundation.

3. Simplify Your Research

Instead of spending hours flipping through charts and Twitter threads, Token Metrics gives you instant, high-signal data — all in one place.

4. Trade With Confidence

Whether you’re swing trading or building a long-term bag, the Trader and Investor Grades help validate (or invalidate) your bias.

5. Stay Ahead of Market Rotations

The crypto market rotates fast. Token Metrics surfaces where capital is flowing — and which narratives are gaining strength — so you can rotate with it.

What to Do Next: Trade the Signal, Not the Crowd

Looking ahead, HYPE’s next move depends on what happens at the $32 support zone:

  • ✅ If it holds: there’s room for upside continuation. The Trader Grade supports it.
  • ❌ If it breaks: eyes shift to $25 — a critical support where new buyers may step in.

Either way, Token Metrics users won’t be guessing. They’ll wait for the next signal — bullish or bearish — and make calculated moves based on real data.

This is the difference between reactive trading and strategic trading.

Final Takeaway: Token Metrics Helps You Trade Smarter, Not Harder

The HYPE breakout wasn’t luck. It was the result of acting on strong, data-backed signals before the crowd caught on.

If you’re tired of chasing pumps, panicking in drawdowns, or wondering why others always seem to find winners early, then it's time to level up.

With Token Metrics, you can:

  • 🔍 Spot early movers like HYPE
  • 📊 Trade with AI-powered confidence
  • 📈 Get in before the trend — and exit before the crash
  • 🧠 Make every trade a calculated decision

Ready to Catch the Next HYPE?

Join thousands of traders using Token Metrics to find breakout tokens before they pump.

👉 Explore the platform now at tokenmetrics.com
👉 Get real-time signals, bold alerts, and daily data updates
👉 Trade with structure — not speculation

Because in crypto, the edge goes to the trader with information, not emotion.

Research

Solana Price Action: Will the Bulls Regain Control? Token Metrics Signals Offer Clues

Token Metrics Team
4 min
MIN

Solana has been one of the most closely watched altcoins in the 2025 crypto cycle. With its blazing speed, developer activity, and expanding DePIN ecosystem, Solana has remained on every smart investor’s radar. But with the broader market pulling back sharply — and Bitcoin dipping below $105K — traders are asking: Is Solana still a buy?

Token Metrics' AI-powered tools offer critical insights into this volatile moment.

April's Bullish Signal Paid Off
Token Metrics’ proprietary indicator turned bullish on Solana on April 19, when the price was just $138.18. That signal wasn’t just noise. Within a month, Solana surged by 33.1%, reaching $184 by May 23.

This kind of real-time, data-driven signal is exactly why traders are turning to Token Metrics. Rather than guessing or chasing hype, our platform delivers objective, AI-backed alerts that help traders enter early and exit intelligently.

The Pullback: Market-Wide, Not Solana-Specific
Fast forward to today, and the story has changed. Solana is undergoing a major pullback, largely driven by the overall market correction. Bitcoin’s slide below $105K has dragged most altcoins down, Solana included.

However, Token Metrics' Trader Grade for Solana is now 'Neutral' — not bearish. That’s a crucial distinction. While momentum has cooled, our system is not yet signaling a full reversal. That means there’s still room for recovery.

Technical Outlook: The $160 Level is Critical
Technical analysis highlights a key battleground at $160. If bulls can reclaim this level in the near term, the uptrend could resume. Failure to hold above it, however, could open the door for deeper losses.

Token Metrics users can monitor these levels in real-time with our dynamic charts, trend indicators, and updated market signals.

What Traders Should Watch Next

  • Market Signal Shift: If the Token Metrics market signal flips to bearish, it’s a red flag. Until then, volatility may still offer upside.
  • $160 Breakout: This is the technical threshold bulls must defend.
  • Volume and Sentiment: A spike in volume or positive narrative news could signal a reversal.

Conclusion
Solana remains a high-potential asset — but trading it without real-time analytics in this environment is risky. Token Metrics doesn’t just tell you what’s happening; it shows why it’s happening and what to do next.

Join Token Metrics today to access AI-powered trading signals, risk analysis, and the tools to trade crypto like a pro — even in uncertain markets.

Choose from Platinum, Gold, and Silver packages
Reach with 25–30% open rates and 0.5–1% CTR
Craft your own custom ad—from banners to tailored copy
Perfect for Crypto Exchanges, SaaS Tools, DeFi, and AI Products