Back to blog
Crypto Basics

Pepe Coin Price Prediction 2025, 2030 - Forecast Analysis

Explore Pepe coin price predictions for 2025 and 2030. Gain valuable insights with expert forecast analysis to make informed investment decisions.
Marcus K
5 Minutes
Want Smarter Crypto Picks—Free?
See unbiased Token Metrics Ratings for BTC, ETH, and top alts.
Thank you! Your submission has been received!
Oops! Something went wrong while submitting the form.
 No credit card | 1-click unsubscribe

In the ever-evolving world of cryptocurrencies, meme coins have gained significant attention. One such meme coin that has caught the interest of investors and enthusiasts is Pepe Coin. 

With its unique branding and community-driven approach, Pepe Coin has created a buzz in the market. In this article, we will delve into the future prospects of Pepe Coin, providing a comprehensive price prediction analysis for 2025 and 2030.

Pepe Coin Overview

Before diving into the price prediction, let's take a closer look at Pepe Coin's fundamentals and historical performance. 

Pepe Coin, an ERC-20 token built on the Ethereum blockchain, aims to reimagine the character's positive image and provide a platform for its dedicated community.

Pepe Coin Tokenmics

As of today 12th March 2024, The coin has a current price of $0.00000831 and a market cap of $3.49B. With a circulating supply of 420,690,000,000,000 PEPE, Pepe Coin has experienced significant volatility in the market.

Historical Performance of Pepe Coin

Pepe Coin's historical performance provides insights into its price movements and market trends. The coin reached its all-time high of $0.00000852 but has since experienced a significant decline, currently trading at a highly discounted price from its peak.

Pepe Coin Price Chart

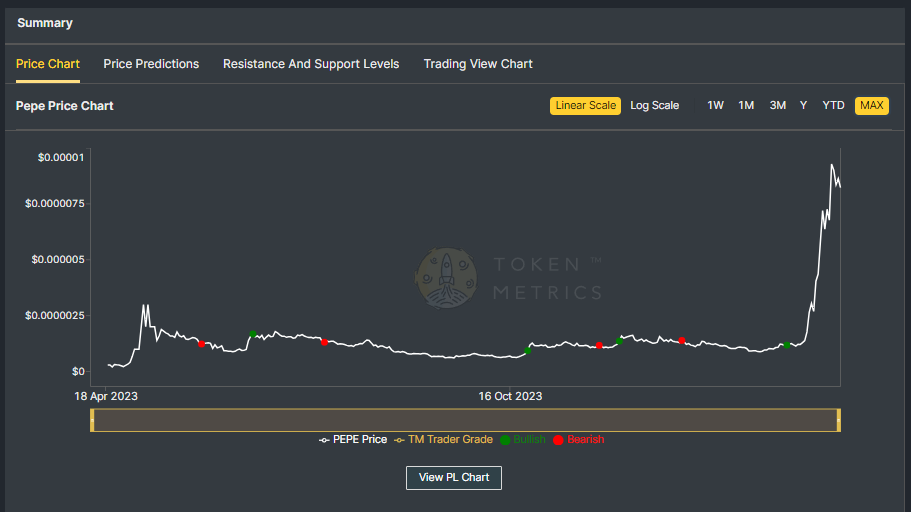
The recent bearish pattern in the 4H chart and weakness in the daily trend indicate a challenging period for Pepe Coin. Also, it's important to note that the meme coin sector has witnessed pullbacks and corrections, making it crucial to analyze the broader market sentiment.

Pepe Coin Current Fundamentals

To evaluate the potential future performance of Pepe Coin, it's essential to consider its current fundamentals. The recent alteration in the multi-sig wallet's configuration, reducing the required signatures for fund transfers, has raised concerns among the crypto community. 

Large token transfers to various exchanges, such as OKX, Binance, and Bybit, have triggered discussions regarding the project's transparency and distribution of tokens. 

It's worth mentioning that the Pepe developers' wallet retains only 2% of the total supply, with no individual wallet holding more than 0.9% of the supply.

Pepe Coin Price Prediction - Scenario Analysis

To forecast the potential price trajectory of Pepe Coin, we will analyze different scenarios, including a bullish market scenario and a bearish market scenario.

Pepe Coin Price Prediction - Bullish Market Scenario

In a bullish market scenario where positive market sentiment prevails, Pepe Coin's price has the potential to experience significant growth. Several factors could contribute to this bullish trend, including increased adoption, technological advancements, and positive regulatory developments.

If the crypto market cap hits $3 Trillion and Pepe Coin retains its current 0.13% dominance, its price could ascend to $0.00000913.

In a more bullish scenario of the crypto market surging to $10 Trillion, Pepe Coin's price could soar to a staggering $0.0000304, resulting in a potential 7x return for investors.

It is important to note that these predictions are based on various factors and assumptions, and market conditions can change rapidly. However, bullish market sentiment and increased adoption of Pepe Coin's solutions could drive its price to new heights.

Pepe Coin Price Prediction
Start Your Free Trial Today and Uncover Your Token's Price Prediction and Forecast on Token Metrics

Pepe Coin Price Prediction - Bearish Market Scenario

In the event of a bearish market, Pepe Coin's price could experience a correction, potentially leading to a decrease in its value. In this case, the price of Pepe Coin may face downward pressure with a decreased dominance of 0.06%.

In this scenario, If the crypto market cap hits $3 Trillion, Pepe Coin could trade around $0.00000456 in the short term and struggle to surpass $0.0000152 by 2030 even if the total crypto market cap surpasses the $10 Trillion mark.

It is crucial to consider the potential risks and challenges that Pepe Coin may face. Factors such as regulatory developments, competition from other projects, and technological advancements can affect the growth trajectory of Pepe Coin.

Also Read - Next Crypto Bull Run

Pepe Coin Price Prediction - Industry Expert Opinion

To provide a more comprehensive view, let's explore the opinions of industry experts regarding the future of Pepe Coin. While there is no consensus among experts. 

The Changelly platform predicts Pepe Coin could reach $0.0000540 to $0.0000630 by 2030, and experts from Coinpedia forecast that it could reach minimum and maximum prices of 0.0000037 and 0.0000073 by the end of 2025. By the end of 2030, the price of Pepe Coin could reach 0.000012 to 0.000015.

Other industry analysts have varying opinions on the future price of Pepe Coin. Ambcrypto.com predicts that Pepe Coin could reach $0.000034 to $0.000041 by 2030.

Note - Start Your Free Trial Today and Uncover Your Token's Price Prediction and Forecast on Token Metrics.

Pepe Coin's Current Developments and Future Potential

Pepe Coin's future potential lies in its ability to address real-time problems and explore new blockchain integration. The recent developments, such as the alteration in the multi-sig wallet's configuration, indicate a proactive approach from the Pepe Coin team. 

Many crypto enthusiasts believe that the project's success will depend on gaining wider adoption and maintaining community engagement.

Also Read - Ripple (XRP) Price Prediction

Conclusion

In conclusion, the future of Pepe Coin remains uncertain, with potential for both growth and challenges. Our price prediction analysis suggests that in a bullish market scenario, the price of Pepe Coin could reach new highs, while in a bearish market scenario, it may face resistance. 

It's important for investors and enthusiasts to conduct thorough research and consider the broader market trends before making any investment decisions. 

As with any investment, risks are involved, and it's crucial to exercise caution and seek professional advice.

Disclaimer

The information provided on this website does not constitute investment advice, financial advice, trading advice, or any other advice, and you should not treat any of the website's content as such.

Token Metrics does not recommend buying, selling, or holding any cryptocurrency. Conduct your due diligence and consult your financial advisor before making investment decisions.

Build Smarter Crypto Apps &
AI Agents in Minutes, Not Months
Real-time prices, trading signals, and on-chain insights all from one powerful API.
Grab a Free API Key
About Token Metrics
Token Metrics: AI-powered crypto research and ratings platform. We help investors make smarter decisions with unbiased Token Metrics Ratings, on-chain analytics, and editor-curated “Top 10” guides. Our platform distills thousands of data points into clear scores, trends, and alerts you can act on.
30 Employees
analysts, data scientists, and crypto engineers
30 Employees
analysts, data scientists, and crypto engineers
30 Employees
analysts, data scientists, and crypto engineers
Want Smarter Crypto Picks—Free?
See unbiased Token Metrics Ratings for BTC, ETH, and top alts.
Thank you! Your submission has been received!
Oops! Something went wrong while submitting the form.
 No credit card | 1-click unsubscribe
Token Metrics Team
Token Metrics Team

Recent Posts

Research

Bitcoin Cash (BCH) 2028 Price Targets: Token Metrics Scenarios

Token Metrics Team
7 min read

Market Context for Bitcoin Cash: The Case for 2028

The Layer 1 landscape is consolidating as users and developers gravitate to chains with clear specialization. Bitcoin Cash positions itself as a payment-focused chain with low fees and quick settlement for everyday usage.

The scenario projections below map potential outcomes for BCH across different total crypto market sizes. Base cases assume steady usage and listings, while moon scenarios factor in stronger liquidity and accelerated adoption.


Disclosure

Educational purposes only, not financial advice. Crypto is volatile, do your own research and manage risk.

How to read it: Each band blends cycle analogues and market-cap share math with TA guardrails. Base assumes steady adoption and neutral or positive macro. Moon layers in a liquidity boom. Bear assumes muted flows and tighter liquidity.

TM Agent baseline:

Token Metrics lead metric for Bitcoin Cash, cashtag $BCH, is a TM Grade of 54.81%, which translates to Neutral, and the trading signal is bearish, indicating short-term downward momentum. This implies Token Metrics views $BCH as mixed value long term: fundamentals look strong, while valuation and technology scores are weak, so upside depends on improvements in adoption or technical development. Market context: Bitcoin has been setting market direction, and with broader risk-off moves altcoins face pressure, which increases downside risk for $BCH in the near term.

Live details:

Bitcoin Cash Token Details 

Buy BCH on MEXC

Affiliate Disclosure: We may earn a commission from qualifying purchases made via this link, at no extra cost to you.

Key Takeaways

  • Scenario driven, outcomes hinge on total crypto market cap, higher liquidity and adoption lift the bands.
  • Fundamentals: Fundamental Grade 80.41% (Community 62%, Tokenomics 100%, Exchange 100%, VC —, DeFi Scanner 72%).
  • Technology: Technology Grade 29.63% (Activity 22%, Repository 70%, Collaboration 48%, Security —, DeFi Scanner 72%).
  • TM Agent gist: Neutral grade, bearish momentum, adoption must improve.
  • Education only, not financial advice.

Scenario Analysis

Token Metrics scenarios span four market cap tiers, each representing different levels of crypto market maturity and liquidity:

  • 8T: At an 8t total crypto market cap, BCH projects to $910.79 in bear conditions, $1,025.20 in the base case, and $1,139.62 in bullish scenarios.  
  • 16T: Doubling the market to 16 trillion expands the range to $1,606.59 (bear), $1,949.83 (base), and $2,293.07 (moon).  
  • 23T: At 23 trillion, the scenarios show $2,302.38, $2,874.46, and $3,446.53 respectively.  
  • 31T: In the maximum liquidity scenario of 31 trillion, BCH could reach $2,998.18 (bear), $3,799.08 (base), or $4,599.99 (moon).  

Each tier assumes progressively stronger market conditions, with the base case reflecting steady growth and the moon case requiring sustained bull market dynamics.

Why Consider the Indices with Top-100 Exposure

Bitcoin Cash represents one opportunity among hundreds in crypto markets. Token Metrics Indices bundle BCH with top one hundred assets for systematic exposure to the strongest projects. Single tokens face idiosyncratic risks that diversified baskets mitigate.

Historical index performance demonstrates the value of systematic diversification versus concentrated positions.

Join the early access list

What Is Bitcoin Cash?

Bitcoin Cash is a peer-to-peer electronic cash network focused on fast confirmation and low fees. It launched in 2017 as a hard fork of Bitcoin with larger block capacity to prioritize payments. The chain secures value transfers using proof of work and aims to keep everyday transactions affordable.

BCH is used to pay transaction fees and settle transfers, and it is widely listed across major exchanges. Adoption centers on payments, micropayments, and remittances where low fees matter. It competes as a payment‑focused Layer 1 within the broader crypto market.

Token Metrics AI Analysis

Token Metrics AI provides comprehensive context on Bitcoin Cash's positioning and challenges.

Vision:

Bitcoin Cash (BCH) is a cryptocurrency that emerged from a 2017 hard fork of Bitcoin, aiming to function as a peer-to-peer electronic cash system with faster transactions and lower fees. It is known for prioritizing on-chain scalability by increasing block sizes, allowing more transactions per block compared to Bitcoin. This design choice supports its use in everyday payments, appealing to users seeking a digital cash alternative. Adoption has been driven by its utility in micropayments and remittances, particularly in regions with limited banking infrastructure. However, Bitcoin Cash faces challenges including lower network security due to reduced mining hash rate compared to Bitcoin, and ongoing competition from both Bitcoin and other scalable blockchains. Its value proposition centers on accessibility and transaction efficiency, but it operates in a crowded space with evolving technological and regulatory risks.

Problem:

The project addresses scalability limitations in Bitcoin, where rising transaction fees and slow confirmation times hinder its use for small, frequent payments. As Bitcoin evolved into a store of value, a gap emerged for a blockchain-based currency optimized for fast, low-cost transactions accessible to the general public.

Solution:

Bitcoin Cash increases block size limits from 1 MB to 32 MB, enabling more transactions per block and reducing congestion. This on-chain scaling approach allows for faster confirmations and lower fees, making microtransactions feasible. The network supports basic smart contract functionality and replay protection, maintaining compatibility with Bitcoin's core architecture while prioritizing payment utility.

Market Analysis:

Bitcoin Cash operates in the digital currency segment, competing with Bitcoin, Litecoin, and stablecoins for use in payments and remittances. While not the market leader, it occupies a niche focused on on-chain scalability for transactional use. Its adoption is influenced by merchant acceptance, exchange liquidity, and narratives around digital cash. Key risks include competition from layer-2 solutions on other blockchains, regulatory scrutiny of cryptocurrencies, and lower developer and miner activity compared to larger networks. Price movements are often tied to broader crypto market trends and internal protocol developments. Despite its established presence, long-term growth depends on sustained utility, network security, and differentiation in a market increasingly dominated by high-throughput smart contract platforms.

Fundamental and Technology Snapshot from Token Metrics

Fundamental Grade: 80.41% (Community 62%, Tokenomics 100%, Exchange 100%, VC —, DeFi Scanner 72%).  

Technology Grade: 29.63% (Activity 22%, Repository 70%, Collaboration 48%, Security —, DeFi Scanner 72%).  

Catalysts That Skew Bullish

  • Institutional and retail access expands with ETFs, listings, and integrations.
  • Macro tailwinds from lower real rates and improving liquidity.
  • Product or roadmap milestones such as upgrades, scaling, or partnerships.

Risks That Skew Bearish

  • Macro risk-off from tightening or liquidity shocks.
  • Regulatory actions or infrastructure outages.
  • Concentration or validator economics and competitive displacement.

FAQs

Can BCH reach $3,000?

Based on the scenarios, BCH could reach $3,000 in the 23T moon case and 31T base case. The 23T tier projects $3,446.53 in the moon case. Not financial advice.

Can BCH 10x from current levels?

At current price of $553.54, a 10x would reach $5,535.40. This falls within the 31T base and moon cases. Bear in mind that 10x returns require substantial market cap expansion. Not financial advice.

Should I buy BCH now or wait?

Timing depends on your risk tolerance and macro outlook. Current price of $553.54 sits below the 8T bear case in our scenarios. Dollar-cost averaging may reduce timing risk. Not financial advice.  

Next Steps

Track live grades and signals

Join Indices Early Access

Want exposure? Buy BCH on MEXC

Disclosure

Educational purposes only, not financial advice. Crypto is volatile, do your own research and manage risk.

Research

Chainlink (LINK) 2027 Price Targets: Token Metrics Scenarios

Token Metrics Team
8 min read

Understanding LINK's 2027 Potential

Infrastructure protocols become more valuable as the crypto ecosystem scales and relies on robust middleware. Chainlink provides critical oracle infrastructure where proven utility and deep integrations drive long-term value over retail speculation. Increasing institutional adoption raises demand for professional-grade data delivery and security.

Token Metrics projections for LINK below span multiple total market cap scenarios from conservative to aggressive. Each tier assumes different levels of infrastructure demand as crypto evolves from speculative markets to institutional-grade systems. These bands frame LINK's potential outcomes into 2027.


Disclosure

Educational purposes only, not financial advice. Crypto is volatile, do your own research and manage risk.

How to read it: Each band blends cycle analogues and market-cap share math with TA guardrails. Base assumes steady adoption and neutral or positive macro. Moon layers in a liquidity boom. Bear assumes muted flows and tighter liquidity.

TM Agent baseline: Token Metrics lead metric for Chainlink, cashtag $LINK, is a TM Grade of 23.31%, which translates to a Sell, and the trading signal is bearish, indicating short-term downward momentum. This means Token Metrics currently does not endorse $LINK as a long-term buy at current conditions.

Live details: Chainlink Token Details

Access: Buy LINK on MEXC

Affiliate Disclosure: We may earn a commission from qualifying purchases made via this link, at no extra cost to you.

Key Takeaways

  • Scenario driven, outcomes hinge on total crypto market cap, higher liquidity and adoption lift the bands.
  • Fundamentals: Fundamental Grade 74.58% (Community 81%, Tokenomics 100%, Exchange 100%, VC —, DeFi Scanner 17%).
  • Technology: Technology Grade 88.50% (Activity 81%, Repository 72%, Collaboration 100%, Security 86%, DeFi Scanner 17%).
  • TM Agent gist: bearish signal with limited upside unless fundamentals or market regime change.
  • Education only, not financial advice.

Scenario Analysis

Token Metrics scenarios span four market cap tiers, each representing different levels of crypto market maturity and liquidity:

8T: At an 8 trillion dollar total crypto market cap, LINK projects to $26.10 in bear conditions, $30.65 in the base case, and $35.20 in bullish scenarios.  

16T: Doubling the market to 16 trillion expands the range to $42.64 (bear), $56.29 (base), and $69.95 (moon).  

23T: At 23 trillion, the scenarios show $59.18, $81.94, and $104.70 respectively.  

31T: In the maximum liquidity scenario of 31 trillion, LINK could reach $75.71 (bear), $107.58 (base), or $139.44 (moon).  

Why Consider the Indices with Top-100 Exposure

Chainlink represents one opportunity among hundreds in crypto markets. Token Metrics Indices bundle LINK with top one hundred assets for systematic exposure to the strongest projects. Single tokens face idiosyncratic risks that diversified baskets mitigate.

Historical index performance demonstrates the value of systematic diversification versus concentrated positions.

Join the early access list

What Is Chainlink?

Chainlink is a decentralized oracle network that connects smart contracts to real-world data and systems. It enables secure retrieval and verification of off-chain information, supports computation, and integrates across multiple blockchains. As adoption grows, Chainlink serves as critical infrastructure for reliable data feeds and automation.

The LINK token is used to pay node operators and secure the network’s services. Common use cases include DeFi price feeds, insurance, and enterprise integrations, with CCIP extending cross-chain messaging and token transfers.

Token Metrics AI Analysis

Vision: Chainlink aims to create a decentralized, secure, and reliable network for connecting smart contracts with real-world data and systems. Its vision is to become the standard for how blockchains interact with external environments, enabling trust-minimized automation across industries.

Problem: Smart contracts cannot natively access data outside their blockchain, limiting their functionality. Relying on centralized oracles introduces single points of failure and undermines the security and decentralization of blockchain applications. This creates a critical need for a trustless, tamper-proof way to bring real-world information onto blockchains.

Solution: Chainlink solves this by operating a decentralized network of node operators that fetch, aggregate, and deliver data from off-chain sources to smart contracts. It uses cryptographic proofs, reputation systems, and economic incentives to ensure data integrity. The network supports various data types and computation tasks, allowing developers to build complex, data-driven decentralized applications.

Market Analysis: Chainlink is a market leader in the oracle space and a key infrastructure component in the broader blockchain ecosystem, particularly within Ethereum and other smart contract platforms. It faces competition from emerging oracle networks like Band Protocol and API3, but maintains a strong first-mover advantage and widespread integration across DeFi, NFTs, and enterprise blockchain solutions. Adoption is driven by developer activity, partnerships with major blockchain projects, and demand for secure data feeds. Key risks include technological shifts, regulatory scrutiny on data providers, and execution challenges in scaling decentralized oracle networks. As smart contract usage grows, so does the potential for oracle services, positioning Chainlink at the center of a critical niche, though its success depends on maintaining security and decentralization over time.

Fundamental and Technology Snapshot from Token Metrics

Fundamental Grade: 74.58% (Community 81%, Tokenomics 100%, Exchange 100%, VC —, DeFi Scanner 17%).  

Technology Grade: 88.50% (Activity 81%, Repository 72%, Collaboration 100%, Security 86%, DeFi Scanner 17%).  

Catalysts That Skew Bullish

  • Institutional and retail access expands with ETFs, listings, and integrations.
  • Macro tailwinds from lower real rates and improving liquidity.
  • Product or roadmap milestones such as upgrades, scaling, or partnerships.

Risks That Skew Bearish

  • Macro risk-off from tightening or liquidity shocks.
  • Regulatory actions or infrastructure outages.
  • Concentration or validator economics and competitive displacement.

FAQs

Can LINK reach $100?

Yes. Based on the scenarios, LINK could reach $100+ in the 23T moon case. The 23T tier projects $104.70 in the moon case. Not financial advice.

What price could LINK reach in the moon case?

Moon case projections range from $35.20 at 8T to $139.44 at 31T. These scenarios assume maximum liquidity expansion and strong Chainlink adoption. Not financial advice.  

Should I buy LINK now or wait?

Timing depends on risk tolerance and macro outlook. Current price of $18.09 sits below the 8T bear case in the scenarios. Dollar-cost averaging may reduce timing risk. Not financial advice.

Next Steps

Track live grades and signals: Token Details

Join Indices Early Access 

Want exposure? Buy LINK on MEXC 

Disclosure

Educational purposes only, not financial advice. Crypto is volatile, do your own research and manage risk.

Why Token Metrics Ratings Matter

Discover the full potential of your crypto research and portfolio management with Token Metrics. Our ratings combine AI-driven analytics, on-chain data, and decades of investing expertise—giving you the edge to navigate fast-changing markets. Try our platform to access scenario-based price targets, token grades, indices, and more for institutional and individual investors. Token Metrics is your research partner through every crypto market cycle.

Research

Hyperliquid (HYPE) Price Prediction to 2028: Scenario Ranges, Scores and Key Drivers

Token Metrics Team
7 min read

Why 2026 Looks Bullish, And What It Could Mean for HYPE

The crypto market is tilting bullish into 2026 as liquidity, infrastructure, and participation improve across the board. Clearer rules and standards are reshaping the classic four-year cycle, flows can arrive earlier, and strength can persist longer than in prior expansions.

Institutional access is widening through ETFs and custody, while L2 scaling and real-world integrations help sustain on‑chain activity. This healthier backdrop frames our scenario work for HYPE. The ranges below reflect different total crypto market sizes and the share Hyperliquid could capture under each regime.


Disclosure

Educational purposes only, not financial advice. Crypto is volatile, do your own research and manage risk.

How to read it: Each band blends cycle analogues and market-cap share math with TA guardrails. Base assumes steady adoption and neutral or positive macro. Moon layers in a liquidity boom. Bear assumes muted flows and tighter liquidity.

TM Agent baseline: Token Metrics TM Grade is 73.9%, a Buy, and the trading signal is bearish, indicating short-term downward momentum. This means Token Metrics judges HYPE as fundamentally attractive over the long term, while near-term momentum is negative and may limit rallies.

Live details: Hyperliquid Token Details

Buy HYPE

Affiliate Disclosure: We may earn a commission from qualifying purchases made via this link, at no extra cost to you.

Key Takeaways

  • Scenario driven, outcomes hinge on total crypto market cap. Higher liquidity and adoption lift the bands.
  • Fundamentals: Fundamental Grade 76.73% (Community 68%, Tokenomics 60%, Exchange 100%, VC —, DeFi Scanner 92%).
  • Technology: Technology Grade N/A (Activity —, Repository —, Collaboration —, Security —, DeFi Scanner 92%).
  • TM Agent gist: Long-term attractive on fundamentals, near-term momentum is negative and may limit rallies.

Scenario Analysis

Token Metrics scenarios span four market cap tiers, each representing different levels of crypto market maturity and liquidity:

8T: At an 8 trillion dollar total crypto market cap, HYPE projects to $48.81 in bear conditions, $49.92 in the base case, and $51.03 in bullish scenarios.  


16T: Doubling the market to 16 trillion expands the range to $50.72 (bear), $54.05 (base), and $57.38 (moon).  

23T: At 23 trillion, the scenarios show $52.62, $58.17, and $63.72 respectively.  

31T: In the maximum liquidity scenario of 31 trillion, HYPE could reach $54.52 (bear), $62.29 (base), or $70.07 (moon).

Each tier assumes progressively stronger market conditions, with the base case reflecting steady growth and the moon case requiring sustained bull market dynamics.

Why Consider the Indices with Top-100 Exposure

Diversification matters. HYPE is compelling, yet concentrated bets can be volatile. Token Metrics Indices hold HYPE alongside the top one hundred tokens for broad exposure to leaders and emerging winners.

Our backtests indicate that owning the full market with diversified indices has historically outperformed both the total market and Bitcoin in many regimes due to diversification and rotation.

Get early access

What Is Hyperliquid?

Hyperliquid is a decentralized exchange focused on perpetual futures with a high-performance order book architecture. The project emphasizes low-latency trading, risk controls, and capital efficiency aimed at professional and retail derivatives traders. Its token, HYPE, is used for ecosystem incentives and governance-related utilities.

Catalysts That Skew Bullish

  • Institutional and retail access expands with ETFs, listings, and integrations.
  • Macro tailwinds from lower real rates and improving liquidity.
  • Product or roadmap milestones such as upgrades, scaling, or partnerships.

Risks That Skew Bearish

  • Macro risk-off from tightening or liquidity shocks.
  • Regulatory actions or infrastructure outages.
  • Concentration or validator economics and competitive displacement.

FAQs

Can HYPE reach $60?

Yes, the 23T and 31T tiers imply ranges above $60 in the Base and Moon bands, though outcomes depend on liquidity and adoption. Not financial advice.

Is HYPE a good long-term investment?

Outcome depends on adoption, liquidity regime, competition, and supply dynamics. Diversify and size positions responsibly.  

Next Steps

Disclosure

Educational purposes only, not financial advice. Crypto is volatile, do your own research and manage risk.

Your Edge: Powered by Token Metrics

Token Metrics delivers AI-based crypto ratings, scenario projections, and portfolio tools so you can make smarter decisions. Discover real-time analytics on Token Metrics.

Choose from Platinum, Gold, and Silver packages
Reach with 25–30% open rates and 0.5–1% CTR
Craft your own custom ad—from banners to tailored copy
Perfect for Crypto Exchanges, SaaS Tools, DeFi, and AI Products