Back to blog
Research

Ripple (XRP) Price Prediction 2025: Will XRP Hit $500 This Bull Cycle?

XRP surges past $2.50 after Ripple’s SEC win and ETF momentum. Explore XRP price predictions for 2025 and how Token Metrics AI tools help forecast breakouts and manage risk.
Token Metrics Team
8 min
Want Smarter Crypto Picks—Free?
See unbiased Token Metrics Ratings for BTC, ETH, and top alts.
Thank you! Your submission has been received!
Oops! Something went wrong while submitting the form.
 No credit card | 1-click unsubscribe

BUY XRP FROM MEXC!

Ripple’s native token, XRP, is experiencing renewed momentum in 2025, surging to $2.58 and breaking the long-standing $2.50 resistance level. This price movement coincides with Bitcoin's rally past $112,000, signaling that XRP is riding the current bull market wave.

But what’s driving this surge in XRP? Is it sustainable? And could we see XRP hit $5, $7—or even $10—before the end of 2025?

In this highly informative and SEO-optimized blog post, we analyze the factors behind XRP’s rise, evaluate its future potential, and explain why Token Metrics’ AI-powered price prediction tools offer unmatched insights for crypto investors.

🚀 XRP’s Bullish Breakout: A New Chapter in 2025

In July 2025, XRP’s breakout above $2.50 marks one of its strongest price performances since the 2017 bull run. Key drivers behind this bullish trend include:

✅ 1. Ripple’s Legal Victory Against the SEC

Ripple finalized its years-long lawsuit with the U.S. Securities and Exchange Commission (SEC) by paying a $50 million settlement—without admitting XRP is a security. This outcome:

  • Removes a major legal overhang
  • Boosts investor and institutional confidence
  • Clears the path for U.S. regulatory clarity

With the lawsuit resolved, XRP is now eligible for listings, ETF consideration, and greater adoption in regulated financial environments.

✅ 2. Launch of RLUSD Stablecoin

Ripple has successfully launched RLUSD, its native stablecoin backed 1:1 by U.S. dollars. RLUSD provides:

  • Liquidity for XRP-based DeFi
  • Seamless on/off ramps for cross-border payments
  • Utility for RippleNet’s institutional clients

This ecosystem expansion strengthens Ripple’s value proposition and increases XRP utility and demand.

✅ 3. Potential Approval of XRP ETFs

With Ethereum and Bitcoin ETFs already active, XRP is next in line. Analysts estimate:

  • A 90%+ likelihood of XRP ETF approval before 2026
  • Significant inflows from institutional investors upon approval

ETF listings would make XRP easily accessible in retirement accounts, financial advisors’ portfolios, and wealth management platforms—further legitimizing the asset.

✅ 4. Expanding Global Financial Partnerships

Ripple now boasts partnerships with 300+ financial institutions, including:

  • Santander
  • Standard Chartered
  • SBI Holdings
  • Integration with Wormhole for cross-chain liquidity

This positions XRP as a global standard for cross-border payments—a market worth $150+ trillion annually.

📈 XRP Price Prediction for 2025

Analysts and AI models predict a strong upside potential for XRP during this bull cycle. Here's a breakdown of possible scenarios:

Breakout Level to Watch: $3.40
Support Level: $2.10

⚠️ Risks and Challenges Ahead

Despite the bullish momentum, XRP still faces several risks:

❌ 1. Regulatory Ambiguity Outside the U.S.

Although the SEC case is resolved, Ripple faces:

  • Different classifications of XRP in Europe and Asia
  • New compliance standards (e.g., MiCA)
  • Potential resistance from central banks promoting CBDCs

❌ 2. Stablecoin Competition

RLUSD must compete with:

  • USDT and USDC (dominant players)
  • CBDCs and national digital currencies
  • Traditional payment rails like SWIFT GPI

Failure to achieve rapid RLUSD adoption could cap XRP's growth potential.

❌ 3. Market Volatility and Profit-Taking

After explosive gains, whales may lock in profits, causing sharp pullbacks. Key support at $2.10 must hold to maintain bullish structure.

🧠 Why Token Metrics Has the Best XRP Price Prediction Tools

In a fast-moving market, investors need real-time, data-driven predictions—not guesswork. Token Metrics offers the most advanced tools for XRP investors.

✅ 1. AI-Powered Price Forecasts

Token Metrics uses machine learning models trained on years of crypto market data to generate high-accuracy price forecasts.

For XRP, these models consider:

  • Whale wallet accumulation
  • Cross-border transaction volume
  • Stablecoin liquidity metrics
  • Token velocity and exchange flows

The result? A forward-looking price forecast you can trust.

✅ 2. XRP Buy/Sell Signals

The Token Metrics platform issues real-time bullish or bearish signals based on:

  • Technical indicators (MACD, RSI)
  • Exchange net flow
  • Trend strength
  • Historical reversal patterns

These signals help you:

  • Enter at optimal times
  • Avoid fake breakouts
  • Time your profit-taking during rallies

✅ 3. Trader and Investor Grades

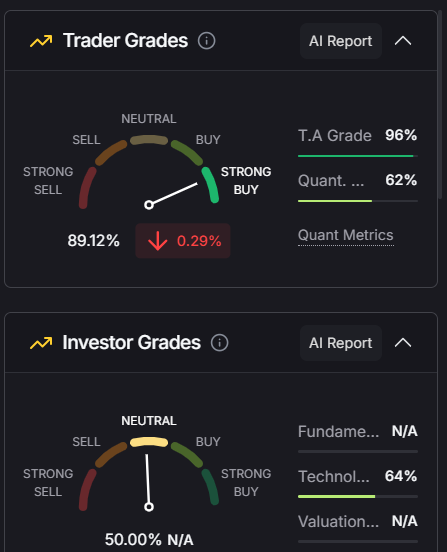
Token Metrics assigns every token—including XRP—a:

  • Trader Grade (short-term trend strength)
  • Investor Grade (long-term fundamental health)

Both are AI-calculated using 80+ metrics, and they update daily. This helps you:

  • Decide whether to swing trade or HODL XRP
  • Compare XRP with other cross-border payment tokens

✅ 4. Custom Alerts and Analysis

With Token Metrics, you can set personalized alerts for XRP:

  • Price thresholds (e.g., alert me if XRP hits $3.40)
  • Percent change triggers (e.g., alert me on +15% move)
  • Grade changes (e.g., notify me if Trader Grade goes above 80)

Alerts are delivered via email, Slack, Telegram, or Discord—so you never miss a key movement.

✅ 5. Detailed Token Page for XRP

The XRP profile page on Token Metrics provides:

  • Live price chart and ROI
  • Real-time exchange volume
  • Whale wallet movements
  • Historical signal success rates

Everything you need for informed XRP investing in one place.

📊 XRP vs. Other Altcoins in 2025

While many altcoins are chasing narratives (AI, memecoins, DePIN), XRP’s case is fundamentally driven by:

  • Regulatory clarity
  • Real-world adoption
  • Enterprise integrations

Token Metrics’ crypto indices help investors diversify by creating thematic portfolios (e.g., “Institutional Adoption,” “Layer-1 Networks,” “Cross-Border Payments”)—with XRP often at the top of the cross-border category.

📉 What If XRP Corrects?

Corrections are part of every bull market. If XRP fails to hold above $2.50:

  • A retracement to $2.10 is likely
  • A break below $2.10 could lead to a retest of $1.80
  • Traders should watch BTC’s movement closely—if Bitcoin reverses sharply, XRP could follow

Use Token Metrics’ bearish signal alerts to de-risk in real time.

✅ Final Thoughts: XRP Is One to Watch in 2025

With legal clarity, a new stablecoin, ETF approval potential, and over 300 institutional partnerships, Ripple and XRP are in their strongest position in years.

If Bitcoin continues its uptrend and XRP breaks above $3.40, the next major rally could take it to $5–$10 by the end of 2025.

But success depends on regulatory support, stablecoin adoption, and institutional inflows—all factors Token Metrics tracks daily with precision.

🔍 Take Action: Use Token Metrics to Trade XRP Smarter

  • Track XRP’s real-time price predictions
  • Monitor short- and long-term signal strength
  • Set alerts for breakouts or corrections
  • Analyze fundamentals and on-chain data

👉 Start now at tokenmetrics.com and gain an edge in XRP trading and investing

Build Smarter Crypto Apps &
AI Agents in Minutes, Not Months
Real-time prices, trading signals, and on-chain insights all from one powerful API.
Grab a Free API Key
About Token Metrics
Token Metrics: AI-powered crypto research and ratings platform. We help investors make smarter decisions with unbiased Token Metrics Ratings, on-chain analytics, and editor-curated “Top 10” guides. Our platform distills thousands of data points into clear scores, trends, and alerts you can act on.
30 Employees
analysts, data scientists, and crypto engineers
Daily Briefings
concise market insights and “Top Picks”
Transparent & Compliant
Sponsored ≠ Ratings; research remains independent
Want Smarter Crypto Picks—Free?
See unbiased Token Metrics Ratings for BTC, ETH, and top alts.
Thank you! Your submission has been received!
Oops! Something went wrong while submitting the form.
 No credit card | 1-click unsubscribe
Token Metrics Team
Token Metrics Team

Recent Posts

Research

Toncoin Price Prediction 2027: $5-$43 Target Analysis | TON

Token Metrics Team
7 min read

Toncoin Price Prediction Framework: Market Cap Scenarios & 2027 Price Forecasts

Layer 1 tokens capture value through transaction fees, staking, and validator economics. TON uses proof-of-stake and a multi-blockchain architecture integrated with Telegram services. This Token Metrics price prediction model analyzes TON price forecasts across different total crypto market sizes, reflecting adoption and transaction demand by 2027.

Disclosure

Educational purposes only, not financial advice. This price prediction analysis is for informational purposes. Crypto is volatile, do your own research and manage risk.

How to read this price prediction:

Each band blends cycle analogues and market-cap share math with TA guardrails. Base assumes steady adoption and neutral or positive macro. Moon layers in a liquidity boom. Bear assumes muted flows and tighter liquidity. These price prediction scenarios provide a range of potential outcomes based on market conditions.

TM Agent baseline:

Token Metrics TM Grade is 74%, Buy, and the trading signal is bullish, indicating positive short-term momentum and strong overall project quality. Concise 12-month numeric price prediction view: scenarios cluster roughly between $5 and $14, with a base case price target near $9.

Live details: Token Details

Key Takeaways for TON Price Prediction

  • Scenario driven: price prediction outcomes hinge on total crypto market cap; higher liquidity and adoption lift the price targets
  • Fundamentals: Fundamental Grade 80.88% (Community 83%, Tokenomics N/A, Exchange 100%, VC 84%, DeFi Scanner 85%)
  • Technology: Technology Grade 77.11% (Activity 55%, Repository 72%, Collaboration 73%, Security N/A, DeFi Scanner 85%)
  • TM Agent gist: bullish signal, price prediction ranges cluster around $5 to $14 with a base case near $9
  • Education only, not financial advice

Toncoin Price Prediction: Scenario Analysis

8T Market Cap Price Prediction:

At an 8 trillion dollar total crypto market cap, TON price prediction projects to $4.36 in bear conditions, $6.28 in the base case, and $8.20 in bullish scenarios.

16T Market Cap Price Prediction:

At 16 trillion, the price prediction range expands to $8.54 (bear), $14.30 (base), and $20.07 (moon).

23T Market Cap Price Prediction:

The 23 trillion tier price forecast shows $12.72, $22.33, and $31.94 respectively.

31T Market Cap Price Prediction:

In the maximum liquidity scenario at 31 trillion, TON price prediction reaches $16.89 (bear), $30.35 (base), or $43.80 (moon).

What Is Toncoin?

The Open Network is a blockchain designed to support fast, low-cost transactions and a scalable ecosystem of decentralized applications. It integrates with digital services and messaging platforms to reach a broad user base, emphasizing high throughput and accessibility.

TON uses a proof-of-stake consensus mechanism with a multi-blockchain architecture. The TON token powers network activity, facilitating transactions, staking, and governance, and is integrated into Telegram-based services for user-friendly in-app payments and wallets.

Token Metrics AI Analysis for Price Prediction

Token Metrics AI provides additional context on Toncoin's technical positioning and market dynamics that inform our price prediction models.

Vision: The vision for Toncoin and The Open Network is to create a fast, secure, and scalable blockchain that enables seamless digital transactions and decentralized services, accessible to millions through integration with everyday communication tools like Telegram.

Problem: Many blockchain networks face limitations in speed, cost, and user accessibility, hindering mainstream adoption. Toncoin aims to address the friction of slow transaction times and high fees seen on older networks, while also lowering the barrier to entry for non-technical users who want to engage with decentralized applications and digital assets.

Solution: TON uses a proof-of-stake consensus mechanism with a multi-blockchain architecture to achieve high scalability and fast finality. The network supports smart contracts, decentralized storage, and domain naming, enabling a wide range of applications. Toncoin facilitates transactions, staking, and network governance, and is integrated into Telegram-based services, allowing for in-app payments and wallet functionality through user-friendly interfaces.

Market Analysis: Toncoin operates in the competitive layer-1 blockchain space, often compared to high-performance networks like Solana and Avalanche, though it differentiates itself through deep integration with Telegram's ecosystem. Its potential for mass adoption stems from access to hundreds of millions of Telegram users, which could drive network effects and utility usage. Unlike meme tokens, Toncoin's value is tied to infrastructure and real-world application rather than speculation or community hype. However, its growth depends on sustained development, regulatory clarity, and actual user engagement within Telegram. Competition from established blockchains and shifting market narratives around scalability and decentralization remain key risks. As a top-tier blockchain by ecosystem potential, Toncoin's market position is influenced more by integration milestones and user adoption than direct price dynamics.

Fundamental and Technology Snapshot from Token Metrics

  • Fundamental Grade: 80.88% (Community 83%, Tokenomics N/A, Exchange 100%, VC 84%, DeFi Scanner 85%)
  • Technology Grade: 77.11% (Activity 55%, Repository 72%, Collaboration 73%, Security N/A, DeFi Scanner 85%)

Catalysts That Skew Bullish for Price Prediction

  • Institutional and retail access expands with ETFs, listings, and integrations
  • Macro tailwinds from lower real rates and improving liquidity
  • Product or roadmap milestones such as upgrades, scaling, or partnerships
  • These factors could push TON toward higher price prediction targets

Risks That Skew Bearish for Price Prediction

  • Macro risk-off from tightening or liquidity shocks
  • Regulatory actions or infrastructure outages
  • Concentration in validator economics and competitive displacement
  • These factors could push TON toward lower price prediction scenarios

FAQs: Toncoin Price Prediction

How does TON accrue value?Value accrual mechanisms include transaction fees, validator staking rewards, and governance alignment described for TON in the documentation. As Toncoin usage grows through transactions and user activity, TON can capture network fees and staking yields while coordinating governance. Effectiveness depends on sustained adoption and network throughput, which directly impacts long-term price prediction models.

What price could TON reach in the moon case price prediction?Moon case price predictions range from $8.20 at 8T to $43.80 at 31T total crypto market cap. These price prediction scenarios require maximum market cap expansion and strong network adoption with robust liquidity conditions. Not financial advice.

What is the 2027 Toncoin price prediction?Based on Token Metrics analysis, the 2027 price prediction for Toncoin clusters between $5 and $14 in the base case, with potential for higher targets ($20-$43) in bullish scenarios if the total crypto market expands significantly.


Next Steps

Track live grades and signals: Token Details

Secure your TON with Ledger

Disclosure

Educational purposes only, not financial advice. Crypto is volatile, do your own research and manage risk.

How Token Metrics Can Help

Token Metrics combines fundamental, technical, and on-chain AI-powered analysis for actionable ratings, signals, and research. Use our data platform for scenario-based investing, backtested grades, and bespoke insights for digital asset markets.

Research

Cronos Price Prediction 2027: $0.10-$1.46 Target Analysis

Token Metrics Team
9 min read

Cronos Price Prediction: Portfolio Context for CRO in the 2027 Landscape

Layer 1 tokens like Cronos represent bets on specific blockchain architectures winning developer and user mindshare. CRO carries both systematic crypto risk and unsystematic risk from Cronos's technical roadmap execution and ecosystem growth. Multi-chain thesis suggests diversifying across several L1s rather than concentrating in one, since predicting which chains will dominate remains difficult.

The price prediction projections below show how CRO might perform under different market cap scenarios. While Cronos may have strong fundamentals, prudent portfolio construction balances L1 exposure across Ethereum, competing smart contract platforms, and Bitcoin to capture the sector without overexposure to any single chain's fate.

Disclosure

Educational purposes only, not financial advice. Crypto is volatile, do your own research and manage risk.

How to read this price prediction:

Each band blends cycle analogues and market-cap share math with TA guardrails. Base assumes steady adoption and neutral or positive macro. Moon layers in a liquidity boom. Bear assumes muted flows and tighter liquidity.

TM Agent baseline:

Token Metrics price prediction scenarios center roughly between $0.03 and $0.28, with a base case price target near $0.10, assuming steady ecosystem growth, continued cross-chain demand, and no major security incidents.

Live details: Token Details 

The Case for Diversified Index Exposure

Portfolio theory teaches that diversification is the only free lunch in investing. CRO concentration violates this principle by tying your crypto returns to one protocol's fate. Token Metrics Indices blend Cronos with the top one hundred tokens, providing broad exposure to crypto's growth while smoothing volatility through cross-asset diversification. This approach captures market-wide tailwinds without overweighting any single point of failure.

Systematic rebalancing within index strategies creates an additional return source that concentrated positions lack. As some tokens outperform and others lag, regular rebalancing mechanically sells winners and buys laggards, exploiting mean reversion and volatility. Single-token holders miss this rebalancing alpha and often watch concentrated gains evaporate during corrections while index strategies preserve more gains through automated profit-taking.

Beyond returns, diversified indices improve the investor experience by reducing emotional decision-making. Concentrated CRO positions subject you to severe drawdowns that trigger panic selling at bottoms. Indices smooth the ride through natural diversification, making it easier to maintain exposure through full market cycles.

Get early access

What Is Cronos?

Cronos is an EVM-compatible blockchain built to support decentralized applications with high throughput and low transaction costs. The network is designed to bridge the gap between crypto and traditional finance, offering interoperability with Ethereum and Cosmos ecosystems. Its focus on scalability and developer-friendly infrastructure aims to attract DeFi, NFT, and gaming projects.

CRO serves as the native utility token of the Cronos ecosystem, used for transaction fees, staking, and governance. It enables users to participate in network security, pay for smart contract execution, and access services within the Cronos DeFi ecosystem. Common usage patterns include staking for rewards, providing liquidity in DeFi protocols, and facilitating cross-chain transfers.

Key Takeaways for CRO Price Prediction

  • Scenario driven: price prediction outcomes hinge on total crypto market cap; higher liquidity and adoption lift the price targets
  • Single-asset concentration amplifies both upside and downside versus diversified approaches
  • Fundamentals: Fundamental Grade 72.71% (Community 55%, Tokenomics 60%, Exchange 100%, VC N/A, DeFi Scanner 83%)
  • Technology: Technology Grade 81.41% (Activity 64%, Repository 74%, Collaboration 82%, Security N/A, DeFi Scanner 83%)
  • TM Agent gist: Base price prediction near $0.10 amid steady growth
  • Education only, not financial advice

Cronos Price Prediction: Scenario Analysis

8T Market Cap Price Prediction:

At an 8 trillion dollar total crypto market cap, CRO price prediction projects to $0.14 in bear conditions, $0.29 in the base case, and $0.34 in bullish scenarios.

16T Market Cap Price Prediction:

Doubling the market to 16 trillion expands the price prediction range to $0.43 (bear), $0.57 (base), and $0.71 (moon).

23T Market Cap Price Prediction:

At 23 trillion, the price forecast scenarios show $0.62, $0.85, and $1.09 respectively.

31T Market Cap Price Prediction:

In the maximum liquidity scenario of 31 trillion, CRO price prediction could reach $0.81 (bear), $1.13 (base), or $1.46 (moon).


These price prediction ranges illustrate potential outcomes for concentrated CRO positions, but investors should weigh whether single-asset exposure matches their risk tolerance or whether diversified strategies better suit their objectives.

Fundamental and Technology Snapshot from Token Metrics

Fundamental Grade: 72.71% (Community 55%, Tokenomics 60%, Exchange 100%, VC N/A, DeFi Scanner 83%).


Technology Grade: 81.41% (Activity 64%, Repository 74%, Collaboration 82%, Security N/A, DeFi Scanner 83%).


Catalysts That Skew Bullish for Price Prediction

  • Institutional and retail access expands with ETFs, listings, and integrations
  • Macro tailwinds from lower real rates and improving liquidity
  • Product or roadmap milestones such as upgrades, scaling, or partnerships
  • These factors could push CRO toward higher price prediction targets

Risks That Skew Bearish for Price Prediction

  • Macro risk-off from tightening or liquidity shocks
  • Regulatory actions or infrastructure outages
  • Concentration in validator economics and competitive displacement
  • Protocol-specific execution risk and competitive pressure from alternatives
  • These factors could push CRO toward lower price prediction scenarios

FAQs: Cronos Price Prediction

Can CRO reach $1 according to price predictions?

Based on the price prediction scenarios, CRO could reach $1 in the 23T moon case where it projects to $1.09, and in the 31T scenarios where the base case is $1.13 and the moon case is $1.46. These price prediction outcomes require both broad market cap expansion and Cronos maintaining competitive position. Not financial advice.

What's the risk/reward profile for CRO price prediction?

Risk/reward in our price prediction model spans from $0.14 in the lowest bear case to $1.46 in the highest moon case. Downside risks include regulatory or infrastructure shocks and competitive displacement, while upside drivers include liquidity expansion and roadmap execution. Concentrated positions amplify both tails, while diversified strategies smooth outcomes.

What gives CRO value and impacts price predictions?

CRO accrues value through transaction fees, staking, and governance utility across the Cronos ecosystem. Demand drivers include DeFi activity, cross-chain usage, and network services. While these fundamentals matter for price predictions, diversified portfolios capture value accrual across multiple tokens rather than betting on one protocol's success.

What is the 2027 Cronos price prediction?

Based on Token Metrics analysis, the 2027 price prediction for Cronos centers around $0.10 in the base case, with potential for higher targets ($0.57-$1.13) in bullish scenarios if the total crypto market expands significantly. Moon case price predictions range up to $1.46 at maximum liquidity.

Next Steps

Disclosure
Educational purposes only, not financial advice. Crypto is volatile, concentration amplifies risk, and diversification is a fundamental principle of prudent portfolio construction. Do your own research and manage risk appropriately.

Research

Shiba Inu Price Prediction 2027: SHIB Forecast & Risk Warning

Token Metrics Team
6 min read

Shiba Inu Price Prediction: Understanding SHIB's Speculative Nature

Shiba Inu operates as a community-driven meme token where price action stems primarily from social sentiment, attention cycles, and speculative trading rather than fundamental value drivers. SHIB exhibits extreme volatility with no defensive characteristics or revenue-generating mechanisms typical of utility tokens. Token Metrics price prediction scenarios below provide technical price forecasts across different market cap environments, though meme tokens correlate more strongly with viral trends and community engagement than systematic market cap models. Positions in SHIB should be sized as high-risk speculative bets with potential for total loss.


Disclosure

Educational purposes only, not financial advice. Crypto is volatile, do your own research and manage risk.

How to read this price prediction:

Each band blends cycle analogues and market-cap share math with TA guardrails. Base assumes steady adoption and neutral or positive macro. Moon layers in a liquidity boom. Bear assumes muted flows and tighter liquidity. For meme tokens, actual price prediction outcomes depend heavily on social trends and community momentum beyond what market cap models capture.

TM Agent baseline:

Token Metrics TM Grade is 24.1%, Sell, with a bearish trading signal. The concise 12‑month numeric price prediction view centers between $0.000005 and $0.000035, with a base case price target near $0.000012.

TM Agent numeric view: scenarios center roughly between $0.000005 and $0.000035, with a base case near $0.000012.

Live details: Token Details 

Key Takeaways for SHIB Price Prediction

  • Highly speculative asset driven by sentiment and attention rather than fundamentals
  • Scenario driven: price prediction outcomes hinge on total crypto market cap and viral momentum
  • Extreme volatility characteristic - SHIB can experience double-digit percentage moves daily
  • TM Agent gist: Bearish short term, price prediction range $0.000005–$0.000035
  • Entertainment risk only, not financial advice

Shiba Inu Price Prediction: Scenario Analysis

Token Metrics price prediction scenarios provide technical price bands across market cap tiers:

8T Market Cap Price Prediction:

At 8 trillion total crypto market cap, SHIB price prediction projects to $0.041998 (bear), $0.042366 (base), and $0.042734 (moon).

16T Market Cap Price Prediction:

At 16 trillion total crypto market cap, SHIB price forecast projects to $0.043973 (bear), $0.045077 (base), and $0.046182 (moon).

23T Market Cap Price Prediction:

At 23 trillion total crypto market cap, SHIB price prediction projects to $0.045948 (bear), $0.047789 (base), and $0.049629 (moon).

  31T Market Cap Price Prediction:

At 31 trillion total crypto market cap, SHIB price prediction projects to $0.047923 (bear), $0.051050 (base), and $0.051307 (moon).

 These technical price prediction ranges assume meme tokens maintain market cap share proportional to overall crypto growth. Actual outcomes for speculative tokens typically exhibit higher variance and stronger correlation to social trends than these price prediction models predict.

What Is Shiba Inu?

Shiba Inu is a meme-born crypto project that centers on community and speculative culture. Unlike utility tokens with specific use cases, SHIB operates primarily as a speculative asset and community symbol. The project focuses on community engagement and entertainment value.

SHIB has demonstrated viral moments and community loyalty within the broader meme token category. The token trades on community sentiment and attention cycles more than fundamentals. Market performance depends heavily on social media attention and broader meme coin cycles.

Risks That Skew Bearish for Price Prediction

  • Extreme volatility from pure sentiment-driven price action with no fundamental support
  • Attention cycles shift rapidly, leaving early viral tokens abandoned as new memes emerge
  • Liquidity can evaporate quickly during downturns, creating severe slippage and exit difficulty
  • Regulatory scrutiny may target meme tokens as securities or gambling instruments
  • Macro risk-off environments hit speculative assets hardest, with meme coins showing largest drawdowns
  • Community fragmentation or developer abandonment can eliminate remaining narrative support
  • These factors could push SHIB price predictions toward the lower bear scenarios

Make Your Next Move with Token Metrics

Token Metrics provides technical analysis, scenario math, price prediction models, and rigorous risk evaluation for hundreds of crypto tokens. Want to dig deeper? Explore our powerful AI-powered ratings and scenario tools here.

FAQs: Shiba Inu Price Prediction

Will SHIB 10x from here according to price predictions?

At current price of $0.041027, a 10x reaches $0.41027. This level does not appear in any of the listed bear, base, or moon price prediction scenarios across 8T, 16T, 23T, or 31T tiers. Meme tokens can 10x rapidly during viral moments but can also lose 90%+ just as quickly. Position sizing for potential total loss is critical. Not financial advice.

What are the biggest risks to SHIB price predictions?

Primary risks include attention shifting to newer memes, community fragmentation, developer abandonment, regulatory crackdowns, and liquidity collapse during downturns. Unlike utility tokens with defensive characteristics, SHIB has zero fundamental floor. Price can approach zero if community interest disappears. Total loss is a realistic outcome that price prediction models cannot fully account for. Not financial advice.

What is the 2027 Shiba Inu price prediction?

Based on Token Metrics analysis, the 2027 price prediction for SHIB centers around $0.000012 in the base case under current market conditions. However, meme token price predictions are highly unreliable due to extreme dependence on social trends, viral cycles, and community sentiment that can change rapidly. These technical price prediction ranges should be viewed with extreme caution.

Can SHIB reach $0.01 according to price predictions?

Based on the price prediction scenarios across all market cap tiers (8T-31T), SHIB projections range from $0.041998 to $0.051307. While these technical price predictions show SHIB trading above $0.04, the extreme volatility and sentiment-driven nature of meme tokens means actual outcomes can vary dramatically from model projections. Not financial advice.


Next Steps

Track live data: Token Details

• Consider fundamental crypto assets with utility and defensive characteristics rather than pure speculation.

Disclosure

Educational purposes only, not financial advice. SHIB is a highly speculative asset with extreme volatility and high risk of total loss. Meme tokens operate as entertainment and gambling instruments rather than investments. Only allocate capital you can afford to lose entirely. Do your own research and manage risk appropriately.

Choose from Platinum, Gold, and Silver packages
Reach with 25–30% open rates and 0.5–1% CTR
Craft your own custom ad—from banners to tailored copy
Perfect for Crypto Exchanges, SaaS Tools, DeFi, and AI Products