Back to blog
Research

Slippage and Gas Fees Killing Your Returns? One-Trade Index Solution for 2025

Discover how slippage and gas fees impact crypto portfolio returns in 2025, and learn about an automated one-trade index solution designed for cost-efficient, diversified exposure.
Token Metrics Team
9 min read
Want Smarter Crypto Picks—Free?
See unbiased Token Metrics Ratings for BTC, ETH, and top alts.
Thank you! Your submission has been received!
Oops! Something went wrong while submitting the form.
 No credit card | 1-click unsubscribe

Every crypto trader understands the frustration of carefully calculating expected profits, executing trades, and then watching as slippage and gas fees quietly eat away at those returns. In 2025’s volatile crypto market, these hidden costs have become more than just a minor annoyance—they are systematically killing portfolio performance for both active traders and passive investors alike. This points to a deeper problem: the current crypto trading system is fundamentally flawed, with inefficiencies and complexities that undermine user confidence and adoption. If you manage a diversified crypto portfolio with dozens of tokens, chances are you’re bleeding value every time you rebalance or transfer funds. Understanding exactly how much these fees impact your profits is the first crucial step toward saving your portfolio from further losses.

The Hidden Tax on Crypto Portfolio Management

To fully grasp the challenge, it’s important to break down the real cost of building and maintaining a diversified crypto portfolio in today’s environment. Two major factors contribute to the erosion of your returns: slippage and gas fees.

Slippage occurs when the price at which your trade executes differs from the price you initially expected. This discrepancy is driven by factors such as market volatility, low liquidity, and order book depth. For smaller-cap altcoins within the top 100 tokens, slippage can easily reach 1-3% per trade. This means that even if you think you’re buying or selling at a certain price, the actual execution price might be worse, reducing your value and profits.

Gas fees are another critical cost to watch closely. Every on-chain transaction—whether swapping tokens on decentralized exchanges or transferring assets between wallets—requires payment of gas fees to miners or validators who confirm transactions on the blockchain. During periods of network congestion, especially on Ethereum and other popular chains, gas prices can spike dramatically. Gas fees are calculated based on current network activity and the complexity of each trade, so understanding this calculation helps traders anticipate costs and optimize their transactions. It’s not uncommon to pay $20 to $50 or more for a single transaction. These fees are not just occasional expenses; they add up quickly and can severely impact the profitability of frequent trades.

Network congestion and the choice of blockchain can also affect the speed at which transactions are confirmed, with slower speeds leading to delays and potentially higher costs during busy periods.

When you combine these two factors, the costs compound rapidly. Imagine managing a portfolio of 50 to 100 tokens and rebalancing monthly. Each rebalance involves dozens of trades, each incurring slippage and gas fees. This results in a significant drag on your overall portfolio performance.

For example, consider a trader managing a $50,000 portfolio spread across 100 tokens who decides to rebalance monthly. Assuming an average gas fee of $15 per swap and 1.5% average slippage, the cost of rebalancing just once would be approximately $1,500 in gas plus $750 lost to slippage—totaling $2,250, or 4.5% of the portfolio value, wiped out before any market movement occurs. Over a year of monthly rebalances, these costs can exceed 20% of the initial capital, enough to completely erase gains from even a modest bull market.

The Effects of Low Liquidity

Low liquidity is one of the most persistent challenges in the crypto trading world, and its impact on your portfolio can be both immediate and severe. When liquidity dries up—whether due to market volatility, volume spikes, or simply a lack of active traders—executing trades becomes riskier and more expensive. For traders dealing with large trades or those who set tight slippage tolerance, low liquidity can quickly turn a profitable strategy into a costly mistake.

In markets with low liquidity, even modest buy or sell orders can trigger significant price moves, causing the actual execution price to deviate sharply from what you expected. This slippage is especially pronounced on decentralized exchanges, where order books are often thin and a single large trade can move the market. For example, attempting to swap a sizable amount of a low-liquidity token can result in a short squeeze, where the price spikes rapidly, leaving you with fewer tokens for your dollar and eroding your profits.

The risks don’t stop at unfavorable prices. Low liquidity also increases the likelihood of failed transactions, particularly if you set a strict slippage protection limit. If the market can’t deliver your trade within your specified slippage tolerance, the transaction may fail entirely—forcing you to pay gas fees for a trade that never completes. In periods of network congestion, this problem is magnified: not only do you face higher gas prices as users compete to get their transactions confirmed, but the odds of failed or delayed trades rise as well.

To navigate these challenges, traders rely on a combination of tools and strategies. Monitoring volume indicators can help you gauge the current liquidity of a token or market, allowing you to adjust your trade size or slippage tolerance accordingly. Some participants opt to break up large trades into smaller transactions to minimize price impact, while others use slippage protection features to cap potential losses—though this can increase the risk of failed transactions and wasted gas fees.

Timing is also crucial. Trading during periods of lower network congestion—such as off-peak hours—can help you secure lower fees and faster transaction speeds. Additionally, choosing decentralized exchanges that leverage layer two solutions or alternative chains can further reduce costs and improve execution reliability.

Diversification remains a key defense against the risks of low liquidity. By spreading your portfolio across more liquid tokens and markets, you reduce your exposure to sudden price moves and failed trades. For instance, if you notice that a particular token’s volume has dropped, it may be wise to adjust your allocation or avoid trading it until conditions improve.

Consider the example of a trader attempting to execute a large swap on a thinly traded token. Without proper precautions, they might see the price move dramatically against them, or worse, have their transaction fail and still pay a hefty gas fee. By using slippage protection, monitoring liquidity, and timing trades to avoid network congestion, traders can save money, reduce risk, and protect their portfolio’s value.

In the fast-moving world of crypto, staying informed about liquidity conditions and adapting your trading strategies is essential. Whether you’re a seasoned trader or just starting out, keeping a close watch on gas fees, slippage, and market volume can help you avoid costly mistakes and manage your portfolio effectively—even when liquidity is scarce. By leveraging analytical tools and maintaining flexibility in your approach, you can navigate the challenges of low liquidity to support long-term portfolio objectives.

Token Metrics: Leading the Crypto Analytics Revolution

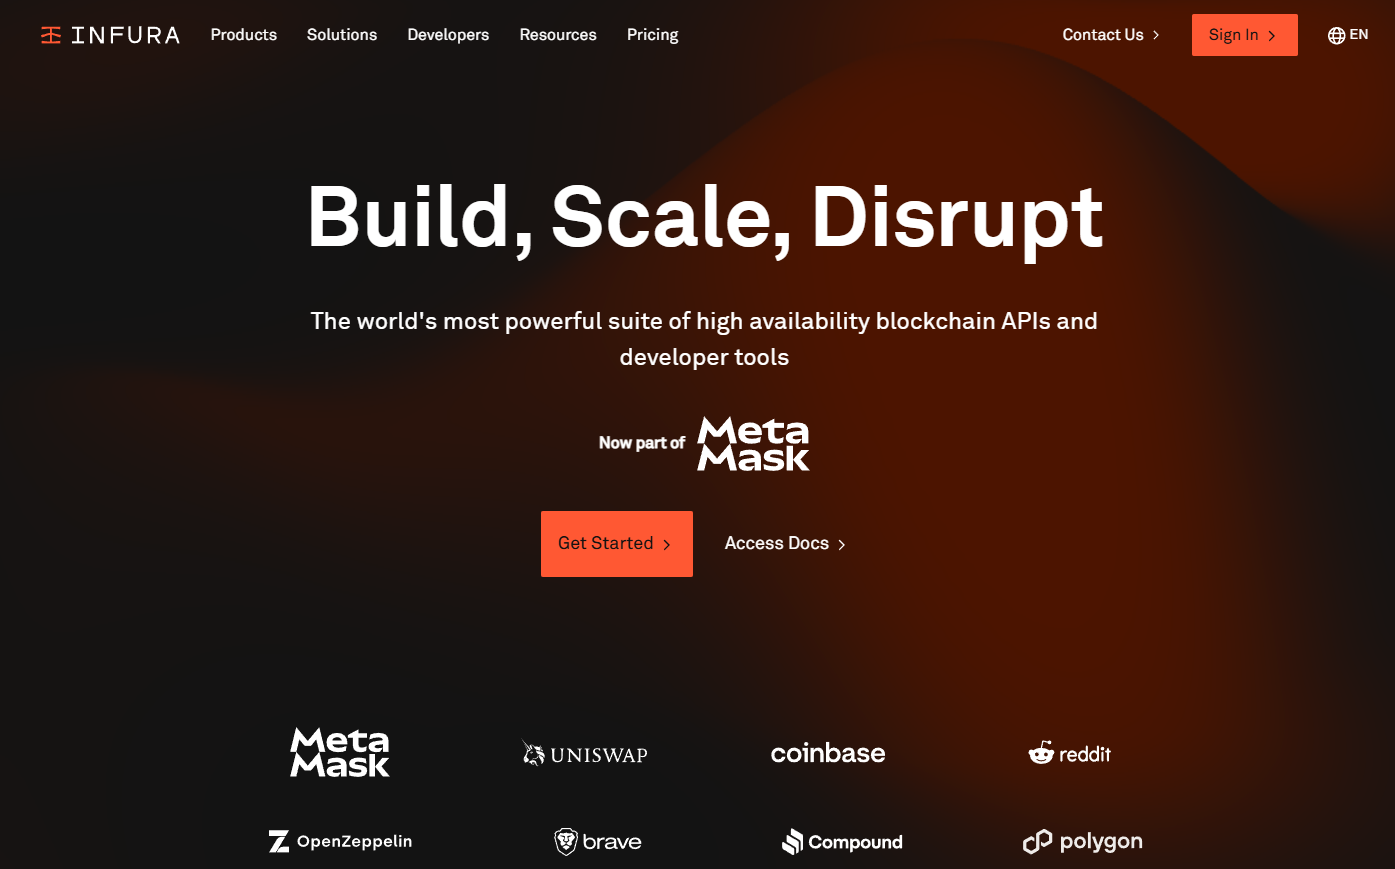
This is where Token Metrics steps in to change the game. As one of the leading crypto trading and analytics platforms in 2025, Token Metrics has built its reputation on delivering institutional-grade research, data-driven insights, and powerful tools tailored to both retail and professional traders. In addition to analytics, Token Metrics provides essential services that enable seamless data flow and value transfer across the crypto ecosystem.

Founded on the principle that cryptocurrency investing should be systematic, accessible, and intelligent, Token Metrics offers comprehensive analytics covering thousands of digital assets. The platform combines proprietary market signals, AI-powered ratings, and deep quantitative analysis with on-chain data and technical indicators. As an app, Token Metrics streamlines the crypto trading process for users. But beyond just research, Token Metrics recognized a crucial problem: even the best analysis can be undermined by poor trade execution, which slippage and gas fees exacerbate.

To address this, Token Metrics developed automated index solutions designed to help eliminate the execution tax that impacts portfolio returns. These tools allow users to save on fees, reduce risk, and improve overall portfolio efficiency by streamlining the trade process. By focusing on key trading strategies and metrics, Token Metrics helps users make informed decisions with robust supporting data.

Introducing the One-Trade Solution: TM Global 100

The TM Global 100 Index is Token Metrics’ innovative response to the slippage and gas fee crisis. By streamlining exposure to the top-100 crypto assets, the index helps mitigate risks that typically affect arbitrage strategies, such as slippage and execution delays, making it easier for participants to maintain portfolio consistency. Instead of executing dozens of individual trades to achieve broad market exposure, this rules-based index delivers a complete top-100 crypto portfolio through a single transaction.

Single-Transaction Execution

The key advantage of the TM Global 100 is that you only need to execute one trade to gain exposure to 100 tokens. This means paying one gas fee instead of dozens and experiencing minimal slippage on a single, larger transaction rather than accumulated slippage across many smaller trades. Since blockchain networks have limited space, executing a single transaction also helps avoid network congestion and keeps transaction costs lower, improving overall efficiency.

The math is compelling: one transaction versus 100 transactions represents a 99% reduction in gas fees alone. Even if the index rebalances weekly—which it does automatically—you pay no extra gas fees because all internal adjustments happen within the index structure.

Automated Weekly Rebalancing at Zero Cost

Traditional portfolio management requires constant monitoring, manual calculations, and repeated trades to maintain target allocations. The TM Global 100 automates this entire process, rebalancing weekly to reflect the current top-100 tokens by market capitalization. This means no need to watch 100 different tickers across multiple decentralized exchanges, no manual rebalance timing decisions, and no accumulated transaction costs from frequent adjustments.

This automated rebalancing flow ensures your portfolio stays aligned with market shifts without the need to sign off on every trade or pay additional fees. Automation also helps catch sudden market changes or potential issues early, supporting timely adjustments.

Regime-Switching Protection

Beyond cost savings, the TM Global 100 incorporates intelligent risk management through proprietary market signal detection. When market conditions shift from bullish to bearish, the index automatically moves holdings from the top-100 crypto assets into stablecoins, providing capital protection during downturns.

This regime-switching strategy means that during bull markets, you maintain full exposure to the broad upside of the crypto market, while during bear markets, your funds are preserved in stablecoins until positive signals emerge. This automatic adjustment helps avoid the need for panic selling or multiple transactions, and also supports recovery by positioning investors to re-enter the market at more favorable times, further reducing slippage, fees, and risk.

Real-World Impact: Cost Comparison

To illustrate the benefits, let’s compare the costs of two approaches to diversified crypto exposure:

  • DIY Portfolio Management (100 tokens, quarterly rebalancing):
    • Initial build: Approximately $1,500 in gas plus $750 in slippage, totaling $2,250
    • Quarterly rebalances: $2,250 × 4 = $9,000 annually
    • Regime switches (2 per year): $2,250 × 2 = $4,500
    • Total annual execution cost: Around $13,500
  • TM Global 100 Index:
    • Initial purchase: Single transaction with typical gas fee between $15 and $50
    • Weekly rebalances: Included at zero additional cost
    • Regime switches: Automatic and free of extra fees
    • Total annual execution cost: Approximately $50

The difference—more than $13,000 saved annually—directly impacts your portfolio’s performance. When comparing these options, the TM Global 100 approach offers significantly lower transaction costs and more predictable outcomes, allowing you to keep more of your assets working for you instead of spent on fees and slippage.

Getting Started: Join the Waitlist

The TM Global 100 Index launches with an embedded, self-custodial smart wallet, ensuring you have full control of your funds while accessing institutional-grade index investing. The purchase process is simple and takes about 90 seconds:

  1. Visit the Token Metrics Indices hub at tokenmetrics.com/indices
  2. Select TM Global 100 and tap Join Waitlist
  3. Connect your wallet to preview the one-click buy flow. Ensure your wallet can accept the token for a smooth transaction.
  4. Upon launch, receive a notification and execute your purchase. Double-check details such as wallet address and network before confirming.
  5. Track your portfolio performance in real time with transparent holdings, transaction logs, and profit & loss details.
  6. All fees—including estimated gas, platform fees, and maximum slippage—are displayed clearly before you confirm your transaction.

This transparency ensures no surprises or hidden costs, allowing for informed decision-making. Transactions may be blocked due to compliance or verification issues, such as incomplete information or regulatory requirements. If a transaction is pending and not confirmed, you may have the option to cancel it by paying a higher gas fee.

The Bottom Line

In 2025’s fast-moving and often congested crypto networks, execution costs are no longer a minor inconvenience—they are a significant consideration for portfolio management. Slippage and gas fees compound quickly when managing diversified portfolios, potentially impacting 20% or more of your capital annually.

Token Metrics’ TM Global 100 Index addresses this by offering single-transaction access to a complete top-100 portfolio, automated weekly rebalancing, and intelligent regime-switching—all while ensuring full transparency and self-custody. This innovative solution allows you to focus on portfolio growth rather than unnecessary execution costs or the effects of market volatility.

If you’re looking for a more efficient, cost-effective approach to self-managed crypto index investing, joining the TM Global 100 waitlist could be your next step. Explore early access to TM100 indices at Token Metrics.

Discover Crypto Gems with Token Metrics AI

Token Metrics uses AI-powered analysis to help you uncover profitable opportunities in the crypto market. Get Started For Free

FAQs

How do slippage and gas fees impact crypto returns?

Slippage and gas fees can significantly reduce portfolio returns, especially for traders managing diversified portfolios or rebalancing frequently. Each trade may execute at a less favorable price due to slippage, while gas fees accrue for every on-chain transaction. Over time, these costs can compound, eroding the profitability of even a well-performing portfolio.

What is the TM Global 100 Index?

The TM Global 100 Index is a rules-based crypto index offered by Token Metrics. It provides diversified exposure to the top-100 cryptocurrencies in a single transaction, automating rebalancing and implementing regime-switching strategies to help minimize costs and manage risk.

How does automated rebalancing save money?

Automated rebalancing eliminates the need for multiple manual trades, each incurring their own slippage and gas fees. By consolidating portfolio adjustments into a single, internal process, automated indices can reduce execution costs and keep portfolios aligned with market shifts more efficiently.

What is regime-switching and how does it work?

Regime-switching is a risk management feature in the TM Global 100 Index that adjusts portfolio allocations based on proprietary market signals. When bearish market conditions are detected, the index shifts assets into stablecoins to help preserve capital, re-entering the market when positive signals return.

How transparent are fees with Token Metrics' index solutions?

All estimated gas, platform fees, and slippage limits are displayed clearly before transactions are confirmed. This level of fee transparency ensures that users can make fully informed decisions and are never caught off guard by hidden costs.

What are the risks of using crypto index products?

As with all crypto investments, index products involve market risk, potential smart contract vulnerabilities, and regulatory considerations. Users should conduct due diligence and ensure they understand the associated risks before participating.

Disclaimer

This content is for informational and educational purposes only and does not constitute investment advice or an offer to buy or sell any financial instrument. Always conduct your own research and consult with a qualified financial advisor before making any investment decisions. Token Metrics does not guarantee the accuracy or completeness of information or assume any liability for loss or damage resulting from reliance on this content.

Build Smarter Crypto Apps &
AI Agents in Minutes, Not Months
Real-time prices, trading signals, and on-chain insights all from one powerful API.
Grab a Free API Key
About Token Metrics
Token Metrics: AI-powered crypto research and ratings platform. We help investors make smarter decisions with unbiased Token Metrics Ratings, on-chain analytics, and editor-curated “Top 10” guides. Our platform distills thousands of data points into clear scores, trends, and alerts you can act on.
30 Employees
analysts, data scientists, and crypto engineers
Daily Briefings
concise market insights and “Top Picks”
Transparent & Compliant
Sponsored ≠ Ratings; research remains independent
Want Smarter Crypto Picks—Free?
See unbiased Token Metrics Ratings for BTC, ETH, and top alts.
Thank you! Your submission has been received!
Oops! Something went wrong while submitting the form.
 No credit card | 1-click unsubscribe
Token Metrics Team
Token Metrics Team

Recent Posts

Research

Best Blockchain RPC Providers 2025: Comparison, Reviews, and How to Choose

Token Metrics Team
13 min read

TL;DR

Who this guide is for. Builders choosing a production-grade blockchain RPC for dapps, bots, wallets, analytics, rollups, or research.

Top three picks.

  • Alchemy — broad chain coverage, strong tooling, predictable CU pricing. (Alchemy)
  • Infura (Consensys) — deep Ethereum ecosystem integrations, enterprise SLAs, MetaMask/Linea alignment. (Infura)
  • QuickNode — performance at scale, rich products (Streams, rollups) for real-time apps. (QuickNode)

Key caveat. Pricing models differ (compute units vs requests vs credits). Check method-based costs, WebSocket bandwidth, and regional throughput before committing. (Alchemy)


Introduction

Choosing the best blockchain RPC providers in 2025 is a commercial-investigational decision: uptime, latency, method limits, and cost models impact everything from swaps and NFT mints to MEV-sensitive trading. An RPC provider is a service that exposes blockchain node methods over HTTPS/WebSocket so your app can read and write on-chain data reliably. The market now spans centralized platforms with SLAs and decentralized networks with distributed gateways. In this guide we compare leading vendors on performance, reliability, coverage, costs, developer experience, and support, then summarize where each one fits. We include a quick table, 10 concise reviews, and a buyer checklist to help you ship safely at lower total cost of ownership.


How We Picked (Methodology & Scoring)

We shortlisted ~20 credible providers, then scored the top 10 using verified claims on official pricing, docs, security/uptime disclosures, and status pages. Third-party datasets were used only for cross-checks.

Scoring Weights (sum = 100).

  • Liquidity/Performance (throughput/latency proxies) — 30%
  • Security/Reliability (SLA, status transparency) — 25%
  • Coverage (chains/testnets, archive, tracing) — 15%
  • Costs (free tier, PAYG, predictability) — 15%
  • UX/DX & Tooling (SDKs, dashboards, streams) — 10%
  • Support (docs, success, enterprise help) — 5%

Freshness. Last updated November 2025.


Notes: “Uptime SLA” reflects availability of SLAs or published uptime claims on official sites; check each plan’s SLA wording and region. Free-tier quotas and pricing change frequently.


Best RPC Providers in November 2025 (Comparison Table)


Top 10 RPC Providers in November 2025

1. Alchemy — Best for scale + tooling depth

Why Use It. Alchemy pairs broad chain coverage with predictable compute-unit pricing and strong developer tools (Enhanced APIs, Webhooks). The free tier is generous for prototyping, while PAYG scales smoothly to production. (Alchemy)

Best For. High-growth dapps; analytics/bots that need webhooks; multi-chain teams; enterprises.
Notable Features. Enhanced APIs • Webhooks/WS subscriptions • CU-based billing • Status & enterprise support. (Alchemy)
Consider If. You prefer request-based flat pricing over CU accounting.
Fees Notes. Free 30M CU/mo; PAYG from low monthly minimums; bandwidth pricing for WS/webhooks. (Alchemy)
Regions. Global (plan-specific SLAs).
Alternatives. Infura • QuickNode.  


2. Infura (by Consensys) — Best for Ethereum-aligned stacks

Why Use It. Infura integrates tightly with the Consensys ecosystem (MetaMask, Linea) and offers enterprise SLAs and higher throughput via Team/Enterprise plans. (Infura)
Best For. ETH/L2-first products • Teams needing MetaMask/Linea ties • Enterprises.
Notable Features. Credit-based plans • MetaMask SDK access • IPFS APIs • 24/7 support (Enterprise). (Infura)
Consider If. You need explicit per-method cost predictability rather than credits.
Fees Notes. Free, Developer, Team, Enterprise with credits/day and throughput caps. (Infura)
Regions. Global; check plan terms.
Alternatives. Alchemy • Chainstack.  


3. QuickNode — Best for high-performance real-time apps

Why Use It. QuickNode emphasizes speed, global scale, and a growing product suite (Streams for real-time, rollup deployment). It’s a strong fit for trading, gaming, and high-throughput use. (QuickNode)
Best For. Low-latency dapps • Real-time event processing • Rollup pilots.
Notable Features. Streams • Core RPC • Rollup deploy • Robust docs/support. (QuickNode)
Consider If. You require granular per-request pricing transparency across chains.
Fees Notes. Free tier; tiered and enterprise pricing available. (QuickNode)
Regions. Global; enterprise SLAs.
Alternatives. Alchemy • Blast.  


4. Chainstack — Best for flat RPS pricing + predictable bills

Why Use It. Chainstack’s flat monthly, RPS-based model makes costs predictable, with “Global Nodes” and managed infra across many chains. Good for teams who hate surprise overage bills. (Chainstack)
Best For. Multi-env teams • Stable traffic • Dedicated nodes.
Notable Features. Global Nodes • Flat RPS tiers • Dedicated options • Clear storage terms. (Chainstack)
Consider If. You need bursty, PAYG-style pricing without a fixed RPS tier.
Fees Notes. Flat monthly by RPS tier; free plan available. (Chainstack)
Regions. Global.
Alternatives. GetBlock • QuickNode.


5. Ankr — Best for breadth + per-method pricing

Why Use It. Ankr covers 75+ blockchains with transparent API-credit pricing and both HTTPS and WebSocket access, plus advanced APIs and gRPC. Strong for wide chain exposure. (Ankr)
Best For. Multi-chain explorers • Bots/analytics • Cost-aware teams.
Notable Features. RPC/REST/gRPC • Advanced API • Dynamic regions • WSS. (Ankr)
Consider If. You’d rather pay flat per-request than API-credits by method class.
Fees Notes. Free tier; per-method API credits (e.g., EVM 200 credits ≈ $0.00002). (Ankr)
Regions. Global (plan caps/regions vary).
Alternatives. NodeReal • dRPC.


6. Blast API (Bware Labs) — Best for performance + indexing add-ons

Why Use It. Blast focuses on low-latency, high-performance RPC with SDKs and indexing services. Pricing is simple (Free, $50 Dev, $250 Startup, plus PAYG), making it easy to get started. (blastapi.io)
Best For. Web3 apps needing speed • Teams wanting an SDK + RPC bundle.
Notable Features. Indexing • SDKs • Public APIs • Faucets • High-perf infra. (bwarelabs.com)
Consider If. You need explicit enterprise SLA details and multi-region controls.
Fees Notes. Free and fixed monthly tiers, plus PAYG. (blastapi.io)
Regions. Global.
Alternatives. QuickNode • Alchemy.


7. GetBlock — Best for quick multi-protocol access + dedicated nodes

Why Use It. GetBlock provides access to 50+ protocols with JSON-RPC, REST, WebSocket, GraphQL, plus dedicated node options and a clean monitoring dashboard. (GetBlock.io)
Best For. Startups needing fast setup • Projects requiring dedicated nodes.
Notable Features. 50+ chains • Dedicated nodes • Stats/monitoring • WS/GraphQL. (GetBlock.io)
Consider If. You require strict enterprise SLA language across all regions.
Fees Notes. Free tier (CU/RPS caps) and paid tiers; dedicated pricing. (GetBlock.io)
Regions. Global.
Alternatives. Chainstack • Ankr.


8. Lava Network — Best free public RPC + gateway into a decentralized network

Why Use It. Lava offers free public RPC endpoints across popular chains and a Gateway product for managed scale, routing traffic to fast/reliable providers via a protocol. Good for testing and early growth. (lavanet.xyz)
Best For. Hackathons • MVPs • Teams exploring decentralized routing.
Notable Features. Public RPC • Gateway • Protocol routing • Multi-chain. (lavanet.xyz)
Consider If. You need contracted SLAs or guaranteed dedicated capacity.
Fees Notes. Free public endpoints; pay as you scale via Gateway. (lavanet.xyz)
Regions. Global.
Alternatives. dRPC • Ankr.


9. dRPC — Best for flat, transparent request pricing

Why Use It. dRPC operates a distributed RPC with flat-rate PAYG (publicly promoted ~$6 per 1M requests) and free/basic access, plus WebSocket and enterprise options. Attractive for predictable budgets. (drpc.org)
Best For. Cost-sensitive teams • Multi-provider routing • Privacy-minded users.
Notable Features. Distributed endpoints • PAYG • WS • Monitoring. (drpc.org)
Consider If. You need named, contractual SLAs per region.
Fees Notes. Free plan and PAYG; flat pricing guidance published by dRPC. (drpc.org)
Regions. Global.
Alternatives. BlockPI • NodeReal.


10. NodeReal MegaNode — Best for BNB Chain + EVM throughput

Why Use It. NodeReal specializes in EVM (notably BNB Chain) with an accessible free plan, MEV-protected RPC, and published performance/uptime visuals (e.g., 99.8% uptime claim). (nodereal.io)
Best For. EVM-heavy apps • BSC-first projects • Throughput-hungry bots.
Notable Features. MEV-protected RPC • Free plan • Global infra • Builder tools. (nodereal.io)
Consider If. You require multi-ecosystem parity beyond EVM.
Fees Notes. Free plan with paid Growth/Team/Business tiers. (nodereal.io)
Regions. Global.
Alternatives. Ankr • QuickNode.


Decision Guide: Best By Use Case

  • Regulated U.S. enterprise & SLAs: Infura, Alchemy. (Infura)
  • Solana/EVM real-time streams: QuickNode (Streams), Alchemy (Webhooks/WS). (QuickNode)
  • Flat pricing & predictable bills: Chainstack (RPS tiers), dRPC (flat PAYG). (Chainstack)
  • Indexing + SDK bundle: Blast (Bware Labs). (bwarelabs.com)
  • Free public RPC for testing: Lava (Public RPC), Ankr public endpoints. (lavanet.xyz)
  • EVM/BSC throughput: NodeReal, Ankr. (nodereal.io)
  • Dedicated nodes with dashboard: GetBlock, Chainstack. (GetBlock.io)

How to Choose the Right RPC Provider (Checklist)

  • Region eligibility and data residency match your users.
  • Chains/methods you need (archive, traces, eth_getLogs) are supported.
  • WebSocket/streaming limits and bandwidth pricing are transparent. (Alchemy)
  • SLA language and status transparency meet your risk profile.
  • Pricing model fits traffic (CU vs credits vs requests vs RPS tiers). (Alchemy)
  • Docs, SDKs, and dashboards are robust for your stack.
  • Quotas, rate limits, and burst capacity are clear.
  • Support path (tickets/Slack/CSM) matches team needs.
  • Security posture: auth keys, IP allowlists, WAF, MEV/FRP options.
  • Red flags: vague pricing, no status page, no limits disclosed.

Use Token Metrics With Any RPC

  • AI Ratings to screen assets by quality, momentum, and fundamentals.
  • Narrative Detection to spot early theme shifts across chains.


  • Portfolio Optimization to balance risk across L1s/L2s.
  • Alerts & Signals to time entries/exits.


Workflow: Research with Token Metrics → Choose RPC → Ship → Monitor with alerts.

Start free trial to screen assets and time entries with AI.  


Security & Compliance Tips

  • Prefer provider domains you verify manually; bookmark dashboards and docs.
  • Use separate API keys per environment; rotate keys and restrict by IP/refs.
  • Monitor quotas and errors; set alerts for rate-limit responses and spikes.
  • Validate responses across providers for critical paths (e.g., price-sensitive flows).
  • For WS/streams, budget for bandwidth-based pricing if applicable. (Alchemy)
  • Document SLAs, maintenance windows, and incident comms in your runbooks.
  • Keep a backup provider and failover logic for production.

This article is for research/education, not financial advice.


Beginner Mistakes to Avoid

  • Relying on free public endpoints in production.
  • Ignoring method-level pricing (traces, logs, subscriptions). (Alchemy)
  • Skipping WebSocket bandwidth budgeting for event-heavy apps. (Alchemy)
  • Not testing region latency; users in APAC/EU may see higher p95 without multi-region.
  • Hard-coding a single vendor with no fallback.
  • Forgetting archive/pruned node differences for historical reads.

FAQs

What is a blockchain RPC provider?
 A service that exposes node methods over HTTPS/WS so apps can read/write blockchain data without running their own nodes.

Are free RPC endpoints safe for production?
 They’re fine for testing and small projects, but production needs capacity guarantees, SLAs, and support—typically paid tiers.

How do pricing models differ?
 Vendors use compute units (Alchemy), credits (Infura/Ankr), per-request flat rates (dRPC), or RPS tiers (Chainstack). Map your method mix to each model before choosing. (Alchemy)

Do these providers support WebSockets?
 Yes, most offer WS or streaming. Check per-chain WS limits and bandwidth pricing. (QuickNode)

Which is best for multi-chain coverage?
 Alchemy, QuickNode, Chainstack, Ankr, and GetBlock all offer broad lists; verify specific chains and testnets you need. (Alchemy)


If you want maximum tooling and predictable scaling, start with Alchemy or QuickNode. For Ethereum-aligned stacks and enterprise support, Infura stands out. If you value cost predictability, Chainstack (RPS tiers) or dRPC (flat PAYG) are compelling. Keep Ankr, GetBlock, Blast, Lava, and NodeReal in your shortlist for specific feature/cost needs.

Related Reads:

Research

AAVE Price Prediction 2027: $70-$2,175 Forecast Analysis

Token Metrics Team
9 min read

AAVE Price Prediction 2027: Market Analysis and Scenario-Based Forecasts

Market Context for Aave Price Prediction: The Case for 2027

DeFi protocols are maturing beyond early ponzi dynamics toward sustainable revenue models. Aave operates in this evolving landscape where real yield and proven product-market fit increasingly drive valuations rather than speculation alone. Growing regulatory pressure on centralized platforms creates tailwinds for decentralized alternatives—factors that inform our comprehensive AAVE price prediction framework.

The scenario bands below reflect how AAVE price predictions might perform across different total crypto market cap environments. Each tier represents a distinct liquidity regime, from bear conditions with muted DeFi activity to moon scenarios where decentralized infrastructure captures significant value from traditional finance.


Disclosure

Educational purposes only, not financial advice. Crypto is volatile, do your own research and manage risk.

How to Read This AAVE Price Prediction

Each band blends cycle analogues and market-cap share math with TA guardrails. Base assumes steady adoption and neutral or positive macro. Moon layers in a liquidity boom. Bear assumes muted flows and tighter liquidity.

TM Agent baseline: Token Metrics TM Grade is 72, Buy, and the trading signal is bullish, indicating solid protocol fundamentals, healthy developer activity, and positive near-term momentum. Concise twelve-month numeric view, Token Metrics price prediction scenarios cluster roughly between $70 and $320, with a base case near $150, reflecting continued growth in lending TVL, fee revenue capture by the protocol, and modest macro tailwinds.

Live details: Aave Token Details

Affiliate Disclosure: We may earn a commission from qualifying purchases made via this link, at no extra cost to you.

Key Takeaways

  • Scenario driven, outcomes hinge on total crypto market cap, higher liquidity and adoption lift the bands.
  • Fundamentals: Fundamental Grade 75.51% (Community 77%, Tokenomics 100%, Exchange 100%, VC 49%, DeFi Scanner 70%).
  • Technology: Technology Grade 83.17% (Activity 75%, Repository 68%, Collaboration 92%, Security 78%, DeFi Scanner 70%).
  • TM Agent gist: scenarios cluster between $70 and $320 with base near $150, assuming steady lending TVL growth and neutral macro conditions.
  • Education only, not financial advice.

AAVE Price Prediction Scenario Analysis

Our Token Metrics price prediction framework spans four market cap tiers, each representing different levels of crypto market maturity and liquidity:

8T Market Cap - AAVE Price Prediction:

At an 8 trillion dollar total crypto market cap, AAVE projects to $293.45 in bear conditions, $396.69 in the base case, and $499.94 in bullish scenarios.

16T Market Cap - AAVE Price Prediction:

Doubling the market to 16 trillion expands the price prediction range to $427.46 (bear), $732.18 (base), and $1,041.91 (moon).

23T Market Cap - AAVE Price Prediction:

At 23 trillion, the price prediction scenarios show $551.46, $1,007.67, and $1,583.86 respectively.

31T Market Cap - AAVE Price Prediction:

In the maximum liquidity scenario of 31 trillion, AAVE price predictions could reach $680.47 (bear), $1,403.16 (base), or $2,175.85 (moon).

Each tier assumes progressively stronger market conditions, with the base case price prediction reflecting steady growth and the moon case requiring sustained bull market dynamics.

Why Consider the Indices with Top-100 Exposure

Aave represents one opportunity among hundreds in crypto markets. Token Metrics Indices bundle AAVE with top one hundred assets for systematic exposure to the strongest projects. Single tokens face idiosyncratic risks that diversified baskets mitigate.

Historical index performance demonstrates the value of systematic diversification versus concentrated positions.

Join the early access list

What Is Aave?

Aave is a decentralized lending protocol that operates across multiple EVM-compatible chains including Ethereum, Polygon, Arbitrum, and Optimism. The network enables users to supply crypto assets as collateral and borrow against them in an over-collateralized manner, with interest rates dynamically adjusted based on utilization.

The AAVE token serves as both a governance asset and a backstop for the protocol through the Safety Module, where stakers earn rewards in exchange for assuming shortfall risk. Primary utilities include voting on protocol upgrades, fee switches, collateral parameters, and new market deployments.

Token Metrics AI Analysis

Token Metrics AI provides comprehensive context on Aave's positioning and challenges.

Vision: Aave aims to create an open, accessible, and non-custodial financial system where users have full control over their assets. Its vision centers on decentralizing credit markets and enabling seamless, trustless lending and borrowing across blockchain networks.

Problem: Traditional financial systems often exclude users due to geographic, economic, or institutional barriers. Even in crypto, accessing credit or earning yield on idle assets can be complex, slow, or require centralized intermediaries. Aave addresses the need for transparent, permissionless, and efficient lending and borrowing markets in the digital asset space.

Solution: Aave uses a decentralized protocol where users supply assets to liquidity pools and earn interest, while borrowers can draw from these pools by posting collateral. It supports features like variable and stable interest rates, flash loans, and cross-chain functionality through its Layer 2 and multi-chain deployments. The AAVE token is used for governance and as a safety mechanism via its staking program (Safety Module).

Market Analysis: Aave is a leading player in the DeFi lending sector, often compared with protocols like Compound and Maker. It benefits from strong brand recognition, a mature codebase, and ongoing innovation such as Aave Arc for institutional pools and cross-chain expansion. Adoption is driven by liquidity, developer activity, and integration with other DeFi platforms. Key risks include competition from newer lending protocols, regulatory scrutiny on DeFi, and smart contract risks. As a top DeFi project, Aave's performance reflects broader trends in decentralized finance, including yield demand, network security, and user trust. Its multi-chain strategy helps maintain relevance amid shifting ecosystem dynamics.

Fundamental and Technology Snapshot from Token Metrics

Fundamental Grade: 75.51% (Community 77%, Tokenomics 100%, Exchange 100%, VC 49%, DeFi Scanner 70%).


Technology Grade: 83.17% (Activity 75%, Repository 68%, Collaboration 92%, Security 78%, DeFi Scanner 70%).

Catalysts That Skew AAVE Price Predictions Bullish

  • Institutional and retail access expands with ETFs, listings, and integrations
  • Macro tailwinds from lower real rates and improving liquidity
  • Product or roadmap milestones such as upgrades, scaling, or partnerships

Risks That Skew AAVE Price Predictions Bearish

  • Macro risk-off from tightening or liquidity shocks
  • Regulatory actions or infrastructure outages
  • Concentration or competitive displacement in lending

AAVE Price Prediction FAQs

Can AAVE reach $1,000?

Yes. Based on our price prediction scenarios, AAVE could reach $1,007.67 in the 23T base case and $1,041.91 in the 16T moon case. Not financial advice.

Can AAVE 10x from current levels?

At current price of $228.16, a 10x would reach $2,281.60. This falls within the 31T moon case price prediction at $2,175.85 (only slightly below), and would require extreme liquidity expansion. Not financial advice.

What price could AAVE reach in the moon case?

Our moon case price predictions range from $499.94 at 8T to $2,175.85 at 31T. These scenarios assume maximum liquidity expansion and strong Aave adoption. Not financial advice.

What is the AAVE price prediction for 2027?

Our comprehensive 2027 price prediction framework suggests AAVE could trade between $293.45 and $2,175.85, depending on market conditions and total crypto market capitalization. The base case scenario clusters around $396.69 to $1,403.16 across different market cap environments. Not financial advice.

Is AAVE a good investment based on price predictions?

AAVE shows strong fundamentals (75.51% grade) and technology scores (83.17% grade), with bullish trading signals. However, all price predictions involve uncertainty and risk. Always conduct your own research and consult financial advisors before investing. Not financial advice.


Next Steps

Track live grades and signals: Token Details 

Join Indices Early Access

Want exposure? Buy AAVE on MEXC 

Disclosure

Educational purposes only, not financial advice. Crypto is volatile, do your own research and manage risk.

Why Use Token Metrics?

  • AI-driven crypto and DeFi grades for risk management and alpha discovery.
  • Quantitative, on-chain signals and robust scenario modeling for tokens like AAVE.
  • Access in-depth research reports, analyst perspectives, auto-grades, and portfolio tools from Token Metrics.
Research

x402 & HTTP 402 Explained: Why Wallet-Paid API Calls Are Winning (and Where Token Metrics Fits)

Token Metrics Team
10 min read

What Is x402?

x402 is an open-source, HTTP-native payment protocol developed by Coinbase that enables pay-per-call API access using crypto wallets. It leverages the HTTP 402 Payment Required status code to create seamless, keyless API payments.

It eliminates traditional API keys and subscriptions, allowing agents and applications to pay for exactly what they use in real time. It works across Base and Solana with USDC and selected native tokens such as TMAI.

Start using Token Metrics X402 integration here. https://www.x402scan.com/server/244415a1-d172-4867-ac30-6af563fd4d25 

TLDR — The x402 Value Proposition

x402 transforms API access by making payments native to HTTP requests.

Feature

Traditional APIs

x402 APIs

Authentication

API keys, tokens

Wallet signature

Payment Model

Subscription, prepaid

Pay-per-call

Onboarding

Sign up, KYC, billing

Connect wallet

Rate Limits

Fixed tiers

Economic (pay more = more access)

Commitment

Monthly/annual

Zero, per-call only

How to use it: Add x-coinbase-402: true header to any supported endpoint. Sign payment with your wallet. The API responds immediately after confirming micro-payment.

Token Metrics integration: All public endpoints available via x402 with per-call pricing from $0.017 to $0.068 USDC (10% discount with TMAI token).

Explore live agents: https://www.x402scan.com/composer.

How HTTP 402 Payment Required Works — Technical Deep Dive

The Protocol Flow

The HTTP 402 status code was reserved in HTTP/1.1 in 1997 for future digital payment use cases and was never standardized for any specific payment scheme. x402 activates this path by using 402 responses to coordinate crypto payments during API requests.

  1. Step by step: Client makes an API request with the header x-coinbase-402: true.
  2. The server can return 402 with payment details such as amount, recipient, and chain.
  3. The client wallet signs and submits the payment transaction.
  4. The server verifies the payment on-chain, then processes the original request and returns 200 with data.

Why this matters: It eliminates intermediary payment processors, enables true machine-to-machine commerce, and reduces friction for AI agents.

Ecosystem Proof: x402 Is Winning — Three Validation Points

CoinGecko Recognition

CoinGecko launched a dedicated x402 Ecosystem category in October 2025, tracking 700+ projects with over $1 billion market cap and approximately $213 million in daily trading volume. Top performers include PING and Alnalyst, along with established projects like EigenCloud.


Base Network Adoption

Base has emerged as the primary chain for x402 adoption, with 450,000+ weekly transactions by late October 2025, up from near-zero in May. This growth demonstrates real agent and developer usage.

x402scan Composer — Where Agents Pay in Real Time

Composer is x402scan's sandbox for discovering and using AI agents that pay per tool call. Users can open any agent, chat with it, and watch tool calls and payments stream in real time.

Top agents include AInalyst, Canza, SOSA, and NewEra. The Composer feed shows live activity across all agents.


Explore Composer: https://x402scan.com/composer 

Token Metrics x402 Integration — Concrete Implementation

What We Ship

Token Metrics offers all public API endpoints via x402 with no API key required. Pay per call with USDC or TMAI for a 10 percent discount. Access includes trading signals, price predictions, fundamental grades, technology scores, indices data, and the AI chatbot.

Check out Token Metrics Integration on X402. https://www.x402scan.com/server/244415a1-d172-4867-ac30-6af563fd4d25 


Data as of October, 2025.

Pricing Tiers


Important note: TMAI Spend Limit: TMAI has 18 decimals. Set max payment to avoid overspending. Example: 200 TMAI = 200 * (10 ** 18) in base units.

Full integration guide: https://api.tokenmetrics.com 

Why x402 Changes Everything for AI Agents

  • Eliminates onboarding friction. Agents can discover and use new APIs instantly without human intervention for API key management or billing setup.
  • Enables true agentic commerce. Agents pay for exactly what they use, which makes micro-transactions economically viable. This unlocks composition of multiple specialized services.
  • Aligns incentives. API providers get paid per call, users only pay for value received, and agents can optimize costs by choosing best-fit providers. Network effects accelerate as more endpoints adopt x402.

Use Cases Already Working

  • Crypto analytics agents: Pull Token Metrics data on demand to answer market questions, generate trade signals, or build custom dashboards.
  • Research automation: Chain together x402 endpoints like Twitter search, Tavily extract, Firecrawl, and Token Metrics to gather and structure data.
  • Portfolio management: Agents monitor positions, fetch real-time prices, calculate risk metrics, and execute rebalancing decisions using paid data sources.
  • Trading strategy backtests: Access historical OHLCV, grades, and signals data via x402 without committing to monthly subscriptions.
  • Multi-chain intelligence: Combine Base and Solana x402 services for cross-chain analysis and arbitrage discovery.

Ecosystem Participants and Tools

Active x402 Endpoints

Key endpoints beyond Token Metrics include Heurist Mesh for crypto intelligence, Tavily extract for structured web content, Firecrawl search for SERP and scraping, Twitter or X search for social discovery, and various DeFi and market data providers.

Infrastructure and Tools

  • x402scan: Explorer and analytics platform tracking all x402 activity across chains.
  • Composer: Hosted sandbox for discovering and using x402-enabled agents.
  • x402-axios and x402-httpx: Client libraries for Node.js and Python.
  • Coinbase Agent Kit: SDK integration for building x402-native agents.
  • LangChain connectors: Framework integration for agent workflows.

Common Questions About x402

How is x402 different from traditional API keys?

x402 uses wallet signatures instead of API keys. Payment happens per call rather than via subscription. No sign-up, no monthly billing, no rate limit tiers. You pay for exactly what you use.

Which chains support x402?

Currently Base and Solana. Most activity is on Base with USDC as the primary payment token. Some endpoints accept native tokens like TMAI for discounts.

Do I need to trust the API provider with my funds?

No. Payments are on-chain and verifiable. You approve each transaction amount. No escrow or prepayment is required.

What happens if a payment fails?

The API returns 402 Payment Required again with updated payment details. Your client retries automatically. You do not receive data until payment confirms.

Can I use x402 with existing API clients?

Yes, with x402 client libraries such as x402-axios for Node and x402-httpx for Python. These wrap standard HTTP clients and handle the payment flow automatically.

Getting Started Checklist

  1. Set up a wallet: Create a Base wallet with USDC or TMAI balance.
  2. Install x402 client: npm install x402-axios or pip install x402-httpx.
  3. Choose an endpoint: Browse x402scan or Composer for available APIs.
  4. Write minimal code: Add x-coinbase-402: true header to requests.
  5. Watch payments flow: Monitor transactions in your wallet and on x402scan feed.
  6. Optimize costs: Compare endpoint pricing, use TMAI for 10% discount, cache results when appropriate.

Token Metrics x402 Resources

What's Next for x402

Ecosystem expansion. More API providers adopting x402, additional chains beyond Base and Solana, standardization of payment headers and response formats.

Agent sophistication. As x402 matures, expect agents that automatically discover and compose multiple paid endpoints, optimize costs across providers, and negotiate better rates for bulk usage.

Disclosure

Educational content only, not financial advice. API usage and crypto payments carry risks. Verify all transactions before signing. Do your own research.

Frequently Asked Questions

Choose from Platinum, Gold, and Silver packages
Reach with 25–30% open rates and 0.5–1% CTR
Craft your own custom ad—from banners to tailored copy
Perfect for Crypto Exchanges, SaaS Tools, DeFi, and AI Products