Back to blog
Research

The Death of "Buy and Hold": Why Crypto Has Become a Trader's Market in 2025

The transformation of crypto from a fundamentals-driven market to an attention-based trading ecosystem represents a natural evolution as the space matures. While this shift has created challenges for traditional investors, it has also opened new opportunities for those willing to adapt their strategies.
Token Metrics Team
7 min
Want Smarter Crypto Picks—Free?
See unbiased Token Metrics Ratings for BTC, ETH, and top alts.
Thank you! Your submission has been received!
Oops! Something went wrong while submitting the form.
 No credit card | 1-click unsubscribe

The cryptocurrency landscape has fundamentally shifted, and traditional investment strategies are failing investors across the board. If you're wondering why your altcoin portfolio is down 95% despite solid fundamentals, you're not alone—and there's a critical reason behind this market transformation.

The New Reality: Attention Economy Over Fundamentals

According to recent market analysis from Token Metrics, we've entered what experts are calling a "trader's market." The old premise of buying based on technology and fundamentals has essentially expired this cycle. Instead, crypto has evolved into an attention economy focused on trading narratives rather than long-term value accumulation.

"The old strategy of buying and holding fundamental assets like in past cycles and expecting them to do well—that ship has sailed," explains Ian Balina, highlighting a harsh reality many investors are facing.

Why Traditional Strategies Are Failing

The core issue lies in market saturation. Today's crypto market features 100 to 1,000 times more tokens competing for the same amount of trading volume as previous cycles. This massive increase in competition has fundamentally altered market dynamics, making it nearly impossible for individual projects to maintain sustained growth through fundamentals alone.

Key factors driving this shift include:

  • Overwhelming token supply: New projects launch daily, diluting attention and capital
  • Shortened attention spans: Investors jump between narratives quickly
  • Professional trading dominance: Algorithmic and institutional trading has increased market efficiency
  • Narrative-driven cycles: Success depends more on timing and story than underlying technology

The Altcoin Season Indicator: Your Market Timing Tool

One crucial metric investors should monitor is the Bitcoin versus Altcoin Season indicator. Currently sitting at 58%, this metric suggests that nearly 60% of returns are flowing into altcoins rather than Bitcoin.

Historically, when this indicator crosses 57%, it signals an ideal time to start trimming altcoin profits. The danger zone begins at 60% and above—previous cycle tops have seen this metric reach 80-88%, marking optimal exit points.

"This is literally a leading indicator historically on when to sell the top," notes the analysis, pointing to data from 2021 and 2022 cycle peaks.

Treasury Company Revolution: The New Institutional Wave

Despite challenges in traditional crypto investing, institutional adoption continues accelerating through treasury companies. MicroStrategy leads with $70 billion in Bitcoin holdings, including $23 billion in unrealized gains. BitMine recently purchased $2.2 billion worth of Ethereum, targeting 5% of ETH's total supply.

This institutional wave extends beyond Bitcoin and Ethereum:

  • Solana: Multiple companies are raising billions for SOL-focused treasury strategies
  • BNB: B Strategy launched a $1 billion vehicle backed by Binance's founder
  • Multi-asset approaches: Diversified treasury companies are emerging across major cryptocurrencies

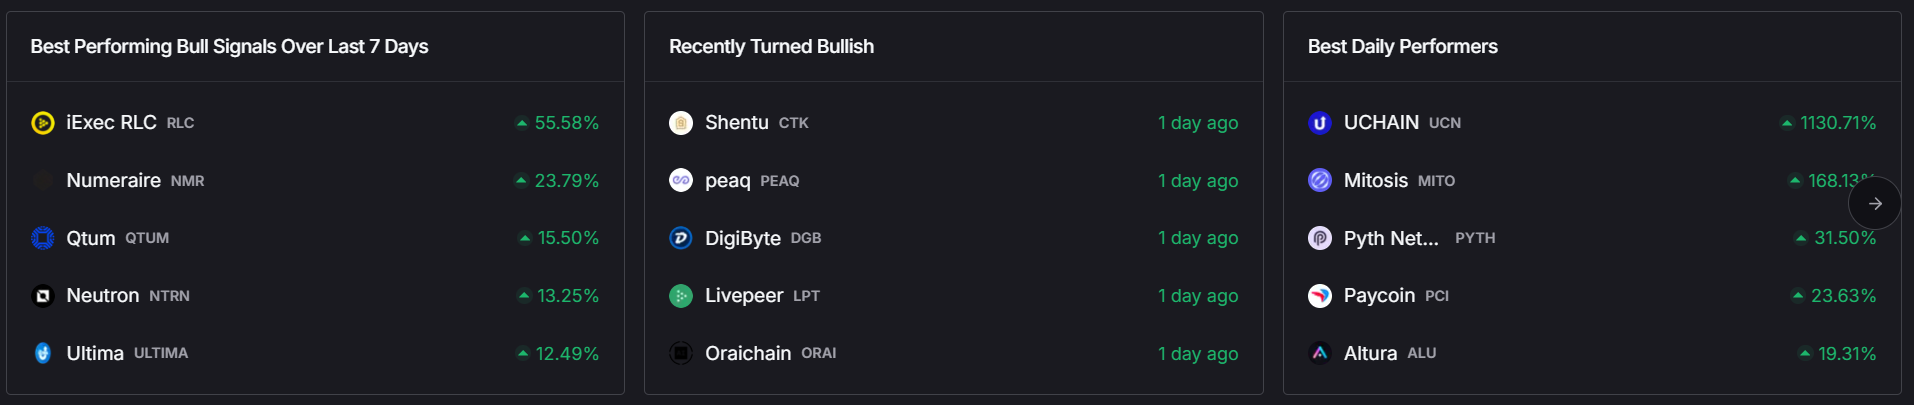
Projects Bucking the Trend: What's Actually Working

While most altcoins struggle, certain projects demonstrate sustainable growth models. Hyperliquid stands out as a prime example, maintaining consistent upward momentum through:

  • On-chain revenue generation: Real trading fees and volume
  • Token buyback mechanisms: 97% of revenue used for token purchases
  • Growing user adoption: Institutional-level trades moving to the platform

Similarly, projects with genuine utility and revenue sharing are outperforming purely speculative assets.

The Meme Coin Exception

Interestingly, meme coins represent one segment that continues generating significant returns, albeit with extreme volatility. Projects like Bub (up 30% recently) demonstrate that community-driven assets can still achieve impressive gains, though these remain high-risk trading opportunities rather than investment plays.

World Liberty Financial: The Next Major Catalyst

Looking ahead, World Liberty Financial (WLFI) represents a significant upcoming event. Backed by the Trump family and featuring partnerships with established DeFi projects, WLFI launches September 1st with several notable characteristics:

  • Fastest-growing stablecoin: USD1 reached $2.5 billion market cap
  • Strong institutional backing: $715 million raised across funding rounds
  • Treasury support: Alt 5 creating $1.5 billion treasury for the token
  • Pre-market trading: Currently available on major exchanges around $0.20

Strategies for the New Market Reality

Given these market dynamics, successful crypto participants are adapting their approaches:

For Non-Traders

  • Yield farming: Earn 7-10% on blue chips through DeFi protocols
  • Diversified staking: Spread risk across multiple platforms
  • Focus on revenue-sharing projects: Prioritize tokens with real utility

For Active Participants

  • Narrative trading: Follow attention cycles and social sentiment
  • Risk management: Take profits during pumps, maintain stop-losses
  • Sector rotation: Move between trending narratives (AI, DeFi, memes)

The Path Forward

The crypto market's evolution into a trader's paradise doesn't mean opportunities have disappeared—they've simply changed form. Success now requires:

  1. Accepting the new reality: Buy-and-hold strategies need modification
  2. Developing trading skills: Even long-term investors need exit strategies
  3. Following institutional flows: Treasury companies signal major trends
  4. Monitoring key indicators: Use tools like altcoin season metrics
  5. Risk management: Position sizing and profit-taking become crucial

Conclusion

The transformation of crypto from a fundamentals-driven market to an attention-based trading ecosystem represents a natural evolution as the space matures. While this shift has created challenges for traditional investors, it has also opened new opportunities for those willing to adapt their strategies.

The key lies in understanding that we're no longer in 2017 or 2021—we're in a new era where narrative, timing, and trading acumen matter more than technology assessments. Those who embrace this reality while maintaining disciplined risk management will be best positioned for success in the current market environment.

Whether you're yielding farming for steady returns, trading narratives for quick gains, or waiting for the next institutional wave, the most important step is acknowledging that the rules have changed—and your strategy should change with them.

Build Smarter Crypto Apps &
AI Agents in Minutes, Not Months
Real-time prices, trading signals, and on-chain insights all from one powerful API.
Grab a Free API Key
About Token Metrics
Token Metrics: AI-powered crypto research and ratings platform. We help investors make smarter decisions with unbiased Token Metrics Ratings, on-chain analytics, and editor-curated “Top 10” guides. Our platform distills thousands of data points into clear scores, trends, and alerts you can act on.
30 Employees
analysts, data scientists, and crypto engineers
Daily Briefings
concise market insights and “Top Picks”
Transparent & Compliant
Sponsored ≠ Ratings; research remains independent
Want Smarter Crypto Picks—Free?
See unbiased Token Metrics Ratings for BTC, ETH, and top alts.
Thank you! Your submission has been received!
Oops! Something went wrong while submitting the form.
 No credit card | 1-click unsubscribe
Token Metrics Team
Token Metrics Team

Recent Posts

Research

Moonshots API: Discover Breakout Tokens Before the Crowd

Token Metrics Team
5

The biggest gains in crypto rarely come from the majors. They come from Moonshots—fast-moving tokens with breakout potential. The Moonshots API surfaces these candidates programmatically so you can rank, alert, and act inside your product. In this guide, you’ll call /v2/moonshots, display a high-signal list with TM Grade and Bullish tags, and wire it into bots, dashboards, or screeners in minutes. Start by grabbing your key at Get API Key, then Run Hello-TM and Clone a Template to ship fast.

What You’ll Build in 2 Minutes

Why This Matters

Discovery that converts. Users want more than price tickers, they want a curated, explainable list of high-potential tokens. The Moonshots API encapsulates multiple signals into a short list designed for exploration, alerts, and watchlists you can monetize.

Built for builders. The endpoint returns a consistent schema with grade, signal, and context so you can immediately sort, badge, and trigger workflows. With predictable latency and clear filters, you can scale to dashboards, mobile apps, and headless bots without reinventing the discovery pipeline.

Where to Find The Moonshots API

The cURL request for the Moonshots endpoint is displayed in the top right of the API Reference. Grab it and start tapping into the potential!

How It Works (Under the Hood)

The Moonshots endpoint aggregates a set of evidence—often combining TM Grade, signal state, and momentum/volume context—into a shortlist of breakout candidates. Each row includes a symbol, grade, signal, and timestamp, plus optional reason tags for transparency.

For UX, a common pattern is: headline list → token detail where you render TM Grade (quality), Trading Signals (timing), Support/Resistance (risk placement), Quantmetrics (risk-adjusted performance), and Price Prediction scenarios. This enables users to understand why a token was flagged and how to act with risk controls.

Polling vs webhooks. Dashboards typically poll with short-TTL caching. Alerting flows use scheduled jobs or webhooks to smooth traffic and avoid duplicates. Always make notifications idempotent.

Production Checklist

Use Cases & Patterns

Next Steps

FAQs

1) What does the Moonshots API return?

A list of breakout candidates with fields such as symbol, tm_grade, signal (often Bullish/Bearish), optional reason tags, and updated_at. Use it to drive discover tabs, alerts, and watchlists.

2) How fresh is the list? What about latency/SLOs?

The endpoint targets predictable latency and timely updates for dashboards and alerts. Use short-TTL caching and queued jobs/webhooks to avoid bursty polling.

3) How do I use Moonshots in a trading workflow?

Common stack: Moonshots for discovery, Trading Signals for timing, Support/Resistance for SL/TP, Quantmetrics for sizing, and Price Prediction for scenario context. Always backtest and paper-trade first.

4) I saw results like “+241%” and a “7.5% average return.” Are these guaranteed?

No. Any historical results are illustrative and not guarantees of future performance. Markets are risky; use risk management and testing.

5) Can I filter the Moonshots list?

Yes—pass parameters like min_grade, signal, and limit (as supported) to tailor to your audience and keep pages fast.

6) Do you provide SDKs or examples?

REST works with JavaScript and Python snippets above. Docs include quickstarts, Postman collections, and templates—start with Run Hello-TM.

7) Pricing, limits, and enterprise SLAs?

Begin free and scale up. See API plans for rate limits and enterprise options.

Research

Support and Resistance API: Auto-Calculate Smart Levels for Better Trades

Token Metrics Team
4

Most traders still draw lines by hand in TradingView. The support and resistance API from Token Metrics auto-calculates clean support and resistance levels from one request, so your dashboard, bot, or alerts can react instantly. In minutes, you’ll call /v2/resistance-support, render actionable levels for any token, and wire them into stops, targets, or notifications. Start by grabbing your key on Get API Key, then Run Hello-TM and Clone a Template to ship a production-ready feature fast.

What You’ll Build in 2 Minutes

A minimal script that fetches Support/Resistance via /v2/resistance-support for a symbol (e.g., BTC, SOL).

  • A one-liner curl to smoke-test your key.
  • A UI pattern to display nearest support, nearest resistance, level strength, and last updated time.

Next Endpoints to add

  • /v2/trading-signals (entries/exits)
  • /v2/hourly-trading-signals (intraday updates)
  • /v2/tm-grade (single-score context)
  • /v2/quantmetrics (risk/return framing)

Why This Matters

Precision beats guesswork. Hand-drawn lines are subjective and slow. The support and resistance API standardizes levels across assets and timeframes, enabling deterministic stops and take-profits your users (and bots) can trust.

Production-ready by design. A simple REST shape, predictable latency, and clear semantics let you add levels to token pages, automate SL/TP alerts, and build rule-based execution with minimal glue code.

Where to Find

Need the Support and Resistance data? The cURL request for it is in the top right of the API Reference for quick access.

👉 Keep momentum: Get API Key • Run Hello-TM • Clone a Template

How It Works (Under the Hood)

The Support/Resistance endpoint analyzes recent price structure to produce discrete levels above and below current price, along with strength indicators you can use for priority and styling. Query /v2/resistance-support?symbol=<ASSET>&timeframe=<HORIZON> to receive arrays of level objects and timestamps.

Polling vs webhooks. For dashboards, short-TTL caching and batched fetches keep pages snappy. For bots and alerts, use queued jobs or webhooks (where applicable) to avoid noisy, bursty polling—especially around market opens and major events.

Production Checklist

  • Rate limits: Respect plan caps; add client-side throttling.
  • Retries/backoff: Exponential backoff with jitter for 429/5xx; log failures.
  • Idempotency: Make alerting and order logic idempotent to prevent duplicates.
  • Caching: Memory/Redis/KV with short TTLs; pre-warm top symbols.
  • Batching: Fetch multiple assets per cycle; parallelize within rate limits.
  • Threshold logic: Add %-of-price buffers (e.g., alert at 0.3–0.5% from level).
  • Error catalog: Map common 4xx/5xx to actionable user guidance; keep request IDs.
  • Observability: Track p95/p99; measure alert precision (touch vs approach).
  • Security: Store API keys in a secrets manager; rotate regularly.

Use Cases & Patterns

  • Bot Builder (Headless): Use nearest support for stop placement and nearest resistance for profit targets. Combine with /v2/trading-signals for entries/exits and size via Quantmetrics (volatility, drawdown).
  • Dashboard Builder (Product): Add a Levels widget to token pages; badge strength (e.g., High/Med/Low) and show last touch time. Color the price region (below support, between levels, above resistance) for instant context.
  • Screener Maker (Lightweight Tools): “Close to level” sort: highlight tokens within X% of a strong level. Toggle alerts for approach vs breakout events.
  • Risk Management: Create policy rules like “no new long if price is within 0.2% of strong resistance.” Export daily level snapshots for audit/compliance.

Next Steps

  • Get API Key — generate a key and start free.
  • Run Hello-TM — verify your first successful call.
  • Clone a Template — deploy a levels panel or alerts bot today.
  • Watch the demo: Compare plans: Scale confidently with API plans.

FAQs

1) What does the Support & Resistance API return?

A JSON payload with arrays of support and resistance levels for a symbol (and optional timeframe), each with a price and strength indicator, plus an update timestamp.

2) How timely are the levels? What are the latency/SLOs?

The endpoint targets predictable latency suitable for dashboards and alerts. Use short-TTL caching for UIs, and queued jobs or webhooks for alerting to smooth traffic.

3) How do I trigger alerts or trades from levels?

Common patterns: alert when price is within X% of a level, touches a level, or breaks beyond with confirmation. Always make downstream actions idempotent and respect rate limits.

4) Can I combine levels with other endpoints?

Yes—pair with /v2/trading-signals for timing, /v2/tm-grade for quality context, and /v2/quantmetrics for risk sizing. This yields a complete decide-plan-execute loop.

5) Which timeframe should I use?

Intraday bots prefer shorter horizons; swing/position dashboards use daily or higher-timeframe levels. Offer a timeframe toggle and cache results per setting.

6) Do you provide SDKs or examples?

Use the REST snippets above (JS/Python). The docs include quickstarts, Postman collections, and templates—start with Run Hello-TM.

7) Pricing, limits, and enterprise SLAs?

Begin free and scale as you grow. See API plans for rate limits and enterprise SLA options.

Disclaimer

This content is for educational purposes only and does not constitute financial advice. Always conduct your own research before making any trading decisions.

Research

Quantmetrics API: Measure Risk & Reward in One Call

Token Metrics Team
5

Most traders see price—quants see probabilities. The Quantmetrics API turns raw performance into risk-adjusted stats like Sharpe, Sortino, volatility, drawdown, and CAGR so you can compare tokens objectively and build smarter bots and dashboards. In minutes, you’ll query /v2/quantmetrics, render a clear performance snapshot, and ship a feature that customers trust. Start by grabbing your key at Get API Key, Run Hello-TM to verify your first call, then Clone a Template to go live fast.

What You’ll Build in 2 Minutes

  • A minimal script that fetches Quantmetrics for a token via /v2/quantmetrics (e.g., BTC, ETH, SOL).
  • A smoke-test curl you can paste into your terminal.
  • A UI pattern that displays Sharpe, Sortino, volatility, max drawdown, CAGR, and lookback window.

Next Endpoints to Add

  • /v2/tm-grade (one-score signal)
  • /v2/trading-signals
  • /v2/hourly-trading-signals (timing)
  • /v2/resistance-support (risk placement)
  • /v2/price-prediction (scenario planning)

Why This Matters

Risk-adjusted truth beats hype. Price alone hides tail risk and whipsaws. Quantmetrics compresses edge, risk, and consistency into metrics that travel across assets and timeframes—so you can rank universes, size positions, and communicate performance like a professional.

Built for dev speed

A clean REST schema, predictable latency, and easy auth mean you can plug Sharpe/Sortino into bots, dashboards, and screeners without maintaining your own analytics pipeline. Pair with caching and batching to serve fast pages at scale.

Where to Find

The Quant Metrics cURL request is located in the top right of the API Reference, allowing you to easily integrate it with your application.

Build Smarter Crypto Apps & AI Agents with Token Metrics

Token Metrics provides real-time prices, trading signals, and on-chain insights all from one powerful API. Grab a Free API Key

How It Works (Under the Hood)

Quantmetrics computes risk-adjusted performance over a chosen lookback (e.g., 30d, 90d, 1y). You’ll receive a JSON snapshot with core statistics:

  • Sharpe ratio: excess return per unit of total volatility.
  • Sortino ratio: penalizes downside volatility more than upside.
  • Volatility: standard deviation of returns over the window.
  • Max drawdown: worst peak-to-trough decline.
  • CAGR / performance snapshot: geometric growth rate and best/worst periods.

Call /v2/quantmetrics?symbol=<ASSET>&window=<LOOKBACK> to fetch the current snapshot. For dashboards spanning many tokens, batch symbols and apply short-TTL caching. If you generate alerts (e.g., “Sharpe crossed 1.5”), run a scheduled job and queue notifications to avoid bursty polling.

Production Checklist

  • Rate limits: Understand your tier caps; add client-side throttling and queues.
  • Retries & backoff: Exponential backoff with jitter; treat 429/5xx as transient.
  • Idempotency: Prevent duplicate downstream actions on retried jobs.
  • Caching: Memory/Redis/KV with short TTLs; pre-warm popular symbols and windows.
  • Batching: Fetch multiple symbols per cycle; parallelize carefully within limits.
  • Error catalog: Map 4xx/5xx to clear remediation; log request IDs for tracing.
  • Observability: Track p95/p99 latency and error rates; alert on drift.
  • Security: Store API keys in secrets managers; rotate regularly.

Use Cases & Patterns

  • Bot Builder (Headless): Gate entries by Sharpe ≥ threshold and drawdown ≤ limit, then trigger with /v2/trading-signals; size by inverse volatility.
  • Dashboard Builder (Product): Add a Quantmetrics panel to token pages; allow switching lookbacks (30d/90d/1y) and export CSV.
  • Screener Maker (Lightweight Tools): Top-N by Sortino with filters for volatility and sector; add alert toggles when thresholds cross.
  • Allocator/PM Tools: Blend CAGR, Sharpe, drawdown into a composite score to rank reallocations; show methodology for trust.
  • Research/Reporting: Weekly digest of tokens with Sharpe ↑, drawdown ↓, and volatility ↓.

Next Steps

  • Get API Key — start free and generate a key in seconds.
  • Run Hello-TM — verify your first successful call.
  • Clone a Template — deploy a screener or dashboard today.
  • Watch the demo: VIDEO_URL_HERE
  • Compare plans: Scale with API plans.

FAQs

1) What does the Quantmetrics API return?

A JSON snapshot of risk-adjusted metrics (e.g., Sharpe, Sortino, volatility, max drawdown, CAGR) for a symbol and lookback window—ideal for ranking, sizing, and dashboards.

2) How fresh are the stats? What about latency/SLOs?

Responses are engineered for predictable latency. For heavy UI usage, add short-TTL caching and batch requests; for alerts, use scheduled jobs or webhooks where available.

3) Can I use Quantmetrics to size positions in a live bot?

Yes—many quants size inversely to volatility or require Sharpe ≥ X to trade. Always backtest and paper-trade before going live; past results are illustrative, not guarantees.

4) Which lookback window should I choose?

Short windows (30–90d) adapt faster but are noisier; longer windows (6–12m) are steadier but slower to react. Offer users a toggle and cache each window.

5) Do you provide SDKs or examples?

REST is straightforward (JS/Python above). Docs include quickstarts, Postman collections, and templates—start with Run Hello-TM.

6) Polling vs webhooks for quant alerts?

Dashboards usually use cached polling. For threshold alerts (e.g., Sharpe crosses 1.0), run scheduled jobs and queue notifications to keep usage smooth and idempotent.

7) Pricing, limits, and enterprise SLAs?

Begin free and scale up. See API plans for rate limits and enterprise SLA options.

Disclaimer

All information provided in this blog is for educational purposes only. It is not intended as financial advice. Users should perform their own research and consult with licensed professionals before making any investment or trading decisions.

Choose from Platinum, Gold, and Silver packages
Reach with 25–30% open rates and 0.5–1% CTR
Craft your own custom ad—from banners to tailored copy
Perfect for Crypto Exchanges, SaaS Tools, DeFi, and AI Products