Research

The Great Crypto Rotation - Why Smart Money is Moving from Bitcoin to Ethereum

The Ethereum rotation story isn't just about ETH itself—it's about the entire ecosystem of projects built on Ethereum's infrastructure. Base-layer tokens, DeFi protocols, and Ethereum-native projects have already begun showing strength, with tokens like Aerodrome and Zora experiencing significant runs during Ethereum's rally from $2,300 to nearly $5,000.
Talha Ahmad
8 min
MIN

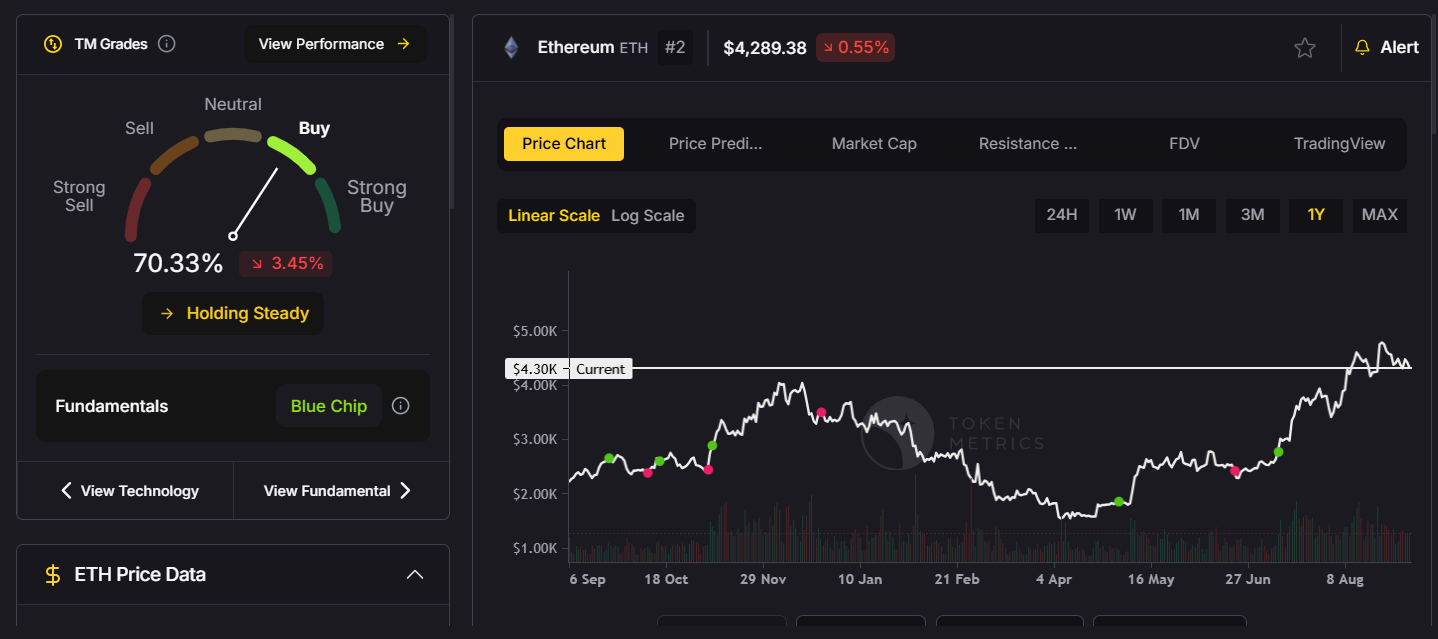
The cryptocurrency market is experiencing a seismic shift that most investors are missing. While Bitcoin has long been the undisputed king of digital assets, institutional money is quietly rotating into Ethereum at an unprecedented pace, signaling a potential altcoin season that could reshape the entire market landscape.

The Numbers Don't Lie: Ethereum's Institutional Takeover

Recent data reveals a striking trend that should have every crypto investor's attention. In August alone, Ethereum ETFs attracted a staggering $3.69 billion in inflows, marking the fourth consecutive month of positive institutional investment. This stands in stark contrast to Bitcoin, which saw $800 million in outflows during the same period.

This isn't just a minor adjustment in portfolio allocation—it's a fundamental shift in how institutional investors view the crypto ecosystem. The rotation from Bitcoin to Ethereum represents more than just diversification; it's a bet on the future of decentralized finance, smart contracts, and blockchain utility beyond simple store-of-value propositions.

The Stablecoin Revolution: Ethereum's Secret Weapon

Behind Ethereum's surge lies a powerful but often overlooked driver: the stablecoin economy. Currently, 3.4% of Ethereum's total circulating supply is held by treasury companies, with this percentage accelerating rapidly since July. This trend reflects a broader recognition that stablecoins represent crypto's "ChatGPT moment"—the application that finally demonstrates blockchain's real-world utility to mainstream users.

The stablecoin narrative extends far beyond simple transfers. New Layer 1 blockchains like Plasma are emerging specifically to facilitate zero-fee USDT transfers, directly challenging Tron's dominance in this space. With over $1 billion in USDT deposits on its testnet alone, Plasma demonstrates the massive demand for efficient stablecoin infrastructure.

Technical Indicators Point to Altcoin Season

Market technicals support the institutional flow narrative. The Bitcoin versus Altcoin season chart shows that 58% of returns are currently coming from altcoins—a surprising figure considering the market's neutral-to-bearish sentiment. Historically, true altcoin season occurs when nearly 90% of returns flow to alternatives, as seen in August 2022 and May 2021.

This data suggests the market hasn't yet experienced the full-blown altcoin euphoria typical of cycle peaks. The implication? The current cycle may extend well into 2026, providing extended opportunities for strategic investors willing to look beyond Bitcoin's dominance.

The Political Crypto Play: World Liberty Financial's Market Impact

The launch of World Liberty Financial (WLFI) adds another layer to the evolving crypto landscape. Amid the ongoing selling pressure, the token's ability to hold above $0.20 will determine its strength in the coming days. The same level where treasury companies accumulated positions indicates underlying institutional support. With the Trump family reportedly owning a third of the supply and generating approximately $3 billion in value at launch, WLFI represents the intersection of politics and crypto in unprecedented ways.

This political backing could provide regulatory tailwinds for the broader crypto market, particularly as other politicians consider similar token launches. California Governor Gavin Newsom's rumored meme coin plans suggest that cryptocurrency fundraising may become a standard tool for political campaigns, bringing mainstream legitimacy to digital assets.

Strategic Implications for Investors

The Ethereum rotation story isn't just about ETH itself—it's about the entire ecosystem of projects built on Ethereum's infrastructure. Base-layer tokens, DeFi protocols, and Ethereum-native projects have already begun showing strength, with tokens like Aerodrome and Zora experiencing significant runs during Ethereum's rally from $2,300 to nearly $5,000.

However, this market requires a different investment approach than previous cycles. The old "buy and hold" strategy shows diminishing returns in today's narrative-driven environment. Instead, successful investors are adapting to shorter holding periods, focusing on trending tokens with strong fundamentals and clear catalysts.

The key insight? We're witnessing the maturation of cryptocurrency from a speculative asset class to a functional financial infrastructure. Ethereum's institutional adoption, stablecoin integration, and smart contract capabilities position it as the backbone of this new financial system. Investors who recognize this transition early stand to benefit from one of the most significant shifts in crypto market dynamics since Bitcoin's inception.

Build Smarter Crypto Apps &
AI Agents in Minutes, Not Months
Real-time prices, trading signals, and on-chain insights all from one powerful API.
Grab a Free API Key
Token Metrics Team
Token Metrics Team

Recent Posts

Research

Trader vs. Investor Grade: How to Use Both for Smarter Crypto Bets

Token Metrics Team
4 min
MIN

Crypto trading success often boils down to timing. But how do you know when to enter — and when to stay long? Token Metrics solves this dilemma with a dual-grade system: Trader Grade and Investor Grade. Each grade serves a different investment goal, and together, they help you make more confident decisions, whether you’re day trading or holding for the long run.

What is the Trader Grade?
The Trader Grade measures short-term momentum. It uses AI to analyze price action, volume trends, technical indicators, and recent sentiment shifts. Scores range from 0 to 100, and a score above 80 signals strong short-term potential.

Use Case:

  • Perfect for swing traders and short-term opportunists.
  • Look for tokens with Trader Grade > 80 for potential breakout trades.
  • Example: Launchcoin had a Trader Grade above 90 before its 35x rally began.

What is the Investor Grade?
The Investor Grade focuses on long-term fundamentals. It’s designed for those who want to hold tokens for months or even years. This grade considers tokenomics, development activity, ecosystem strength, narrative alignment, and long-term price structure.

Use Case:

  • Ideal for long-term portfolio builders.
  • A token with Investor Grade > 80 is a strong candidate for accumulation.
  • AI infrastructure tokens and modular blockchains often rank high here.

Why Use Both?
Most traders fail by only looking at hype or short-term charts. Token Metrics lets you blend data:

  • High Trader Grade + Low Investor Grade? Consider a short-term trade, not a long hold.
  • High Investor Grade + Low Trader Grade? Consider waiting for a better entry point.
  • Both High? Green light for confidence in both entry and long-term performance.

Case Study: Balancing Your Portfolio with Grades
Users can use the dual-grade approach for smarter allocation:

  • 30% of capital to high Trader Grade tokens (short-term plays)
  • 70% to high Investor Grade tokens (long-term holds)

This method helps mitigate risk and improve overall ROI.

Where to Find the Grades
Both grades are displayed prominently across:

  • Token Detail Pages – Real-time grade updates with historical data
  • Market Page Filters – Sort tokens by grade thresholds
  • Portfolio Builder Tool – Automatically selects tokens with strong grades

Tips for Grade-Based Trading

  1. Use Trader Grade for volatile markets or when prices are accelerating.
  2. Use Investor Grade when building positions in strong narratives like AI, DeFi, or infrastructure.
  3. Avoid tokens with both grades below 60 unless you’re making a speculative bet.

Conclusion
Trading without context is gambling. Token Metrics’ Trader and Investor Grades give you a proven framework for assessing both momentum and fundamentals. Whether you’re here for a quick flip or a long-term bet, using the dual-grade system can level up your crypto strategy.

Announcements

Inside the Dashboard: How to Monitor API Key Activity and Monthly Usage in Real Time

Token Metrics Team
5 min
MIN

The power of any great API isn’t just in the data it provides — it’s also in the control, visibility, and accountability it gives developers. That’s why the Token Metrics API Dashboard is more than just a place to generate keys — it’s your real-time command center for monitoring API key usage, managing access, and optimizing performance.

In this article, we’ll explore how to use the Token Metrics API Dashboard to stay in control of your app’s data usage, track request history, and ensure your integrations remain secure and efficient.

📍 Where to Find It

To access the dashboard:

  1. Log in to your Token Metrics account.
  2. Go to: https://app.tokenmetrics.com/en/api
  3. Navigate to the API Keys and API Usage sections.

🔐 View and Manage API Keys

The API Keys section gives you a complete overview of every active key associated with your account. For each key, you’ll see:

  • Key Name: Descriptive labels like "Bot A" or "Staging Server"
  • Created Date: When the key was generated
  • Last Used: Timestamp of the most recent request
  • Status: Active or inactive toggle
  • Actions: Trash icon to instantly delete a key

💡 Why It Matters:

  • Spot unused or stale keys that may pose a security risk
  • Instantly disable or delete a key if it’s compromised
  • Monitor which app or environment is making the most requests

📊 Monitor API Usage in Real-Time

In the Usage Dashboard, Token Metrics gives you deep insights into how your API credits are being used.

Key metrics include:

  • API Calls Graph
    A daily call volume chart so you can identify peaks in usage, anomalies, or unexpected surges.

  • Total Monthly API Calls
    Example:
    8,750 / 20,000
    See how much of your monthly quota you’ve used — and when it resets.

  • Remaining API Credits
    Know exactly how many calls you have left in your current cycle.

  • API Call Statistics Table
    Each row includes:

    • Endpoint accessed (e.g., /trader-grade)
    • Timestamp of the request
    • Status code (200 = success, 401 = unauthorized, etc.)
    • Originating IP address
    • Success/failure response

🔄 Debugging & Insights Made Easy

This dashboard doesn’t just monitor—it helps you debug and optimize.

  • Quickly identify if your integration is repeatedly hitting 400 or 403 errors
  • Check whether a specific key is being overused or underused
  • Pinpoint spikes in usage that may indicate unauthorized access
  • See which endpoints are called most often — and consider caching results

⚠️ Avoid Rate Limit Surprises

If you’re on a Basic or Advanced plan, you’ll have a rate limit (e.g., 1 req/min for free users, up to 600 req/min for VIPs). The dashboard helps ensure you stay within your limits — and scale appropriately when needed.

🚀 Build Better with Transparency

In a production environment, visibility into API activity is critical. With Token Metrics, you’re never flying blind. You always know:

  • Which app is using which key
  • How many credits you’re using
  • When to optimize or upgrade

From security to scaling, the Token Metrics API Dashboard gives you the insight you need to build with clarity and control.

👉 Launch Your API Dashboard Now → tokenmetrics.com/api

Research

Is the Crypto Market Bullish or Bearish? Why 2025 Is the Year of Neutral Momentum

Token Metrics Team
3 min
MIN

The crypto market isn't clearly bullish or bearish in mid-2025 — it's neutral. This article explores why this 'in-between' momentum could signal a maturing market cycle, and what investors should watch for as signals normalize after a sharp $1T rebound in total market cap.

As we navigate through the midpoint of 2025, one question dominates trading desks and Telegram groups alike: Is the crypto market bullish or bearish? Surprisingly, the answer might be neither. Current indicators suggest that we are in a neutral zone — an ambiguous space where the market is no longer surging with euphoric gains but isn’t plunging into panic either.

From January through mid-May, the total crypto market cap has grown from $1 trillion to $2 trillion. This swift rebound signals recovery, but not full-blown optimism. Instead, many analysts — ourselves included — interpret this as a healthy correction and stabilization following intense early-year volatility.

This kind of environment often marks the early stages of a maturing cycle. Unlike the sharp swings we saw in previous bull and bear markets, 2025’s trend suggests more measured growth, driven by fundamentals rather than hype. In other words, the market might finally be learning from its past.

That doesn’t mean the space lacks activity. Sectors like DeFi lending and AI-related tokens continue to gain traction, with significant TVL inflows. Retail interest in meme coins also remains high in select regions. But overall, what we’re seeing is consolidation — not chaos.

In this neutral setting, strategy matters more than sentiment. It's no longer about jumping into trending narratives or panic-selling on dips. Instead, identifying projects with real use cases, sustainable economics, and strong communities has become the foundation of long-term success.

For traders and builders alike, the current landscape offers both challenges and opportunities. Risk-adjusted returns are key, and disciplined portfolio rebalancing could be one of the most underrated strategies right now.

As we continue monitoring market signals, we remain committed to surfacing actionable insights backed by real-time data, not just narratives. Whether the next breakout is weeks or months away, staying informed — and unemotional — may prove to be your best edge.

How Token Metrics Helps in a Neutral Market Environment:

In times of neutral momentum, making profitable crypto decisions becomes more complex — and that's where Token Metrics shines:

  1. Actionable AI Signals:
    Token Metrics scans thousands of tokens daily, using over 80 data points to identify bullish and bearish trends even when market sentiment is flat. This helps users cut through noise and act on real opportunities.
  2. Investor & Trader Grades:
    When hype fades, fundamentals matter. Our proprietary grades evaluate both short-term momentum and long-term viability, helping users discover tokens with staying power — not just temporary pumps.
  3. Smart Rebalancing Alerts:
    In a consolidating market, maintaining the right portfolio mix is crucial. Token Metrics' indices and alerts help users rebalance regularly to lock in gains and minimize downside risks.
  4. Sector-Based Insights:
    With DeFi, AI, and meme coins behaving differently, Token Metrics allows users to dive deep into sector-specific analytics — so you can position ahead of capital flows.
  5. Sentiment & Volume Monitoring:
    Our platform tracks shifts in on-chain activity, social sentiment, and volume trends to spot early signs of market reversals — especially useful when traditional signals stall.

In a market where being early beats being emotional, Token Metrics equips you with the clarity and tools to trade with confidence.

Choose from Platinum, Gold, and Silver packages
Reach with 25–30% open rates and 0.5–1% CTR
Craft your own custom ad—from banners to tailored copy
Perfect for Crypto Exchanges, SaaS Tools, DeFi, and AI Products